scatterbar is an open-source R package for displaying proportional data across spatially resolved contexts. This is the scatterbar R documentation website. Questions, suggestions, or problems should be submitted as GitHub issues.
![]()
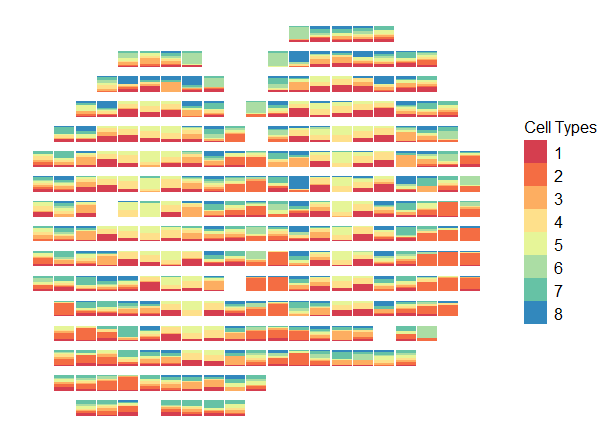
Overview
By combining the concepts of scatter plots and stacked bar charts, scatterbar allows users to visualize variations in proportional data data and compare across different spatial locations.