Lesson 1: Data Visualization Theory
Table of ContentsLecture 1
1.0 Lesson learning objectives
By the end of this lesson, we should be able to establish a common vocabulary for discussing data visualizations. We will also begin programming in R.
1.1 Attribution
This lesson is heavily built on “Fundamentals of Data Visualization” by Claus O. Wilke. You can find a free copy of this book on Dr. Wilke’s website: https://clauswilke.com/dataviz
1.2 What is data visualization? And why do we care?
Data visualization is the graphical representation of data. When done appropriately, a good data visualization can (1) help identify patterns and trends in the data to help people perceive certain information faster or more easily, and (2) help explain these patterns to a wider audience. We will refer to these two goals of data visualization as “exploratory” and “explanatory” objectives.
1.3 Gestalt principles
Gestalt principles are an essential part of visual design (generally, not just data visualization). There are more than ten overlapping principles. We will focus a few most applicable to data visualization.
- Similarity: Items alike in their properties (size, shape, color, and so on) tend to be perceived as being a related group.
- Proximity: Items are near each other tend to be perceived as being a related group.
- Enclosure: Items surrounded by something such as a line or an an object tend to be perceived as being a group.
- Continuity: Elements tend to be perceived as smooth groups or continuous lines rather than sharp broken lines.
1.4 Data types
Different types of data can be visualized in different ways using different visual encodings. There are many types of data:
- Categorical data represent qualitative characteristics. Categorical data can take on numerical values, but those numbers don’t have mathematical meaning.
- Ordinal data represent mixes numerical and categorical data. The data fall into categories, but the numbers placed on the categories have meaning.
- Quantitative data represent numerical values. Values can be interpreted mathematically.
- Relational data represent how numerical and categorical data are related
- Spatial data represents information about the physical location and shape
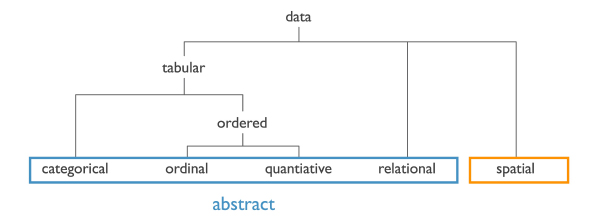
(Image credit: Nils Gehlenborg, ISMB/ECCB 2011)
1.5 Data encodings
Types of encodings for different data types including
- Geometric primitives such as points, lines, and areas
- Visual channels such as size, color, shape, position, angle, and texture
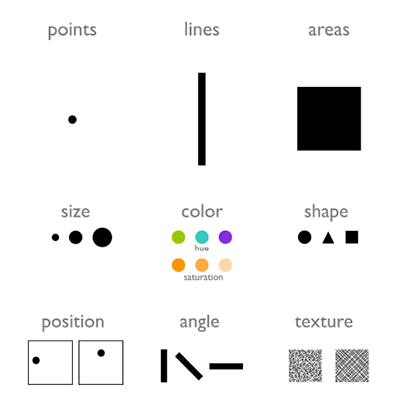
(Image credit: Nils Gehlenborg, ISMB/ECCB 2011)
1.6 Salience
Salience (in data visualization) is how the viewer’s eye is drawn to what is important in the data visualization. A good data visualization enhances saliency e.g. improves viewer understanding of the data.
Different data encodings for different data types offer differing levels of salience.
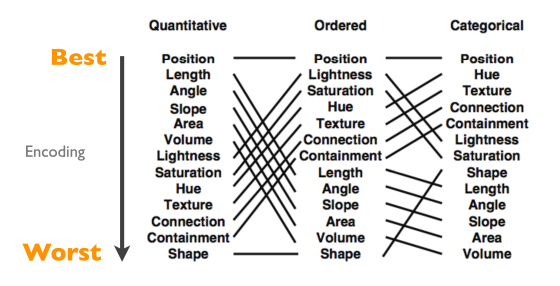
(Image credit: Munzner, Visualization Analysis and Design, 2014; adapted from Mackinlay, Automating the Design of Graphical Presentations of Relational Information, 1986)
Hands-on component 1
Our in-class hands-on component will focus on introducing students to the R programming language, RStudio, and gaining experience with ggplot2.
Class Lesson Notes 1
Prof. Fan’s notes from class: genomic-data-visualization-Lesson_1.pptx (click to download)
Prof. Fan’s code from class: code-01-25-2023.R (click to download)
Homework Assignment 1
None. Complete Homework Assignment 0 if you have not done so yet.