Spatial Transcriptomics Analysis Of Xenium Lymph Node
Mar 24, 2024
SEraster + MERINGUE identifies spatially variable genes in the human lymph node assayed by 10X Xenium spatial transcriptomics platform
In this blog post, I will identify spatially variable genes in a spatial
transcriptomic dataset with 377,985 cells in a section of human lymph
node assayed by the 10X Xenium technology. In particular, I will use our
recently developed tool SEraster to preprocess this dataset to make
other analyses faster for our other previously published tool MERINGUE for characterizing spatially gene expression heterogeneity. For more details about SEraster, check out our
bioRxiv preprint “SEraster: a rasterization preprocessing
framework for scalable spatial omics data
analysis”.
Getting started with Single-Cell Resolution Spatial Transcriptomics Data from 10X Xenium
Spatial transcriptomics refers to a set of technologies that allow us to
measure how genes are expressed within thin tissue slices. One such
technology, 10X Xenium, provides high single-cell resolution gene
expression measurements for a targeted panel of genes. Let’s download a
publicly available Xenium dataset of the human lymph node from the 10X
website.
Specifically, I will download the Xenium output bundle file and unzip
its contents to my directory called dir.
dir <- 'xenium_data/human-lymph-node-preview-data-xenium-human-multi-tissue-and-cancer-panel-1-standard/Xenium_V1_hLymphNode_nondiseased_section_outs/'
Many of our analyses rely on knowing the single cell positions as well
as the gene expression associated with each single cell. In this Xenium
bundle, the single cell positions are stored in a cells.parquet file.
I can read this parquet file using
sparklyr.
#install.packages("sparklyr")
library(sparklyr)

#spark_available_versions()
#spark_install("3.5")
spark_session <- spark_connect(master = "local", version="3.5")
parquet_data_spark <- spark_read_parquet(spark_session, name = "parquet_data", path = paste0(dir, 'cells.parquet'))
pos.info <- collect(parquet_data_spark)
spark_disconnect(spark_session)

head(pos.info)
## # A tibble: 6 × 11
##   cell_idx_centroid y_centroid transcript_counts control_probe_counts
##   <chr>   <dbl>  <dbl> <dbl><dbl>
## 1 aaaabaep-1   810.   853.250
## 2 aaaabhgn-1   813.   858.400
## 3 aaaabjel-1   811.   866.590
## 4 aaaaeadi-1   815.   843.   1530
## 5 aaaaggdm-1   815.   871.720
## 6 aaaajdkg-1   819.   863.630
## # ℹ 6 more variables: control_codeword_counts <dbl>,
## #   unassigned_codeword_counts <dbl>, deprecated_codeword_counts <dbl>,
## #   total_counts <dbl>, cell_area <dbl>, nucleus_area <dbl>
Likewise, the gene expression information for each cell are stored in a
sparse matrix representation in cell_feature_matrix.h5. We can read
this .h5 file using
rhdf5.
## BiocManager::install("rhdf5")
library(rhdf5)
h5file <- paste0(dir, "cell_feature_matrix.h5")
h5ls(h5file)
##     group  name   otype  dclass  dim
## 0   /matrix   H5I_GROUP
## 1   /matrix  barcodes H5I_DATASET  STRING   377985
## 2   /matrix  data H5I_DATASET INTEGER 10683566
## 3   /matrix  features   H5I_GROUP
## 4   /matrix/features _all_tag_keys H5I_DATASET  STRING1
## 5   /matrix/features  feature_type H5I_DATASET  STRING  541
## 6   /matrix/featuresgenome H5I_DATASET  STRING  541
## 7   /matrix/featuresid H5I_DATASET  STRING  541
## 8   /matrix/features  name H5I_DATASET  STRING  541
## 9   /matrix   indices H5I_DATASET INTEGER 10683566
## 10  /matrixindptr H5I_DATASET INTEGER   377986
## 11  /matrix shape H5I_DATASET INTEGER2
h5 <- h5read(h5file, "matrix")
barcodes <- as.character(h5read(h5file, "matrix/barcodes"))

## from https://gist.github.com/slowkow/d3c4b77c9bf2a75f6dad4843d7d3aefc
library(Matrix)
counts <- sparseMatrix(
	dims = h5$shape,
	i = as.numeric(h5$indices),
	p = as.numeric(h5$indptr),
	x = as.numeric(h5$data),
	index1 = FALSE
)
colnames(counts) <- barcodes
rownames(counts) <- as.data.frame(h5[["features"]])$name

head(counts)
## 6 x 377985 sparse Matrix of class "dgCMatrix"

##   [[ suppressing 34 column names 'aaaabaep-1', 'aaaabhgn-1', 'aaaabjel-1' ... ]]

##
## ABCC11 . . . . . . . . . . . . . . . . . . . . . . . . . . . . . . . . . .
## ACE2   . . . . . . 1 . . . . . . . . . . . . . . . . . . . . . . . . . . .
## ACKR1  . . . . . . . . 1 . . . . . . . . . . . . . . . 1 . . . . . . 1 . .
## ACTA2  . . . . . . . . . . . . . . . 1 1 . 2 . . 4 . . 1 . . . . 9 1 . . .
## ACTG2  . . 1 2 2 . . . . . 1 . . . . 1 2 1 1 . . . 1 . 1 1 . . 1 3 1 . . .
## ADAM28 . 2 3 . 1 1 1 . 2 . 1 . . 1 1 . . 2 . . 2 . . . . 4 . . 1 . . . . .
##
## ABCC11 ......
## ACE2   ......
## ACKR1  ......
## ACTA2  ......
## ACTG2  ......
## ADAM28 ......
##
##  .....suppressing 377951 columns in show(); maybe adjust 'options(max.print= *, width = *)'
##  ..............................
dim(counts)
## [1]541 377985
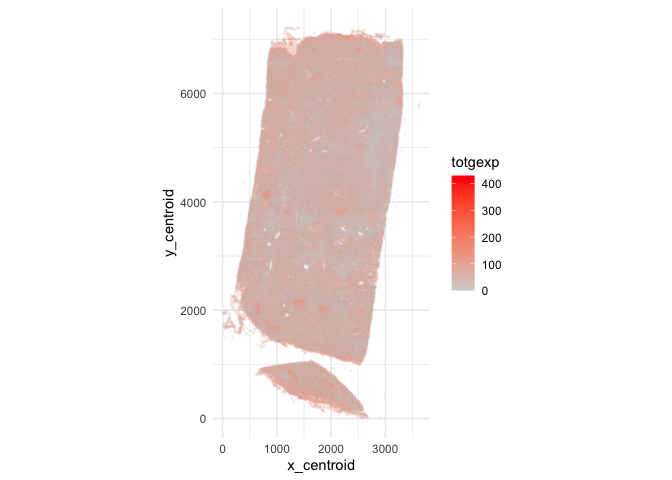
Note, there are 541 targeted genes (including blank controls, etc) for
377,985 single cells in this dataset! Let’s visualize the cell positions
and the total number of genes detected per cell using
ggplot2.
library(ggplot2)
ggplot(data.frame(pos.info, totgexp=colSums(counts))) +
	geom_point(aes(x = x_centroid, y = y_centroid, col=totgexp),
	size=0.01, alpha=0.1) +
	scale_color_gradient(low = 'lightgrey', high='red') +
	theme_minimal() + coord_fixed()
Preprocessing with SEraster
As we discuss in our SEraster
preprint,
analyzing such a large number of cells may be computationally demanding and slow. We also highlight how for certain analysis such as tissue-scale spatially variable gene detection, single-cell resolution analysis may not be needed to identify bonda fide spatially variable genes. So I will use SEraster to rasterize our 377,985 single cells into a smaller number of pixels as a preprocessing step to make later analyses much faster.
SEraster takes
SpatialExperiment
objects as its input. So we will first create a SpatialExperiment
object using the single cell positions and gene expression information
we just read in.
library(SpatialExperiment)

pos <- as.matrix(cbind(x=pos.info$x_centroid, y=pos.info$y_centroid))
rownames(pos) <- pos.info$cell_id
se <- SpatialExperiment(
	assays = list(counts = counts),
	spatialCoords = pos[colnames(counts),]
)
I’m now ready to use SEraster to aggregate cells into 100-unit resolution pixels,
where the unit is defined by the units of the x,y spatial positions. I
have the option to aggregate into square pixels (default) or hexagon;
this particular choice doesn’t make much practical difference in the
downstream analysis. But just for fun, I will set the default square
parameter to FALSE so we create hexagon pixels.
#require(remotes)
#remotes::install_github('JEFworks-Lab/SEraster')
library(SEraster)

res <- 100

t <- Sys.time() # Keep track of time
rastGexp <- SEraster::rasterizeGeneExpression(se,
	assay_name="counts",
	resolution = res,
	square=FALSE,
	n_threads = 1)
Sys.time() - t
## Time difference of 1.092733 mins
class(rastGexp)
## [1] "SpatialExperiment"
## attr(,"package")
## [1] "SpatialExperiment"
dim(rastGexp)
## [1] 541 2053
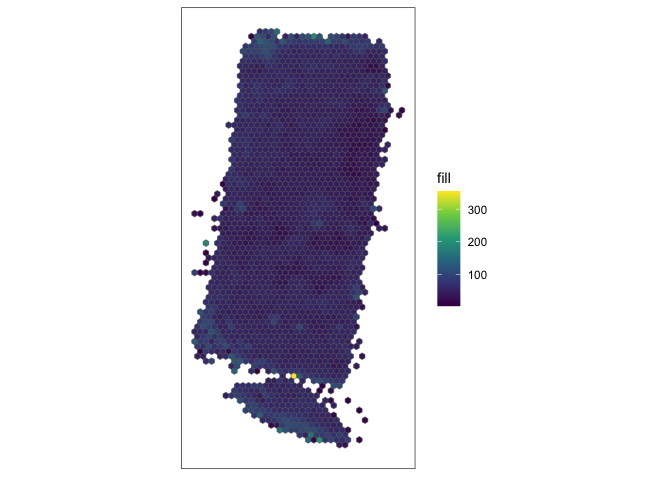
The output from SEraster is another SpatialExperiment object with 541 genes like before but now only 2053 pixels. Note,
the default aggregation function used here is the mean. This helps ensure that our spatial variable gene expression analysis later is not confounded by cell density. So the outputted SpatialExperiment object contains spatial positions of 100-unit
hexagon pixels where the value associated with each pixel is the average
gene expression for all cells within that pixel. I can visualize the 100
unit hexagon pixels and the average total number of genes detected for
all cells within each pixel.
SEraster::plotRaster(rastGexp)
Identifying spatially variable genes with MERINGUE
I will use our previously developed tool MERINGUE to run Moran’s I, a statistic of spatial autocorrelation in order to identify spatially variable genes on the rasterized gene expression. To assist with this, I will pull out the pixel positions and the pixel gene expression values.
rastpos <- spatialCoords(rastGexp)
pixelval <- assay(rastGexp, 'pixelval')

library(MERINGUE)
# Make adjacency weight matrix based on Voronoi tessellation
w <- MERINGUE::getSpatialNeighbors(rastpos, filterDist = res)
# Identify sigificantly spatially auto-correlated genes
t <- Sys.time() # Keep track of time
I <- getSpatialPatterns(pixelval, w)
Sys.time() - t
## Time difference of 19.20412 secs
table(I$p.adj < 0.05)
## FALSE  TRUE
##   256   283
Neat! I was able to identify 283 spatially variable genes distinguished
from 256 non-spatially variable genes. As we note in our publication
“Characterizing spatial gene expression heterogeneity in spatially
resolved single-cell transcriptomic data with nonuniform cellular
densities”, not all
spatial patterns are equal. So I will use MERINGUE to evaluate Local
Indicators of Spatial Autocorrelation to quantify the percentage of
cells driving each spatial pattern.
Isub <- MERINGUE::filterSpatialPatterns(
	pixelval,
	I, w,
	details = TRUE
)
## Number of significantly autocorrelated genes: 283

## ...driven by > 102.65 cells: 127
head(Isub)
##         observed  expected sd p.value p.adj minPercentCells
## ACTA2   0.3967846 -0.0004873294 0.01782539   0 0  0.05455431
## ACTG2   0.2075803 -0.0004873294 0.01778370   0 0  0.08913785
## ADAM28  0.5391287 -0.0004873294 0.01918476   0 0  0.23721383
## ADAMTS1 0.3845269 -0.0004873294 0.01885272   0 0  0.05747686
## AIF1    0.3613689 -0.0004873294 0.01891281   0 0  0.06721870
## APOLD1  0.4270495 -0.0004873294 0.01882642   0 0  0.06527034
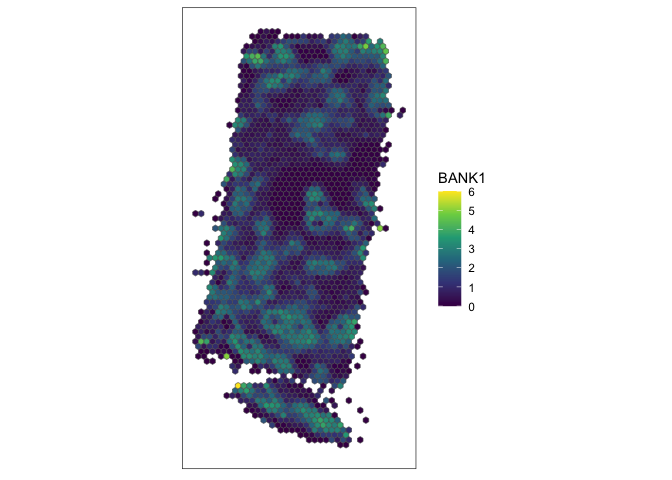
Now let’s visualize a significant spatially variable gene driven by a large percentage of cells.
head(Isub[order(Isub$minPercentCells, decreasing=TRUE),])
##        observed  expected sd p.value p.adj minPercentCells
## BANK1  0.6532180 -0.0004873294 0.01919515   0 0   0.2698490
## MS4A1  0.7164515 -0.0004873294 0.01919513   0 0   0.2698490
## IL7R   0.6567263 -0.0004873294 0.01918294   0 0   0.2489040
## CD19   0.5990818 -0.0004873294 0.01917779   0 0   0.2435460
## ADAM28 0.5391287 -0.0004873294 0.01918476   0 0   0.2372138
## MEF2C  0.5813312 -0.0004873294 0.01918426   0 0   0.2347784
# plot
g <- "BANK1"
SEraster::plotRaster(rastGexp, feature_name = g, name = g)
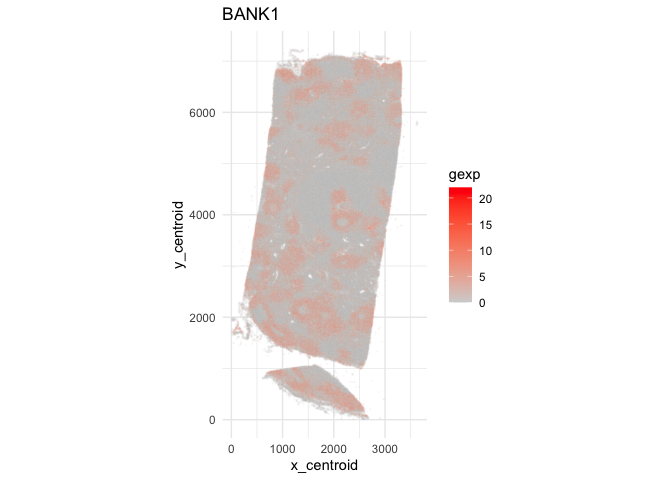
I can also visualize this gene back in single-cell resolution to visually confirm that it is indeed spatially variable at the single-cell level.
ggplot(data.frame(pos.info, gexp=counts[g,])) +
	geom_point(aes(x = x_centroid, y = y_centroid, col=gexp),
	size=0.01, alpha=0.1) +
	scale_color_gradient(low = 'lightgrey', high='red') +
	theme_minimal() + ggtitle(g) + coord_fixed()
Now let’s visualize a significant spatially variable gene driven by a small percentage of cells.
tail(Isub[order(Isub$minPercentCells, decreasing=TRUE),])
##            observed  expected sd p.valuep.adj
## MYLK       0.3648212 -0.0004873294 0.01706669 0.00000e+00 0.000000e+00
## SPI1       0.1757212 -0.0004873294 0.01881442 0.00000e+00 0.000000e+00
## BLANK_0430 0.1030032 -0.0004873294 0.01822962 6.85179e-09 1.784113e-08
## FHL2       0.5362576 -0.0004873294 0.01878494 0.00000e+00 0.000000e+00
## MEDAG      0.1899604 -0.0004873294 0.01847228 0.00000e+00 0.000000e+00
## MS4A4A     0.2325703 -0.0004873294 0.01586166 0.00000e+00 0.000000e+00
##            minPercentCells
## MYLK       0.05114467
## SPI1       0.05065757
## BLANK_0430 0.05065757
## FHL2       0.05017048
## MEDAG      0.05017048
## MS4A4A     0.05017048
# plot
g <- "MYLK"
SEraster::plotRaster(rastGexp, feature_name = g, name = g)
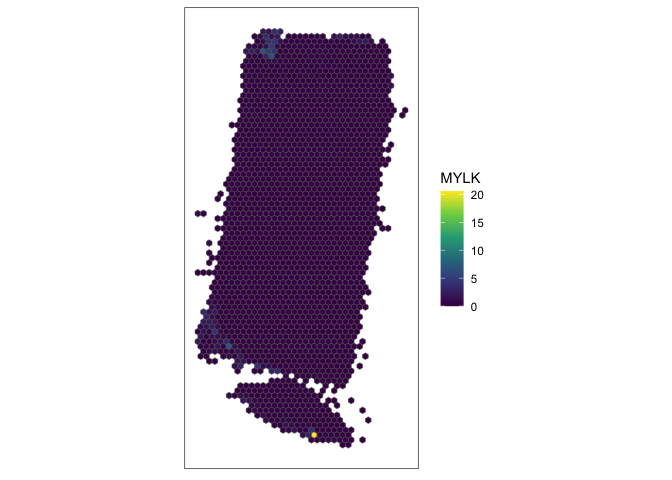
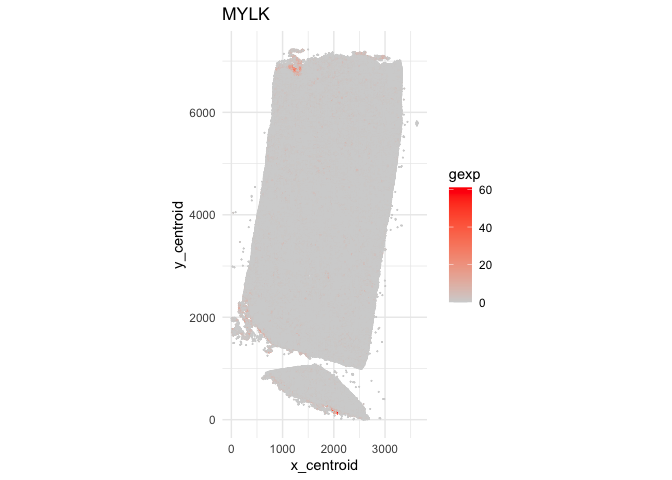
Indeed, this spatial gene expression pattern seems to be driven by a small cluster of pixels in the top left corner of the tissue. Again, I can also visualize this gene back in single-cell resolution.
ggplot(data.frame(pos.info, gexp=counts[g,])) +
	geom_point(aes(x = x_centroid, y = y_centroid, col=gexp),
	size=0.01, alpha=1) +
	scale_color_gradient(low = 'lightgrey', high='red') +
	theme_minimal() + ggtitle(g) + coord_fixed()
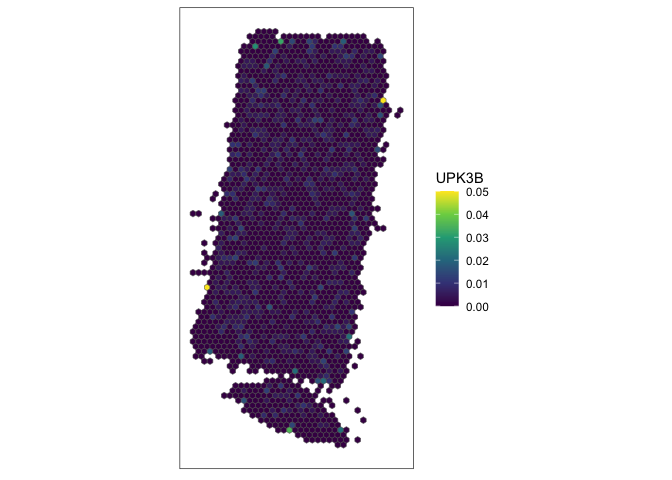
Finally, let’s look at a non-spatially variable gene.
Inonsig <- I[I$p.adj>0.05,]
head(Inonsig[order(Inonsig$observed, decreasing=TRUE),])
##        observed  expected sdp.value  p.adj
## UPK3B  0.03554548 -0.0004873294 0.01902764 0.02913183 0.05528892
## HEMGN  0.03225268 -0.0004873294 0.01742316 0.03011485 0.05695406
## CCDC78 0.03186478 -0.0004873294 0.01770929 0.03386167 0.06359387
## AHSP   0.03155898 -0.0004873294 0.01723406 0.03147991 0.05932753
## CDH16  0.03032911 -0.0004873294 0.01882861 0.05084850 0.09386075
## GATM   0.02989805 -0.0004873294 0.01668786 0.03431804 0.06422717
Indeed, at pixel resolution, this gene looks spatially quite random.
# plot
g <- "UPK3B"
SEraster::plotRaster(rastGexp, feature_name = g, name = g)
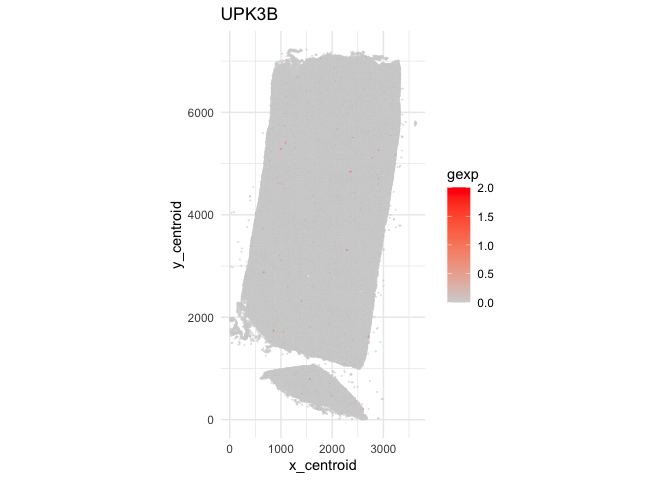
At single-cell resolution, this gene indeed looks spatially quite random but it is also quite sparsely expressed, making any pattern or lack of pattern difficult to discern.
ggplot(data.frame(pos.info, gexp=counts[g,])) +
	geom_point(aes(x = x_centroid, y = y_centroid, col=gexp),
	size=0.01, alpha=1) +
	scale_color_gradient(low = 'lightgrey', high='red') +
	theme_minimal() + ggtitle(g) + coord_fixed()
Try it out for yourself!
- Rasterize at a different resolution. Do you find similar spatially variable genes?
- Integrate the results from transcriptional clustering analysis to rasterize only cells belonging to a single cell-type to identify cell-type-specific spatially variable genes.
- Apply what you’ve learned to analyze a different 10X Xenium dataset.
- Apply what you’ve learned to analyze a different spatial transcriptomics dataset.
RECENT POSTS
- I use R to (try to) figure out which hospital I should go to for shoppable medical services by comparing costs through analyzing Hospital Price Transparency data on 22 April 2024
- Cross modality image alignment at single cell resolution with STalign on 11 April 2024
- Spatial Transcriptomics Analysis Of Xenium Lymph Node on 24 March 2024
- Querying Google Scholar with Rvest on 18 March 2024
- Alignment of Xenium and Visium spatial transcriptomics data using STalign on 27 December 2023
- Aligning 10X Visium spatial transcriptomics datasets using STalign with Reticulate in R on 05 November 2023
- Aligning single-cell spatial transcriptomics datasets simulated with non-linear disortions on 20 August 2023
- 10x Visium spatial transcriptomics data analysis with STdeconvolve in R on 29 May 2023
- Impact of normalizing spatial transcriptomics data in dimensionality reduction and clustering versus deconvolution analysis with STdeconvolve on 04 May 2023
- Aligning Spatial Transcriptomics Data With Stalign on 16 April 2023
TAGS
RELATED POSTS
- I use R to (try to) figure out which hospital I should go to for shoppable medical services by comparing costs through analyzing Hospital Price Transparency data
- Cross modality image alignment at single cell resolution with STalign
- Querying Google Scholar with Rvest
- Alignment of Xenium and Visium spatial transcriptomics data using STalign