Using CRAWDAD on pikachu dataset

Apply SEraster, STalign, or CRAWDAD to a spatial omics dataset from the class
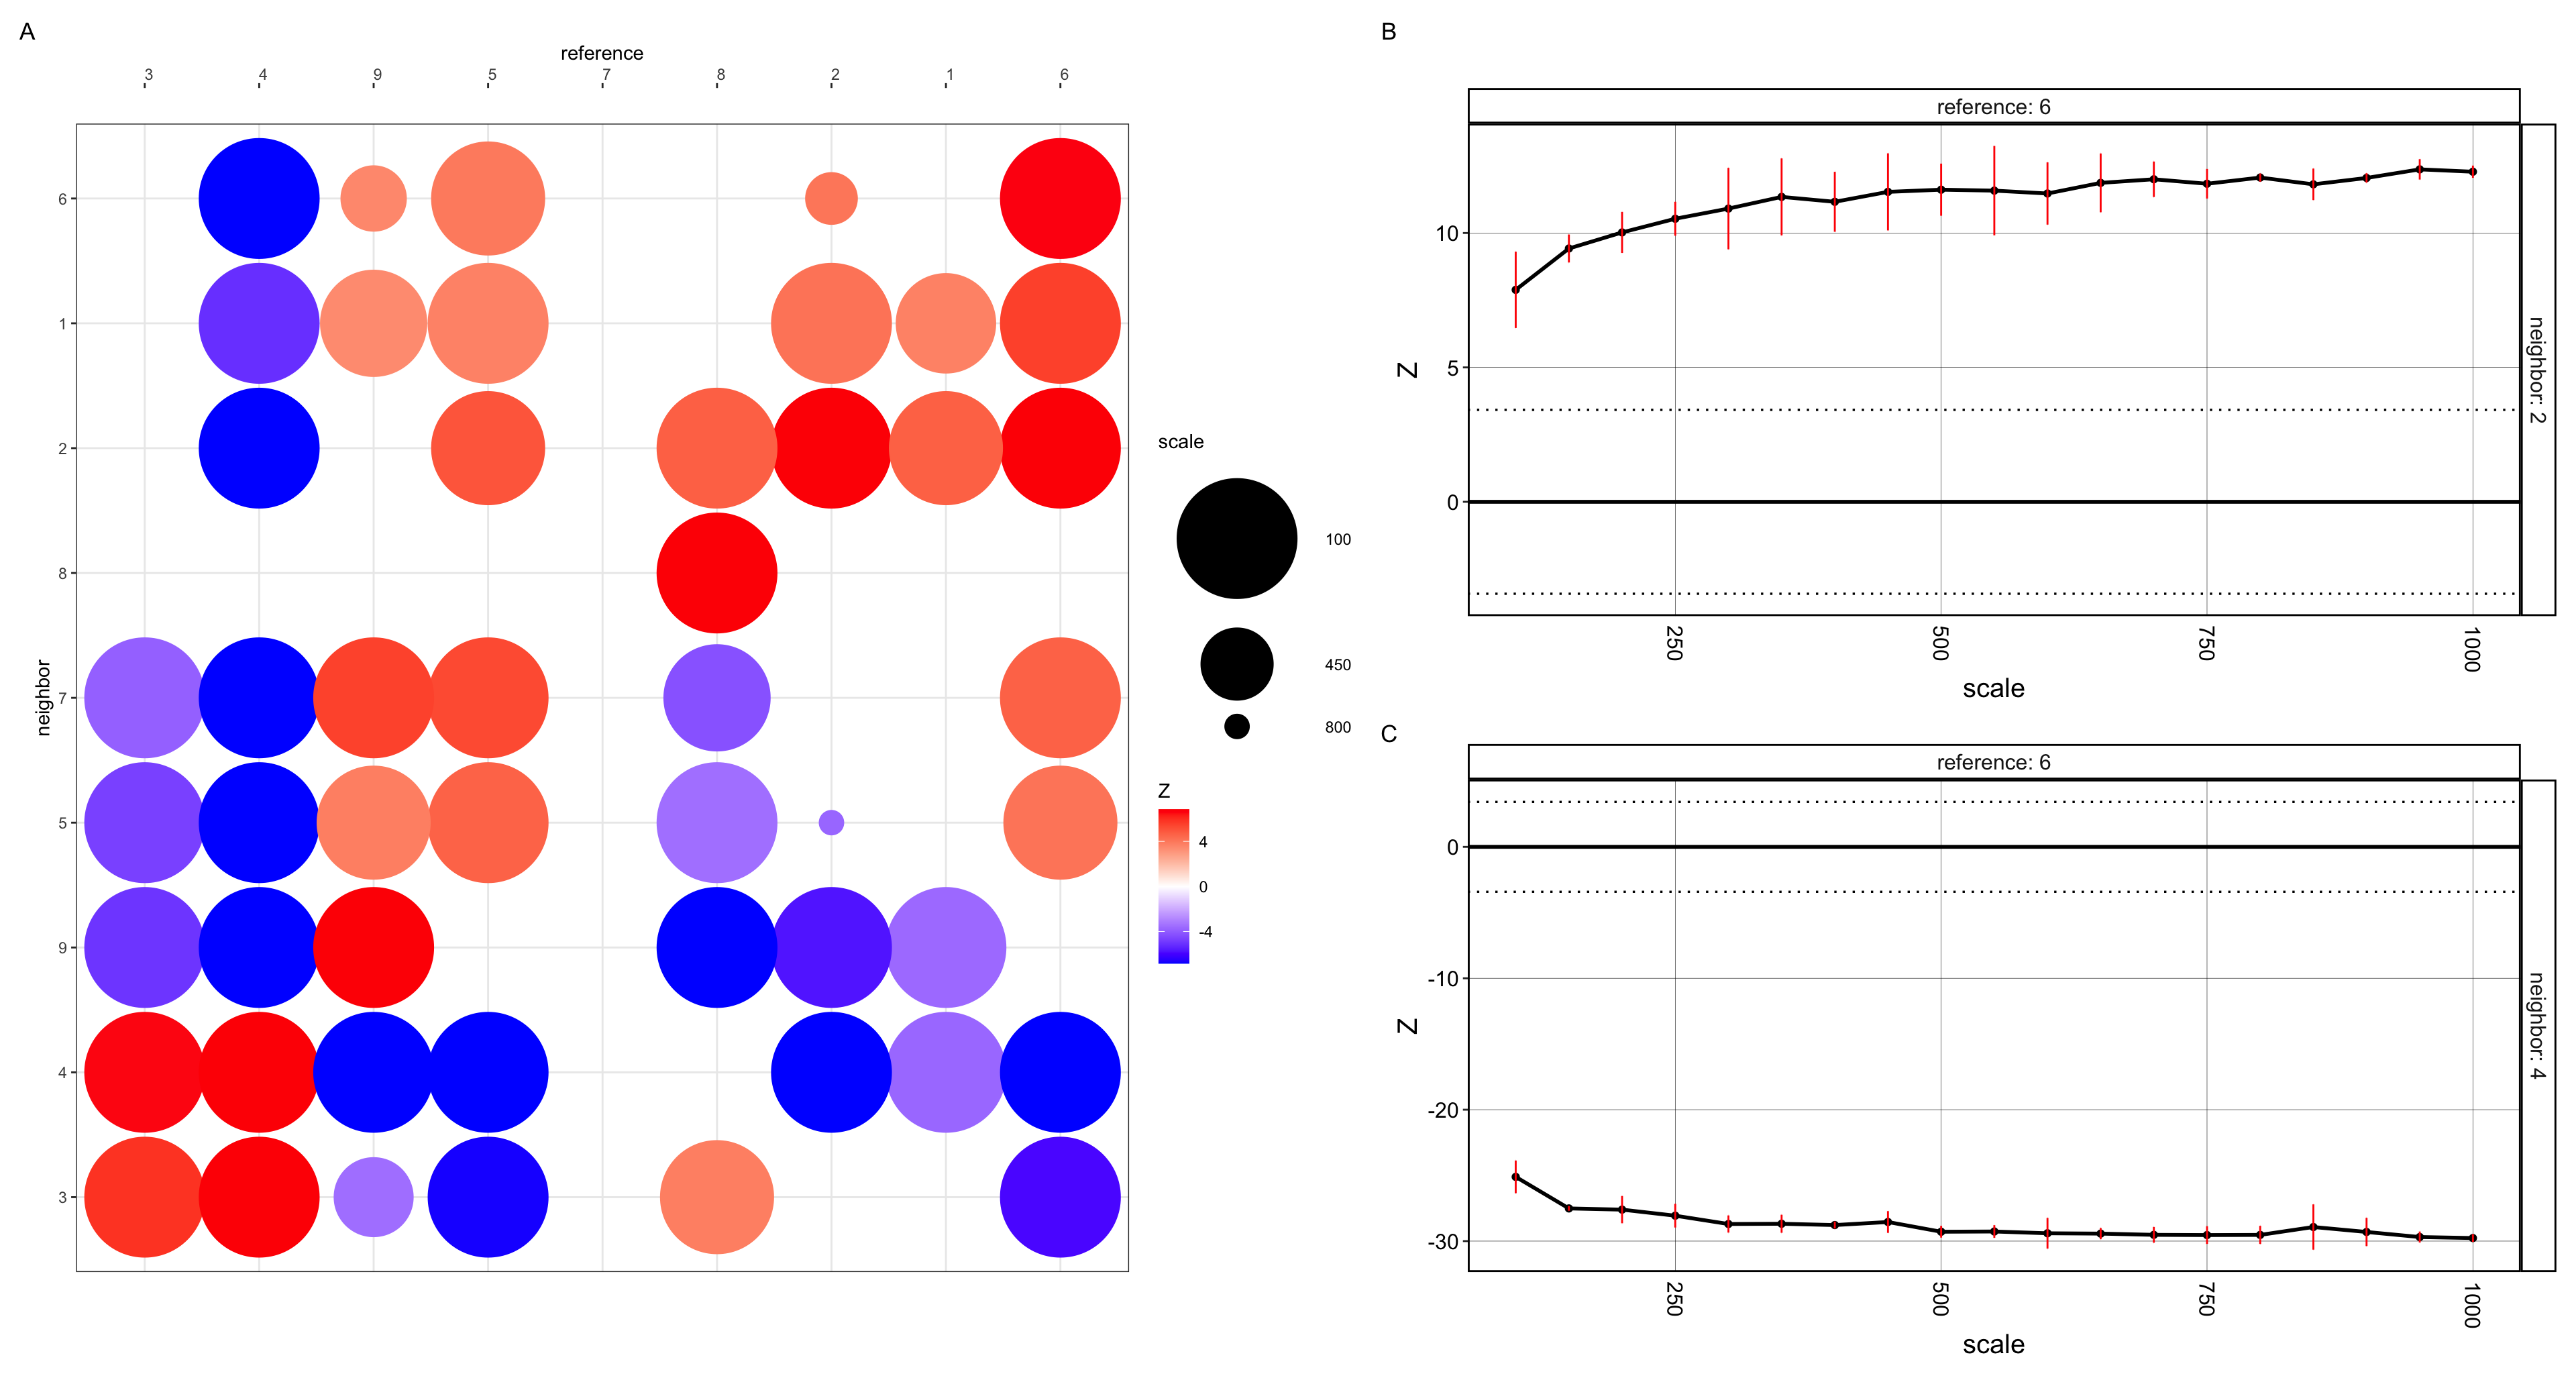
I applied CRAWDAD to the pikachu dataset. After normalizing the dataset, I performed Kmeans clustering using the optimal number of K=9, found using total withiness curve. With an assumption that each cluster served as a cell types I performed the implementation of CRAWDAD.
The plots show summary visualization of CRAWDAD’s multi-scale cell type spatial relationship analysis of the pikachu data. The size of the dot represents the scale in which a neighbor cell-type first reaches a significant spatial relationship with respect to a reference cell-type. The color of the dot is the z-score at such scale (enriched or depleted) (plot A). I also plotted the multi-scale spatial relationship trend plots for reference cell-type and neighbor cell-type. The horizontal dotted lines represent the z-score significance threshold corrected for multiple testing . If a neighbor cell type has a trend that crosses the positive z-score threshold at a certain scale, then this neighbor type is deemed to be significantly enriched at that scale given the reference cell type. If the trend crosses the negative z-score threshold, then the neighbor cell type is deemed to be significantly depleted at that scale given the reference cell type. Hence Cell type 2, given cell type 6 is deemed to be significantly enriched at all scales (plot B). Whereas cell type 4 is deemed to be significantly depleted, given the reference cell type 6 (plot C).
require(remotes)
remotes::install_github('JEFworks-Lab/CRAWDAD')

library(crawdad)
library(dplyr)
library(tidyverse)
library(patchwork)
ncores = 7
#data(sim)
#head(sim)

library(ggplot2)
data <- read.csv('/Users/nidhisoley/Desktop/GDataViz/pikachu.csv.gz', row.names=1)
# Drop first 5 columns for gene expression (cell_id, cell_area etc)
gexp = data[, -c(1:5)]
rownames(gexp) <- data$cell_id
pos <- data[, 4:5]

# normalize data by total gene expression for each cell
gexpnorm <- gexp/rowSums(gexp)
pcs <- prcomp(gexpnorm)
# test for total withinness change with k
withinnes.list = sapply(c(2:12), function(x) {
  print(x)
  tmp = kmeans(gexpnorm, centers = x)
  return(tmp$tot.withinss)} )
p0 <- ggplot(data.frame(k = c(2:12), tot.withinss = withinnes.list),
             aes(k, tot.withinss)) +
  geom_line()+theme_bw()
p0
#K-means
clusters <-as.factor(kmeans(gexpnorm, centers = 9)$cluster)
p4 <- ggplot(data.frame(pos, Cluster = clusters)) +
  geom_point(aes(x =aligned_x, y = aligned_y, col = Cluster), size=0.1, alpha=0.5) +
  theme_bw() +
  labs(title = "Clusters in Physical Space")
p4
df<-data.frame(pos,clusters)
colnames(df) <- c('x','y', 'celltypes')

## cosim## convert to sp::SpatialPointsDataFrame
cells <- crawdad:::toSF(pos = df[,c('x','y')],
                        celltypes = df$celltypes)
## generate background
shuffle.list <- crawdad::makeShuffledCells(cells,
                                           scales = seq(100, 1000, by=50),
                                           perms = 3,
                                           ncores = ncores,
                                           seed = 1,
                                           verbose = TRUE)

## find trends, passing background as parameter
results <- crawdad::findTrends(cells,
                               dist = 10,
                               shuffle.list = shuffle.list,
                               ncores = ncores,
                               verbose = TRUE,
                               returnMeans = FALSE)

## convert results to data.frame
dat <- crawdad::meltResultsList(results, withPerms = T)
## multiple-test correction
ntests <- length(unique(dat$reference)) * length(unique(dat$reference))
psig <- 0.05/ntests
zsig <- round(qnorm(psig/2, lower.tail = F), 2)
dat$neighbor <- as.character(dat$neighbor)

p1<- vizColocDotplot(dat, reorder = TRUE, zsig.thresh = zsig, zscore.limit = zsig*2) +
  theme(legend.position='right',
        axis.text.x = element_text(angle = 0, h = 0))
p1
dat_filter <- dat %>%
  filter(reference == '6') %>%
  filter(neighbor == '2')
p2<-vizTrends(dat_filter, lines = T, withPerms = T, sig.thresh = zsig)

dat_filter <- dat %>%
  filter(reference == '6') %>%
  filter(neighbor == '4')
p3<-vizTrends(dat_filter, lines = T, withPerms = T, sig.thresh = zsig)

(p1)/(p2/p3)+plot_layout(ncol = 2)+plot_annotation(tag_levels = 'A')