Impact of Principal Component Selection on t-SNE Coordinates

1. What about the data would you like to make salient?
This data visualization is designed to make salient how cell–cell relationships in a spatial transcriptomics dataset change as the number of principal components (PCs) used as input to t-SNE is increased or decreased. In particular, the visualization highlights how preserving different amounts of variance from the original high-dimensional gene expression space affects the low-dimensional embedding and the representation of major biological variation, as summarized by PC1. Emphasizing this relationship allows direct comparison of t-SNE embeddings under different dimensionality reduction settings and supports interpretation of when the embedding best reflects meaningful structure in the data.
The visualization represents primarily quantitative data and relational data. Quantitative data include the t-SNE embedding coordinates (tSNE1 and tSNE2) and the values of the first principal component (PC1), all of which are continuous numerical values that can be interpreted mathematically. Relational data are encoded through the relative distances between points in the t-SNE embedding, which represent similarity relationships among cells in the original high-dimensional gene expression space.
To visualize these data types, I use points as the geometric primitive, with multiple visual channels to encode different attributes. The two spatial position channels (x and y) encode the t-SNE coordinates (tSNE1 and tSNE2). Color hue encode PC1 values using a continuous diverging color scale, which emphasizes differences between low and high PC1 values. Point size is kept small and opacity (alpha) is reduced to mitigate overplotting given the large number of cells, allowing dense regions to remain visible without obscuring overall structure.
Several Gestalt principles are used to enhance salience. The principle of proximity allows cells that are close together in the t-SNE space to be perceived as related, reinforcing the interpretation of local similarity. The principle of similarity is applied through color encoding: cells with similar PC1 values share similar colors and are thus perceived as belonging to related regions of the embedding. In addition, the principle of continuity supports interpretation of PC1 as a smooth biological gradient, as gradual color transitions across the embedding guide the viewer’s eye along continuous trajectories rather than discrete jumps.
2. How do tSNE coordinates change as you increase or decrease the number of PCs?
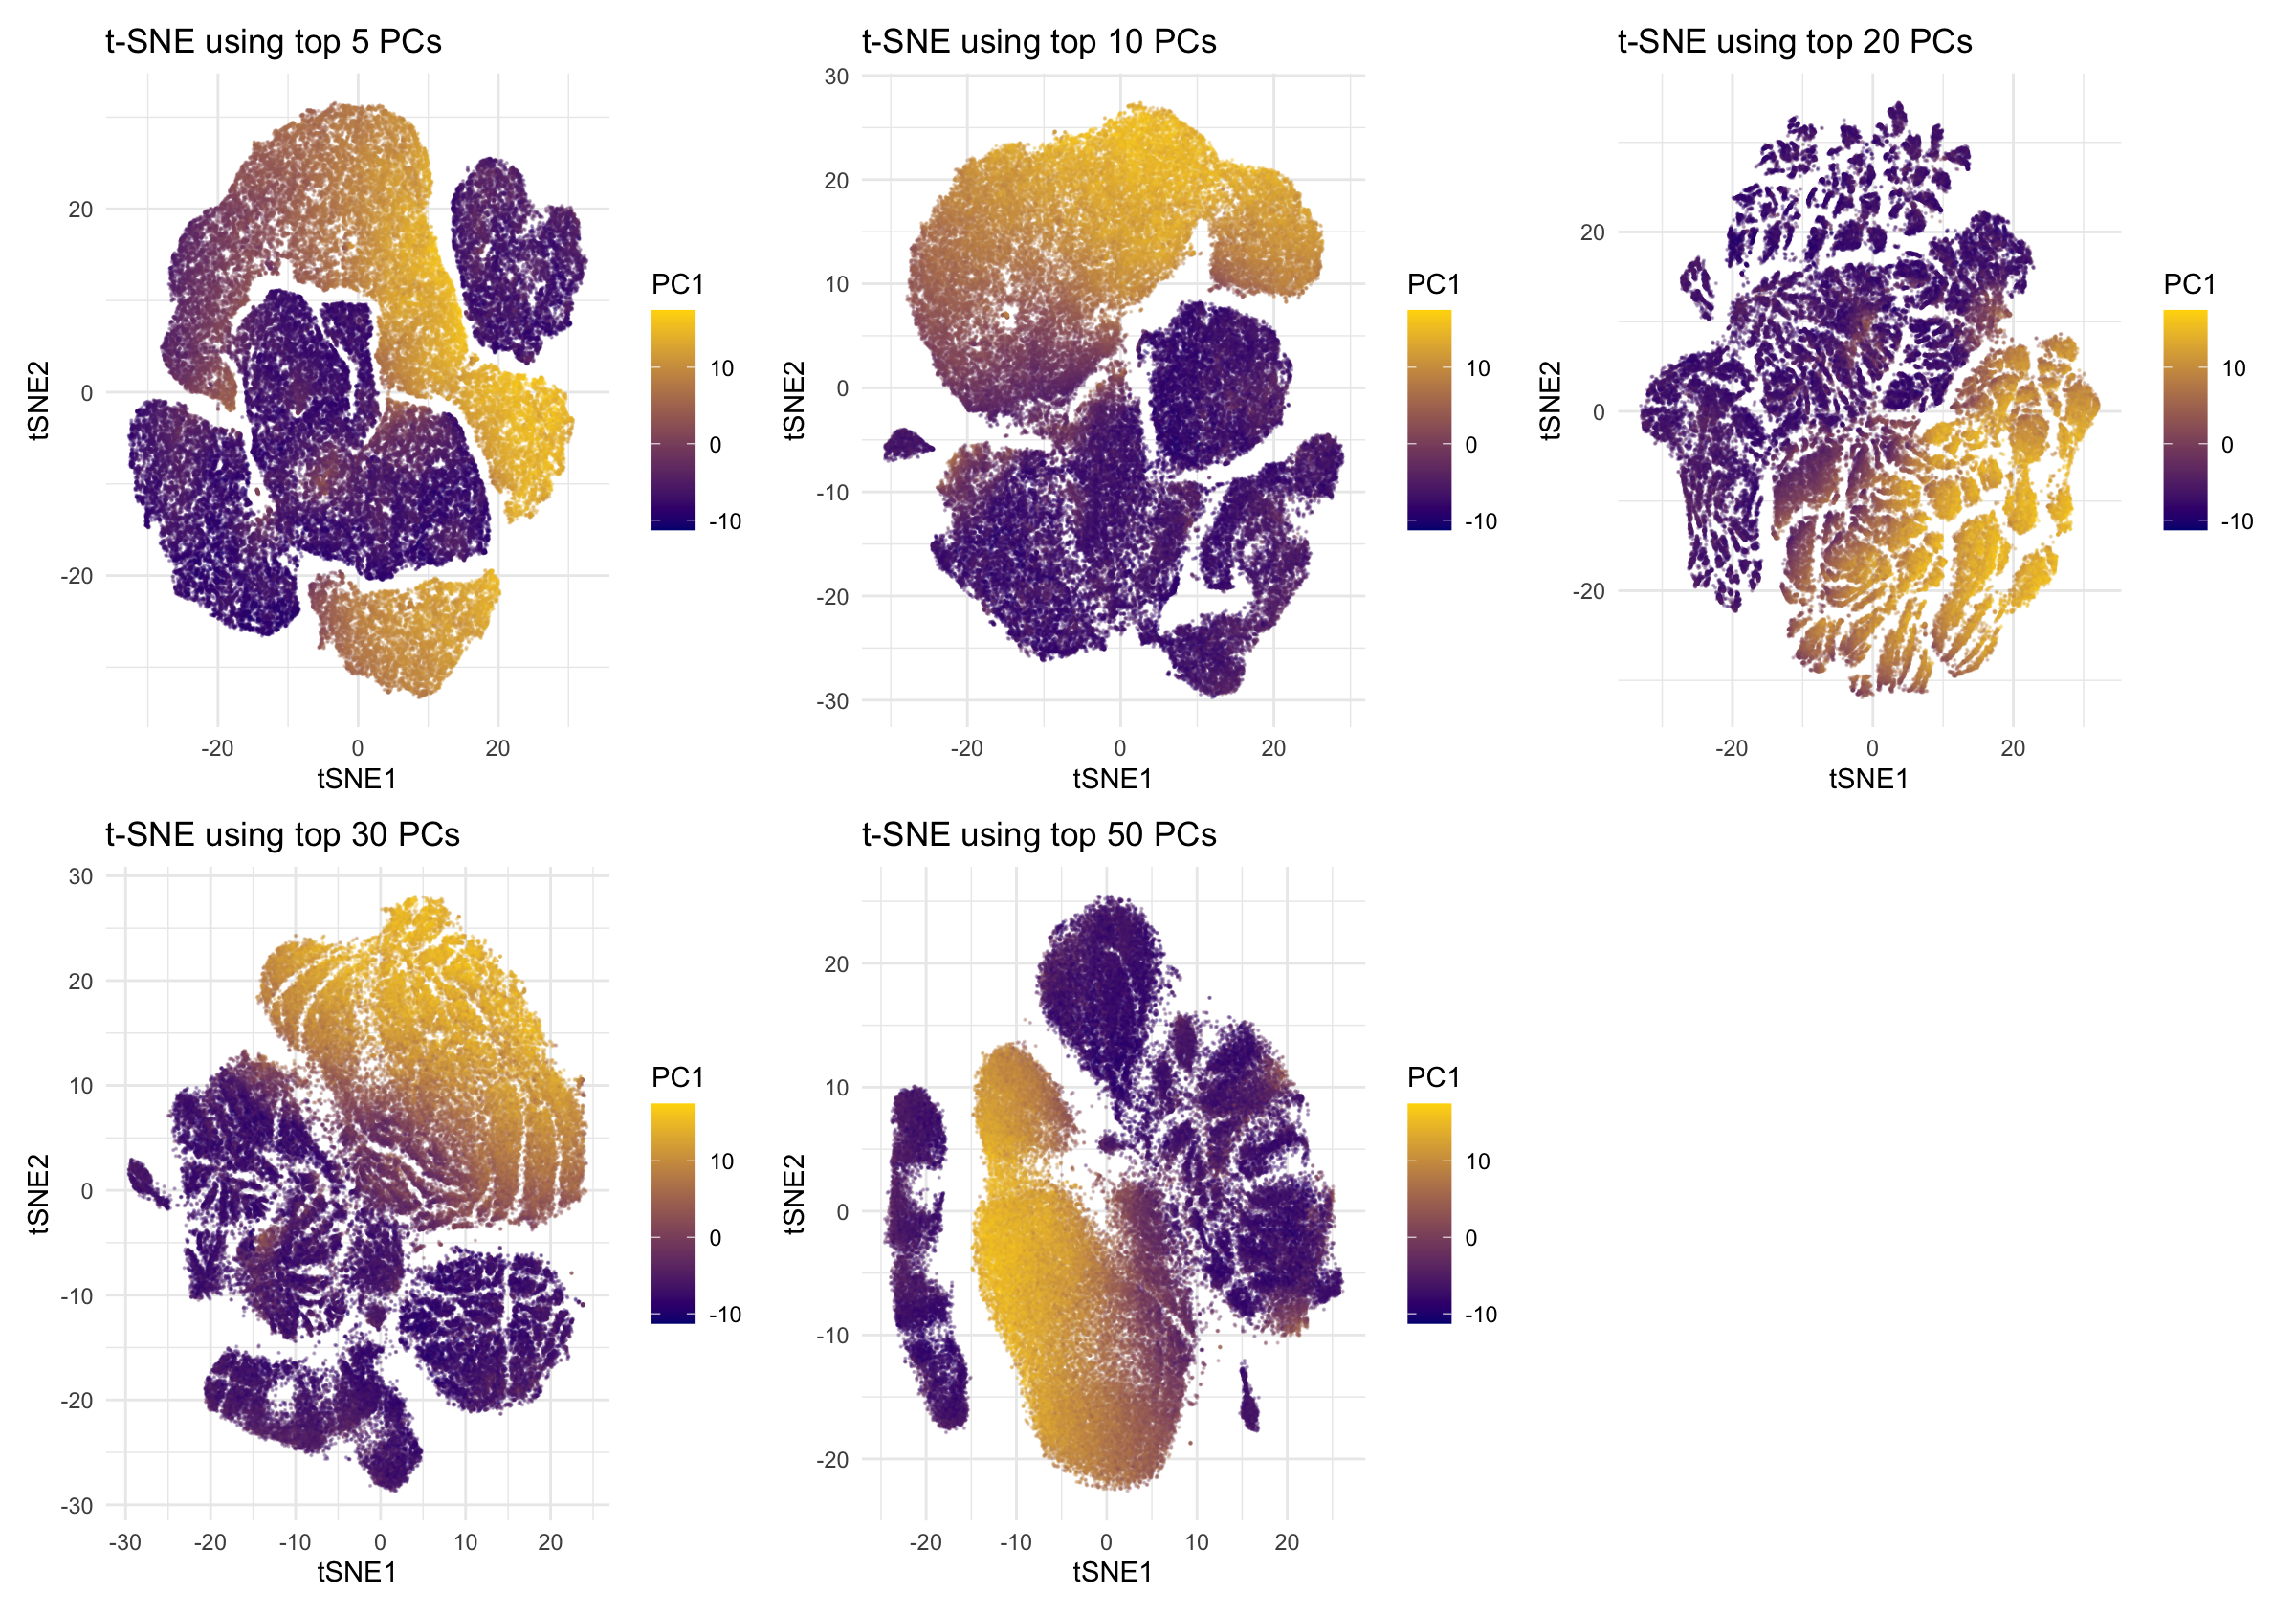
When only 5 PCs are used, the t-SNE embedding appears highly compressed. Large groups of cells are placed close together, and cells with very different PC1 values are mixed within the same regions. This suggests that the input dimensionality is insufficient to capture meaningful biological differences, causing t-SNE to underestimate dissimilarities between distinct cell states. Using 10 PCs slightly improves the embedding structure. Some separation begins to emerge, and regions with higher PC1 values start to localize together. However, substantial mixing remains, indicating that while some major variation is captured, the representation is still dominated by overly coarse information and lacks stability. With 20 PCs, the t-SNE coordinates become much more structured and interpretable. Distinct regions are clearly separated, and PC1 values form smooth and continuous gradients across the embedding. Cells with similar PC1 values are spatially close, suggesting that the neighborhood relationships in the t-SNE space are consistent with the primary axis of variation identified by PCA. When the number of PCs increases to 30, the embedding begins to change again. Structures become elongated, and some regions are stretched into thin bands. While PC1 gradients are still visible, the embedding becomes more sensitive to finer-scale variations, suggesting that additional, less dominant variance components are influencing the t-SNE layout. At 50 PCs, the t-SNE coordinates reorganize substantially. A large continuous structure emerges in which PC1 values vary smoothly along a single extended manifold, while several smaller groups remain separated. This indicates that incorporating many PCs alters the neighborhood definition, causing t-SNE to emphasize continuous variation and potentially noise, which reduces the clarity of discrete group separation.
Overall, these observations show that t-SNE embeddings are highly dependent on the number of PCs used as input. Too few PCs lead to overly compressed and mixed embeddings, while too many PCs introduce additional variance that can reorganize the embedding and reduce interpretability. An intermediate number of PCs, around 20 in this case, produces the most stable and meaningful t-SNE coordinates by preserving major biological variation without being dominated by noise.
3. Code (paste your code in between the ``` symbols)
1
2
3
4
5
6
7
8
9
10
11
12
13
14
15
16
17
18
19
20
21
22
23
24
25
26
27
28
29
30
31
32
33
34
35
36
37
38
39
40
41
42
43
44
45
46
47
48
49
50
51
52
53
54
55
56
57
58
59
60
61
62
63
64
65
66
67
68
69
70
71
72
73
74
75
76
77
78
79
80
81
82
83
84
85
86
87
88
89
90
91
92
93
94
95
96
97
98
99
100
101
102
103
104
105
106
107
108
109
110
111
112
# Read in data
data <- read.csv('/Users/xl/Desktop/JHU2026Spring/Genomic-Data-Visualization/Homework/HW2/Xenium-IRI-ShamR_matrix.csv.gz')
data[1:5,1:5]
pos <- data[,c('x', 'y')]
rownames(pos) <- data[,1]
gexp <- data[, 4:ncol(data)]
rownames(gexp) <- data[,1]
head(pos)
gexp[1:5,1:5]
dim(pos)
dim(gexp)

# Normalize
totgexp <- rowSums(gexp)
head(totgexp)
head(sort(totgexp, decreasing=TRUE))
mat <- log10(gexp/totgexp * 1e6 + 1)
dim(mat)

# PCA
pcs <- prcomp(mat, center=TRUE, scale=FALSE)
names(pcs)
head(pcs$sdev)
length(pcs$sdev)
plot(pcs$sdev[1:50])

library(Rtsne)

# ------------------------------------------------------------
# Computes t-SNE embeddings for different numbers
# of PCs and saves the results to disk.
# ------------------------------------------------------------

# List of PC counts to evaluate
pc_list <- c(5, 10, 20, 30, 50)

# Fixed t-SNE parameter
perplexity <- 30

# Initialize a list to store t-SNE results
tsne_results <- list()

for (n_pcs in pc_list) {

  message("Running t-SNE with ", n_pcs, " PCs...")

  # Select top n_pcs principal components
  toppcs <- pcs$x[, 1:n_pcs]

  # Run t-SNE
  tsne <- Rtsne(
    toppcs,
    dims = 2,
    perplexity = perplexity,
    verbose = FALSE
  )

  # Extract embedding coordinates
  emb <- tsne$Y
  colnames(emb) <- c("tSNE1", "tSNE2")
  rownames(emb) <- rownames(pcs$x)

  # Store result using PC count as key
  tsne_results[[paste0("PC", n_pcs)]] <- emb
}

# Save all t-SNE embeddings to disk
saveRDS(tsne_results, file = "tsne_embeddings_by_pc.rds")

library(ggplot2)
library(patchwork)

# ------------------------------------------------------------
# Loads precomputed t-SNE embeddings and generates
# visualization panels. Plotting parameters can be modified
# without re-running t-SNE.
# ------------------------------------------------------------

# Load saved t-SNE embeddings
tsne_results <- readRDS("tsne_embeddings_by_pc.rds")

# PC counts to visualize
pc_list <- c(5, 10, 20, 30, 50)

# Initialize list for plots
plots <- list()

for (n_pcs in pc_list) {

  # Retrieve embedding for current PC count
  emb <- tsne_results[[paste0("PC", n_pcs)]]

  # Create plotting data frame
  df_plot <- data.frame(
    emb,
    PC1 = pcs$x[, 1]
  )

  # Generate t-SNE scatter plot
  p <- ggplot(df_plot, aes(x = tSNE1, y = tSNE2, color = PC1)) +
    geom_point(size = 0.1, alpha = 0.3) +
    scale_color_gradient(
      low = "navy",
      high = "gold"
    ) +
    theme_minimal() +
    ggtitle(paste("t-SNE using top", n_pcs, "PCs"))

  plots[[paste0("PC", n_pcs)]] <- p
}
# Arrange all plots into a multi-panel figure
wrap_plots(plots, ncol = 3)