Relationship between ERBB2 Expression and Cell Area

What data types are you visualizing?
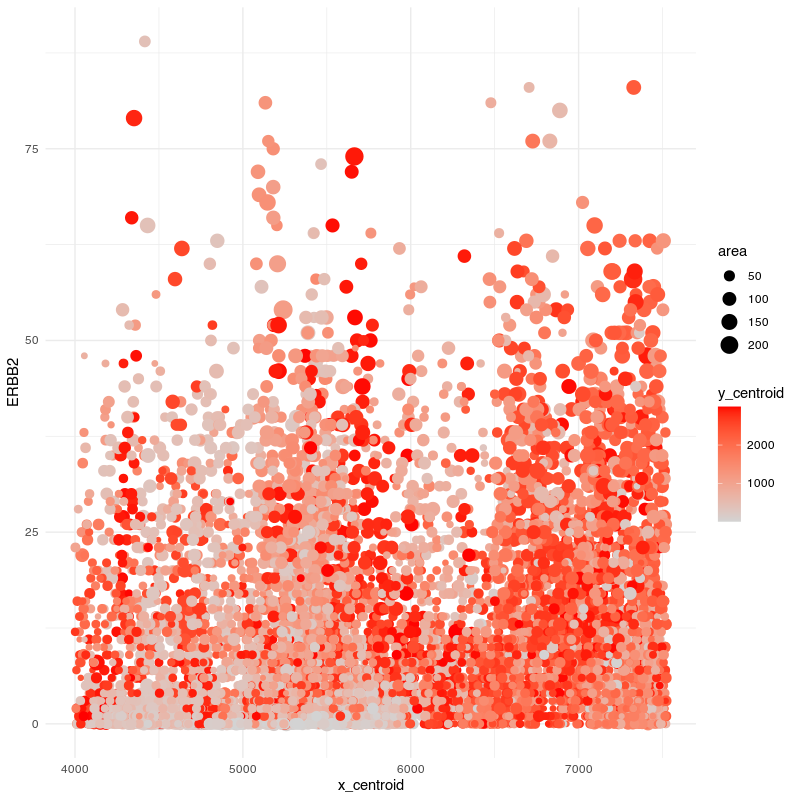
I am visualizing quantitative data of the expression count of the ERBB2 gene for each cell, quantitative data of the area for each cell, and spatial data regarding the x,y centroid positions for each cell.
What data encodings are you using to visualize these data types?
I am using the geometric primitive of points to represent each cell. To encode expression count of the ERBB2 gene, I am using the visual channel of position along the y axis. To encode the area for each cell, I am using the visual channel of size. To encode the spatial x position, I am using the visual channel of position along the x axis. To encode the spatial y position, I am using the visual channel of saturation going from an unsaturated lightgrey to a saturated red.
What type of data visualization is this? What about the data are you trying to make salient through this data visualization? What Gestalt principles have you applied towards achieving this goal if any?
My explanatory data visualization seeks to make more salient the relationship between ERBB2 expression and the cell area.
Please share the code you used to reproduce this data visualization.
file <- '~/Desktop/genomic-data-visualization-2023/data/charmander.csv.gz'
data <- read.csv(file, row.names=1)

library(ggplot2)
ggplot(data, aes(x=x_centroid, y=ERBB2, col=y_centroid, size=area)) +
  scale_colour_gradient(low = 'lightgrey', high='red') +
  geom_point() +
  theme_minimal()
(do you think my data visualization is effective? why or why not?)