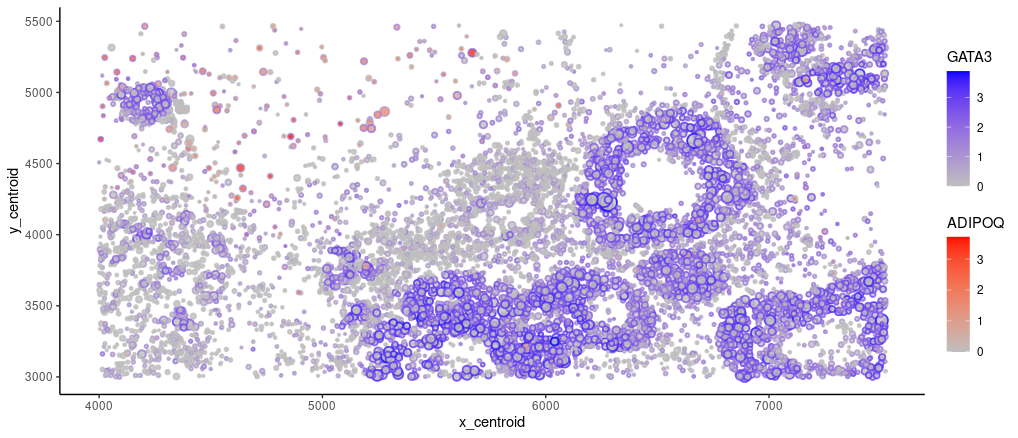
What data types are you visualizing? I am visualizing quantitative data of the expression of GATA3 (gene of interest) and ADIPOQ (the most highly variable) gene for cells with at...
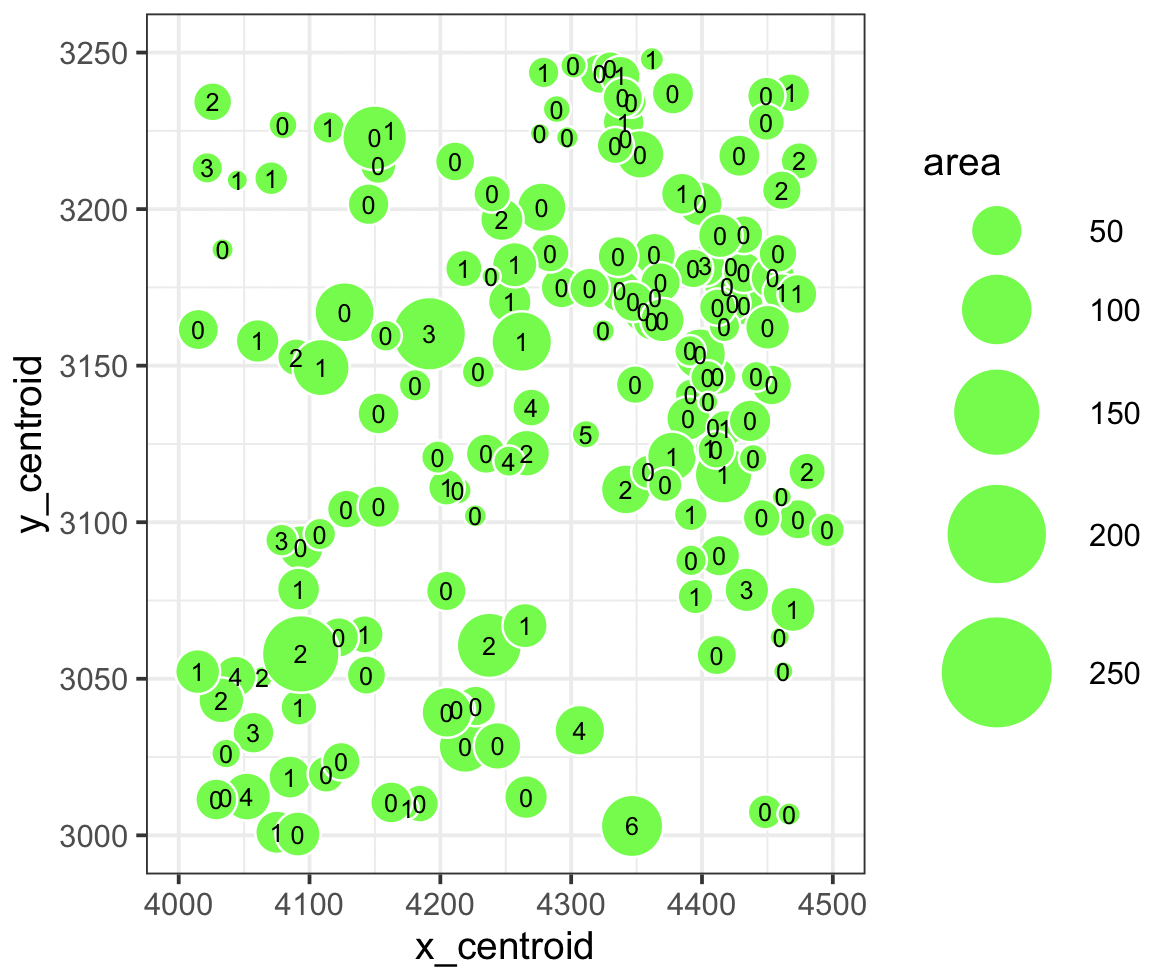
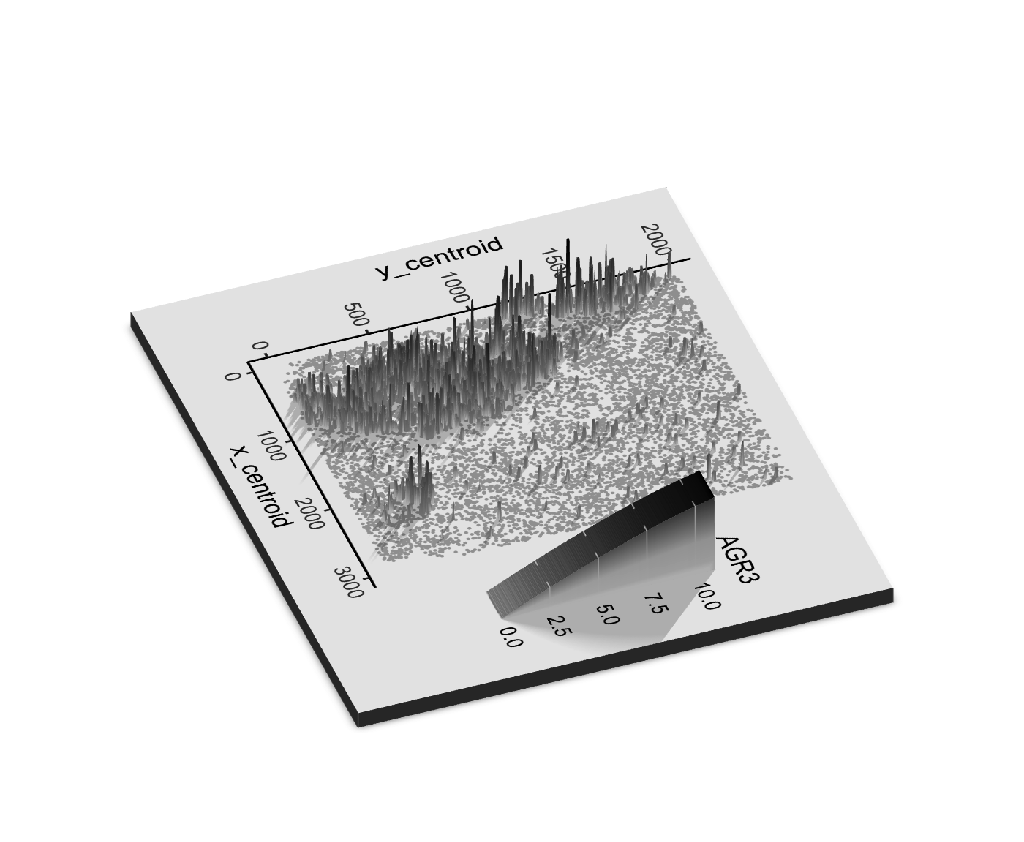
What data types are you visualizing? It’s visualizing a quantitative data type of how many ZEB1 genes are found in a specific area given the x_centroid (4000-4500) and y_centroid (3000-3250)....
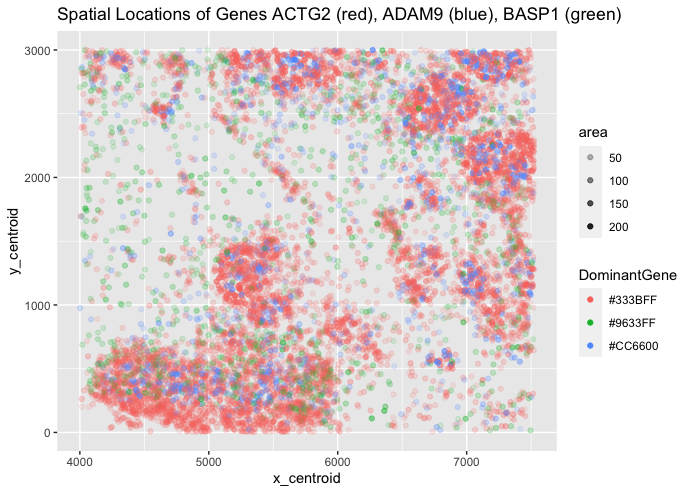
What data types are you visualizing? My categorical data is the gene with the highest expression dictating the color, my spatial data is the x and y centroids depicting the...
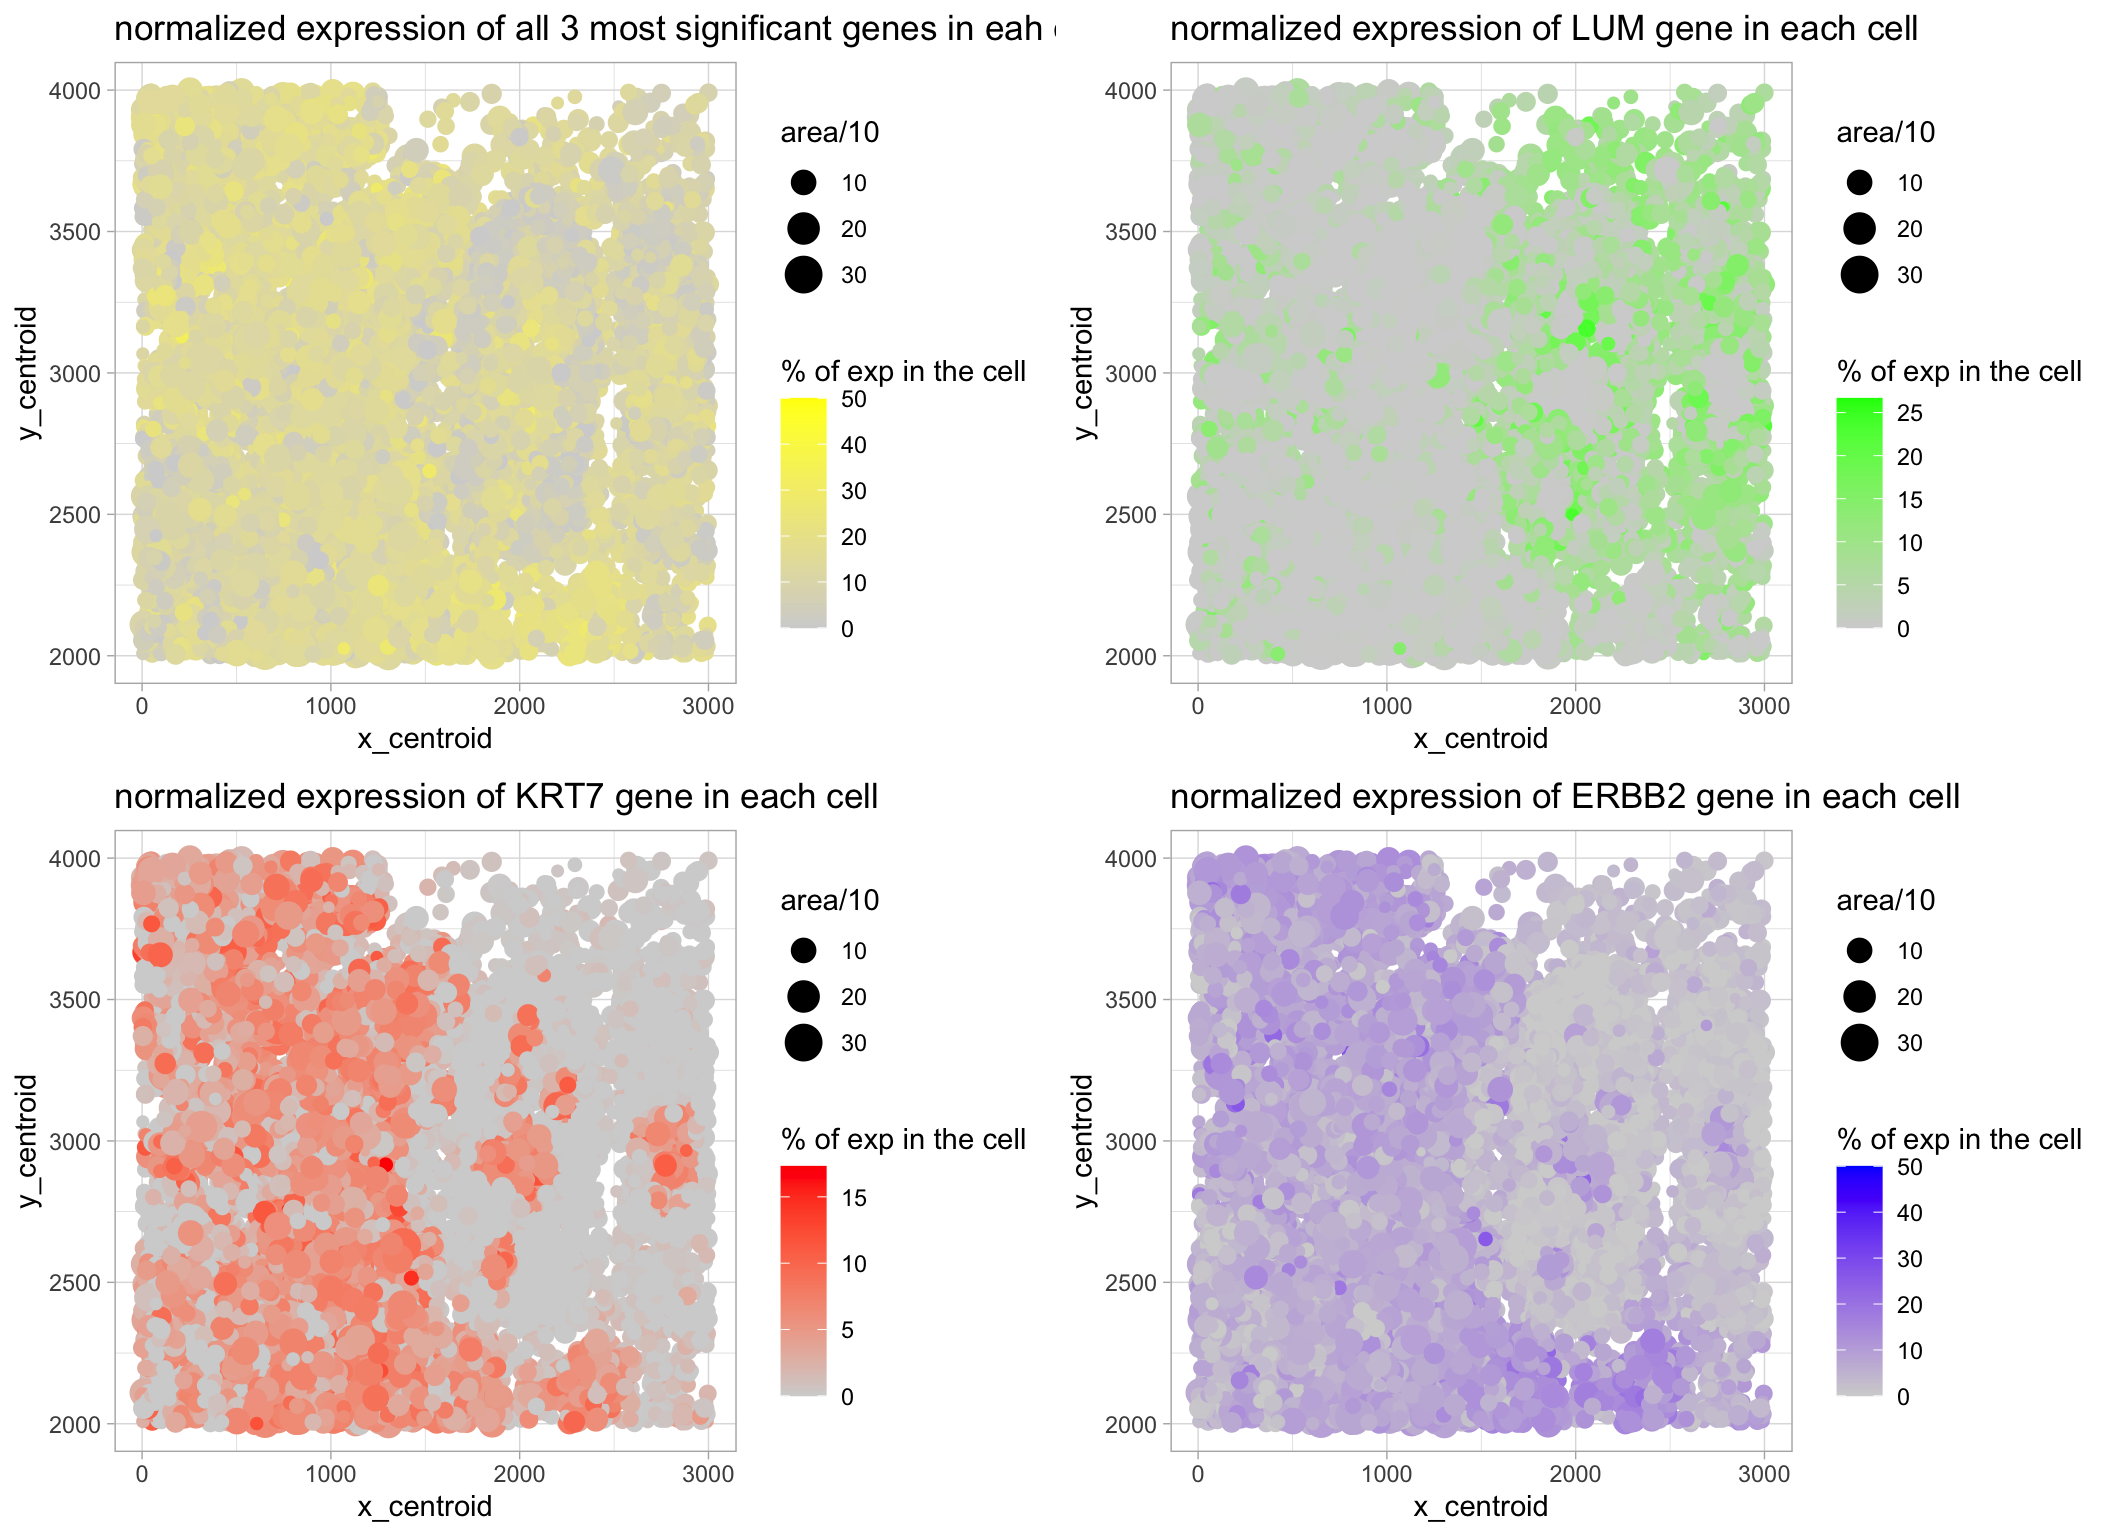
What data types are you visualizing? I am visualizing quantitative data of the expression level of the three most significantly expressed genes across all cells for each cell, quantitative data...
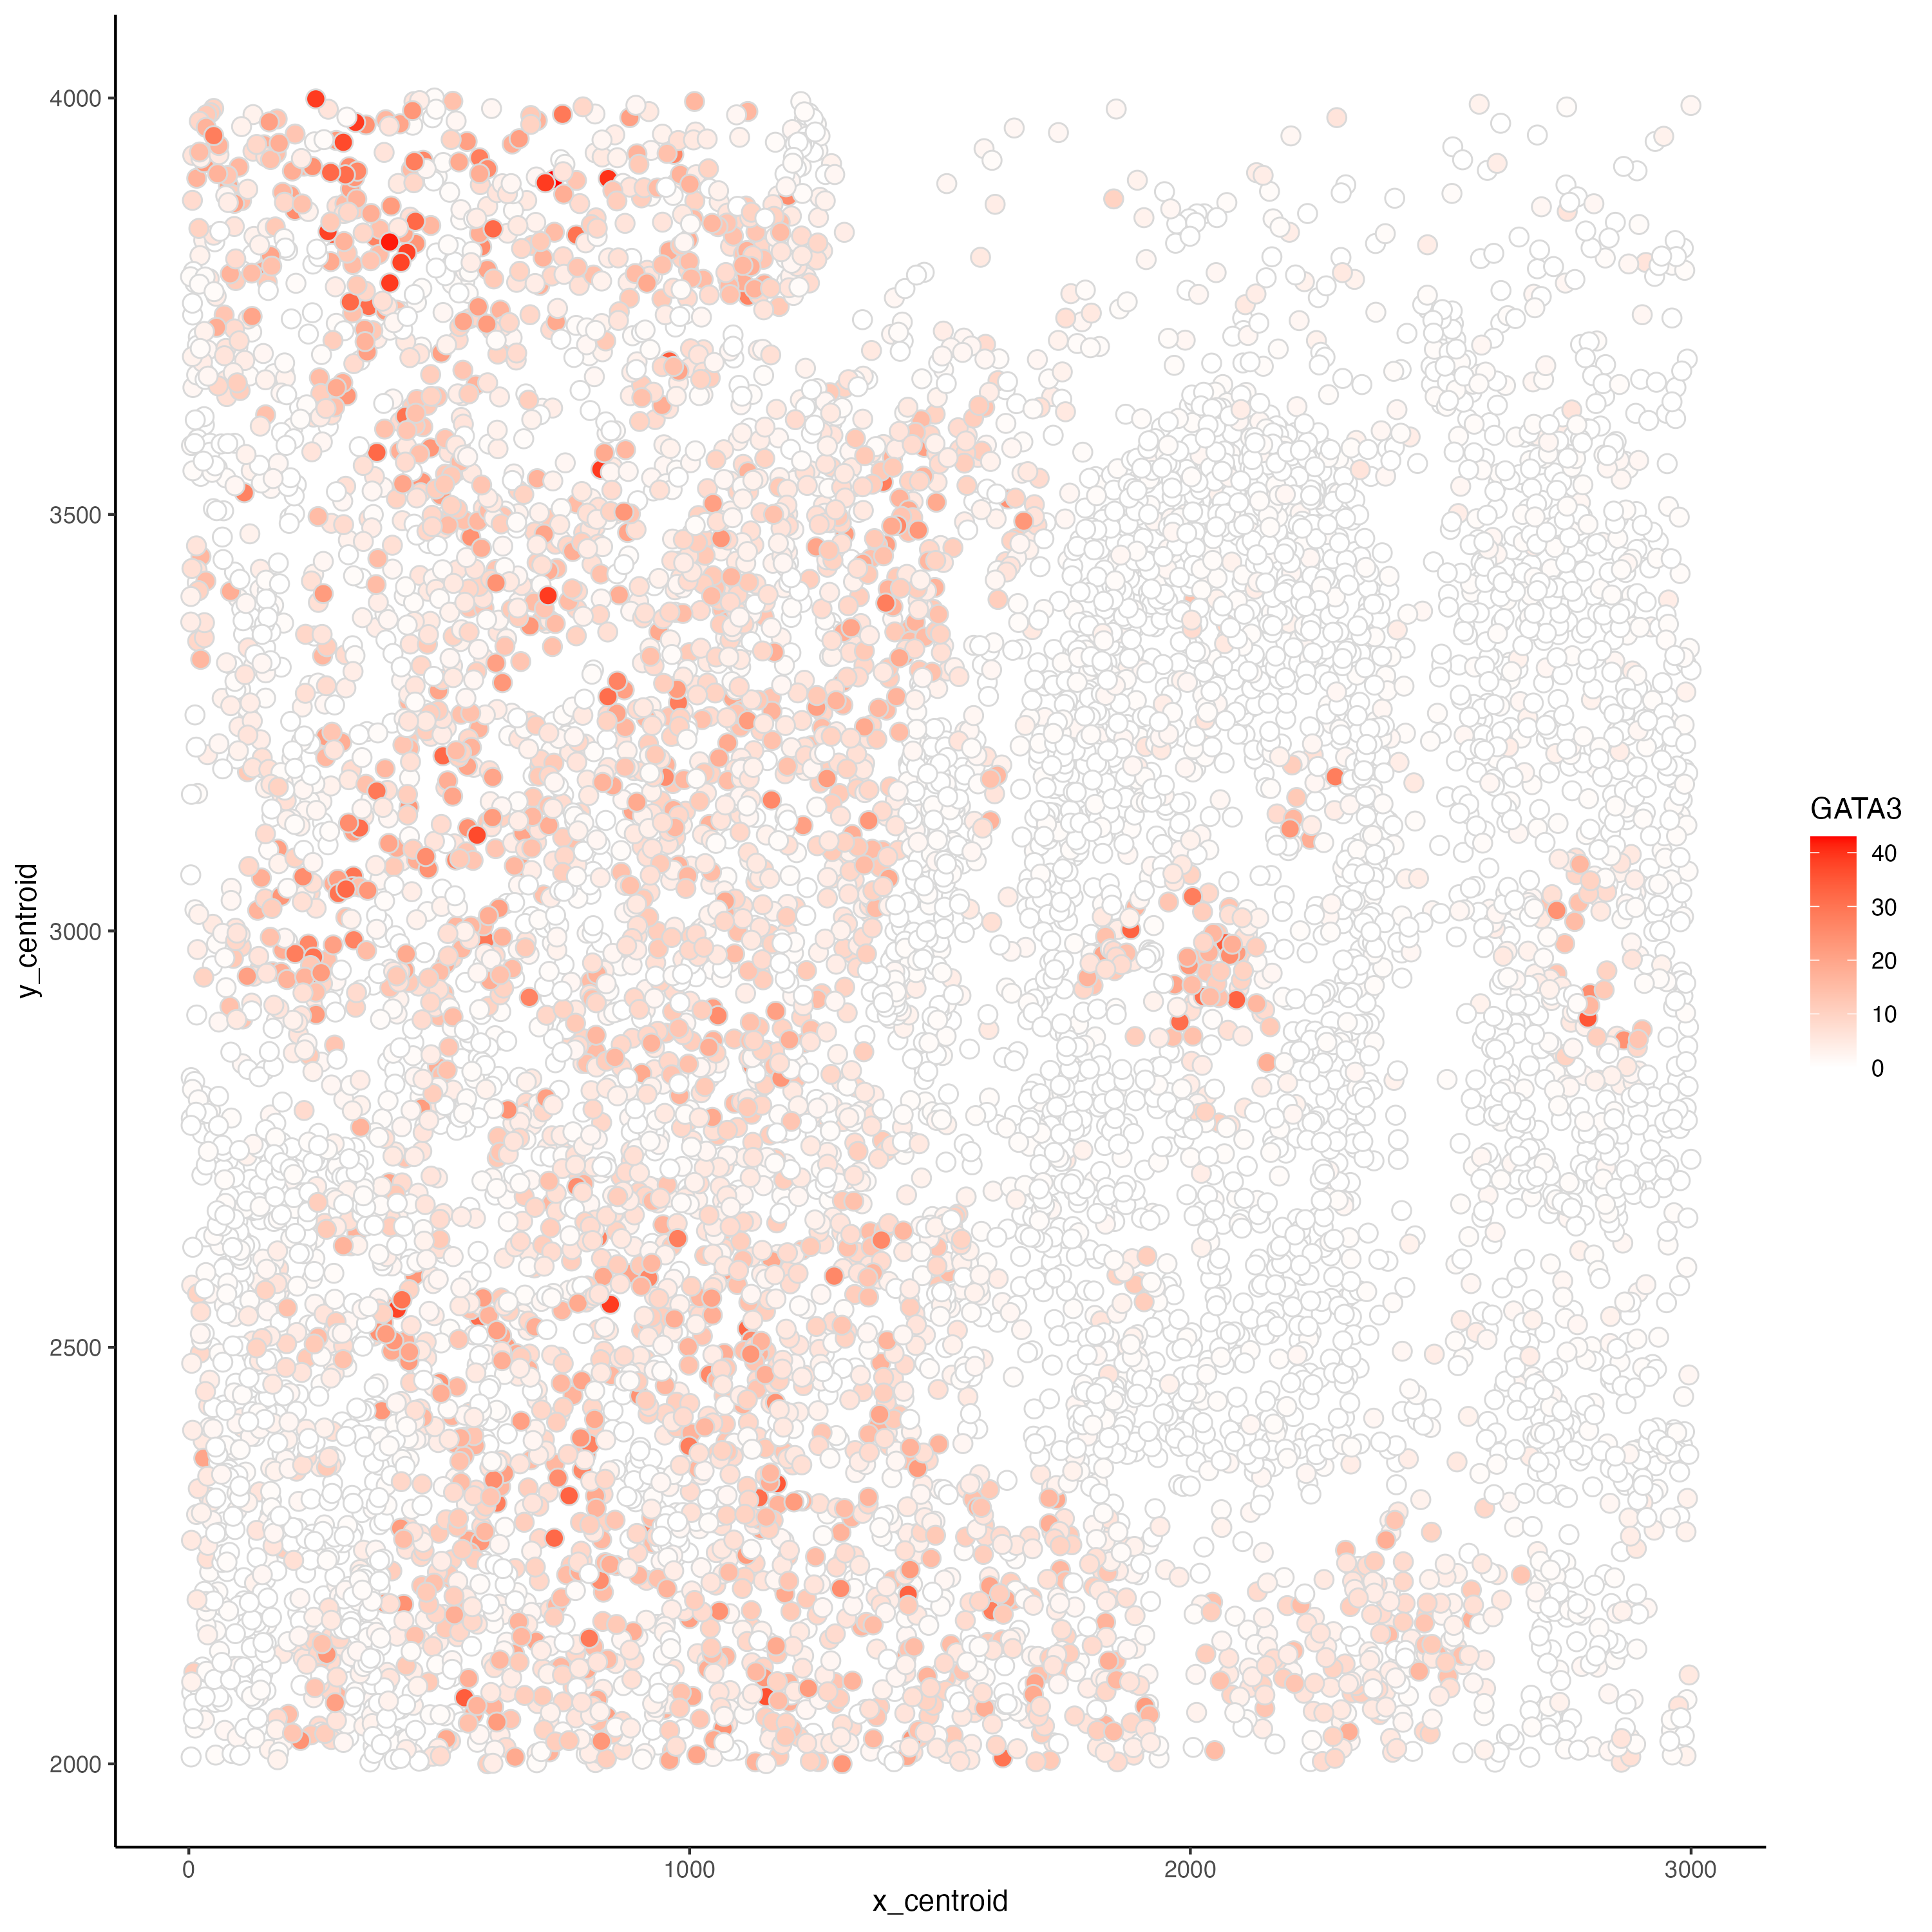
What data types are you visualizing? In this plot, I am visualizing quantitative data of each cell’s expression count of the GATA3 gene and quantitative data of each cell’s spatial...
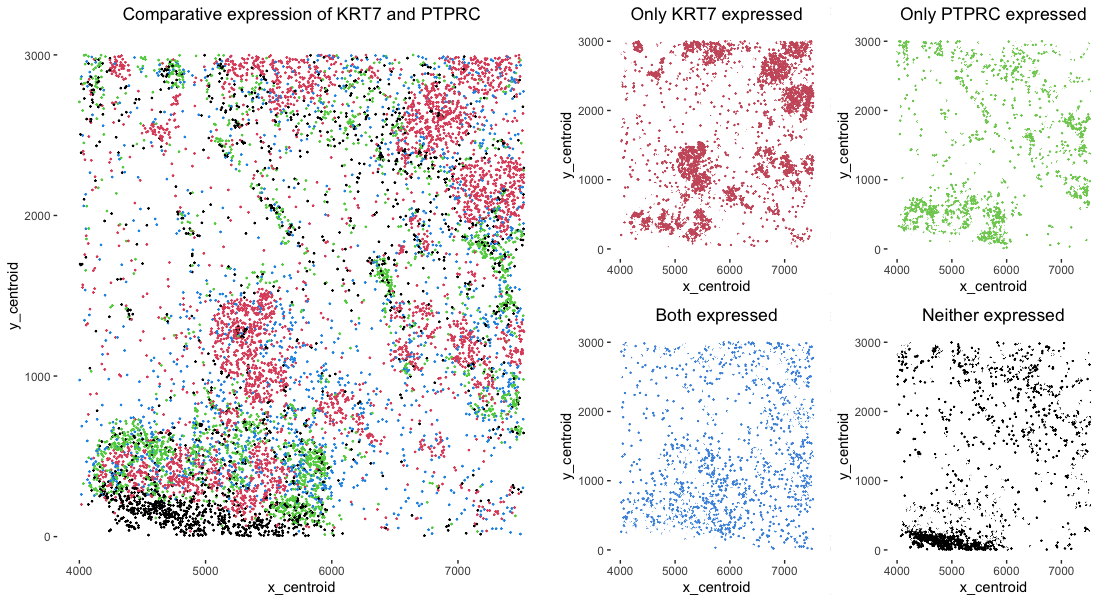
What data types are you visualizing? I am visualizing categorical data of the comparative gene expression detection of two genes KRT7 and PTPRC. There are four possible categories: only KRT7...
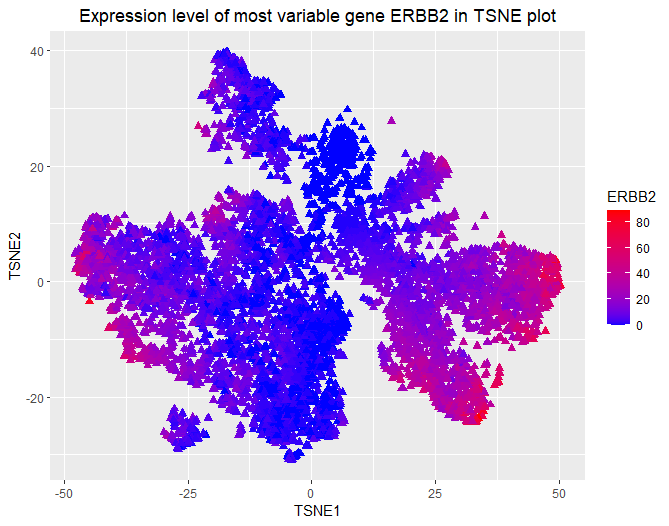
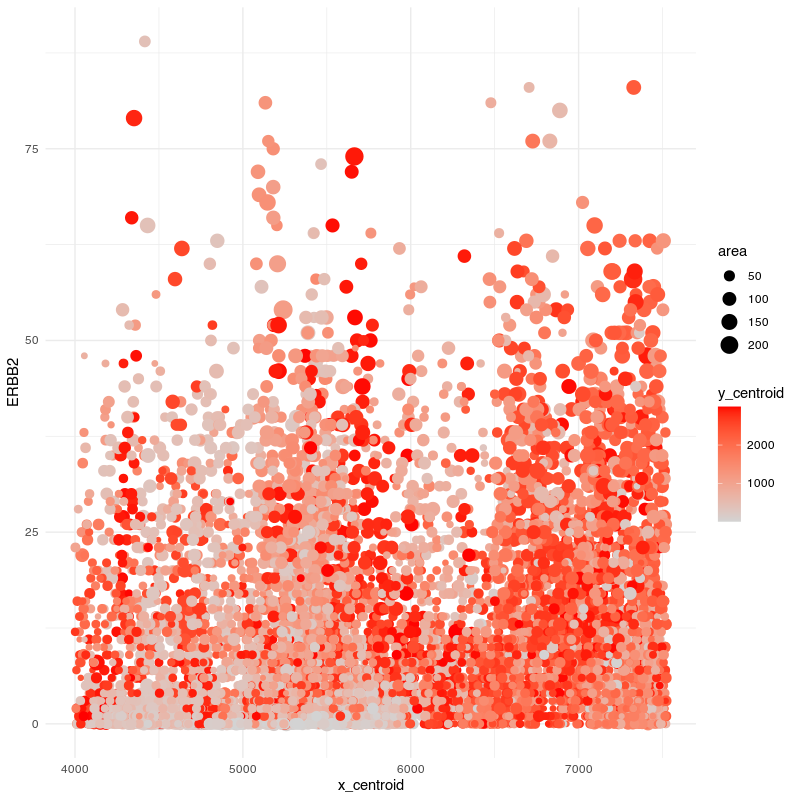
What data types are you visualizing? I am visualizing quantitative data of the expression count of the most variable gene ERBB2 for each cell, and spatial data regarding the x,y...
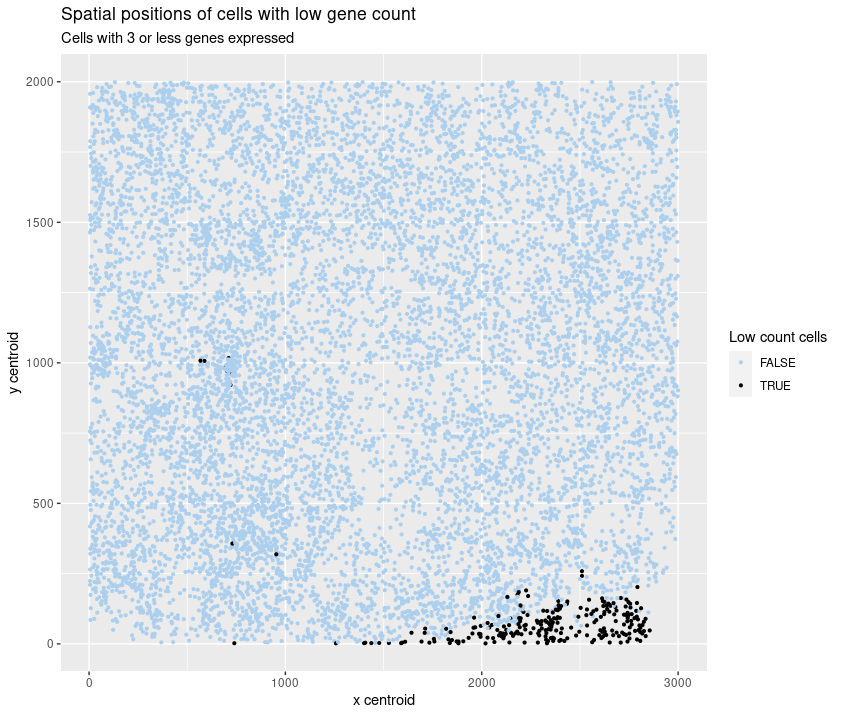
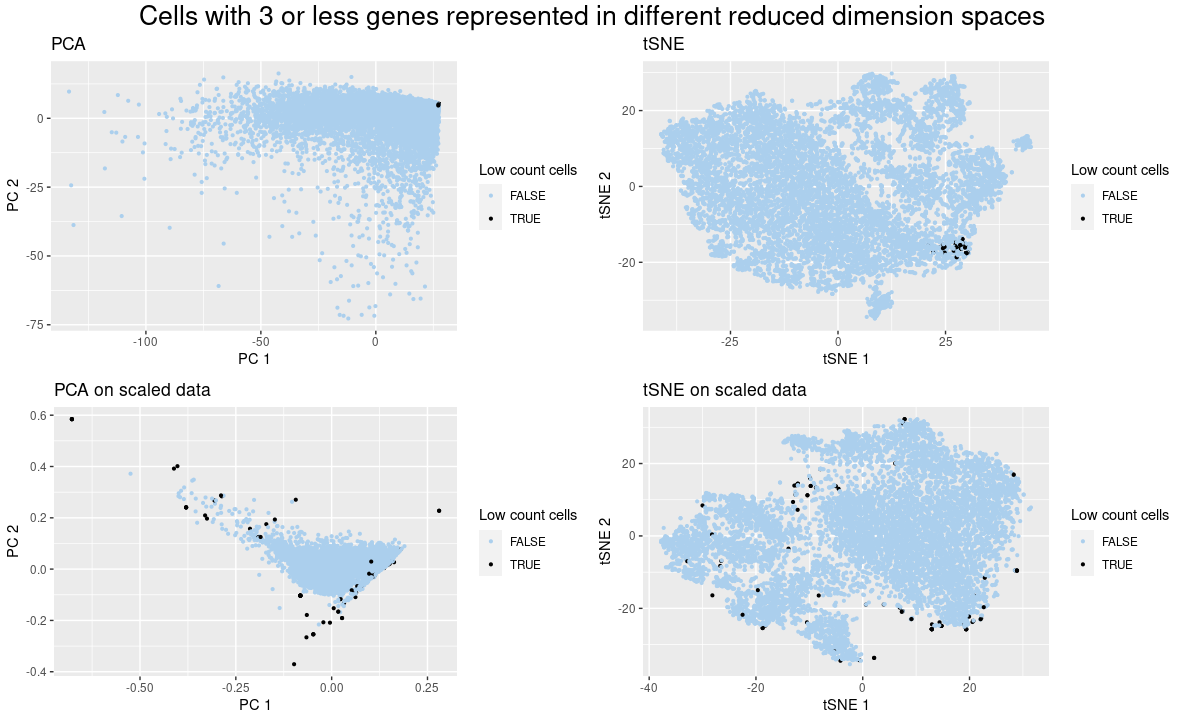
What data types are you visualizing? I am visualizing the categorical data of the presence of 3 or fewer genes in a cell together with the spatial data of the...
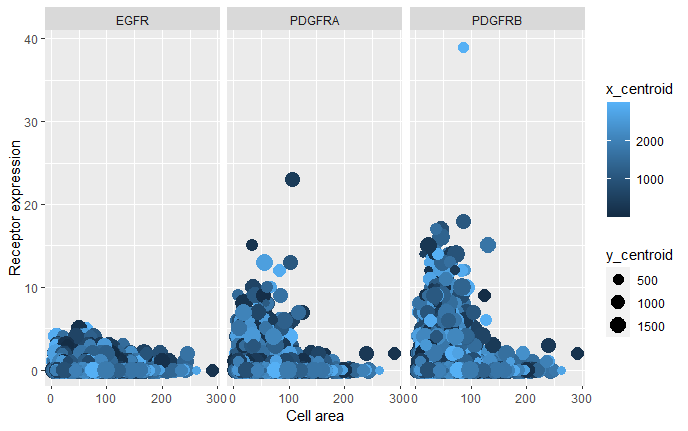
What data types are you visualizing? I am visualizing quantitative data of the expression count of the EGFR, PDGFRA and PDGFRB genes for each cell, quantitative data of the area...
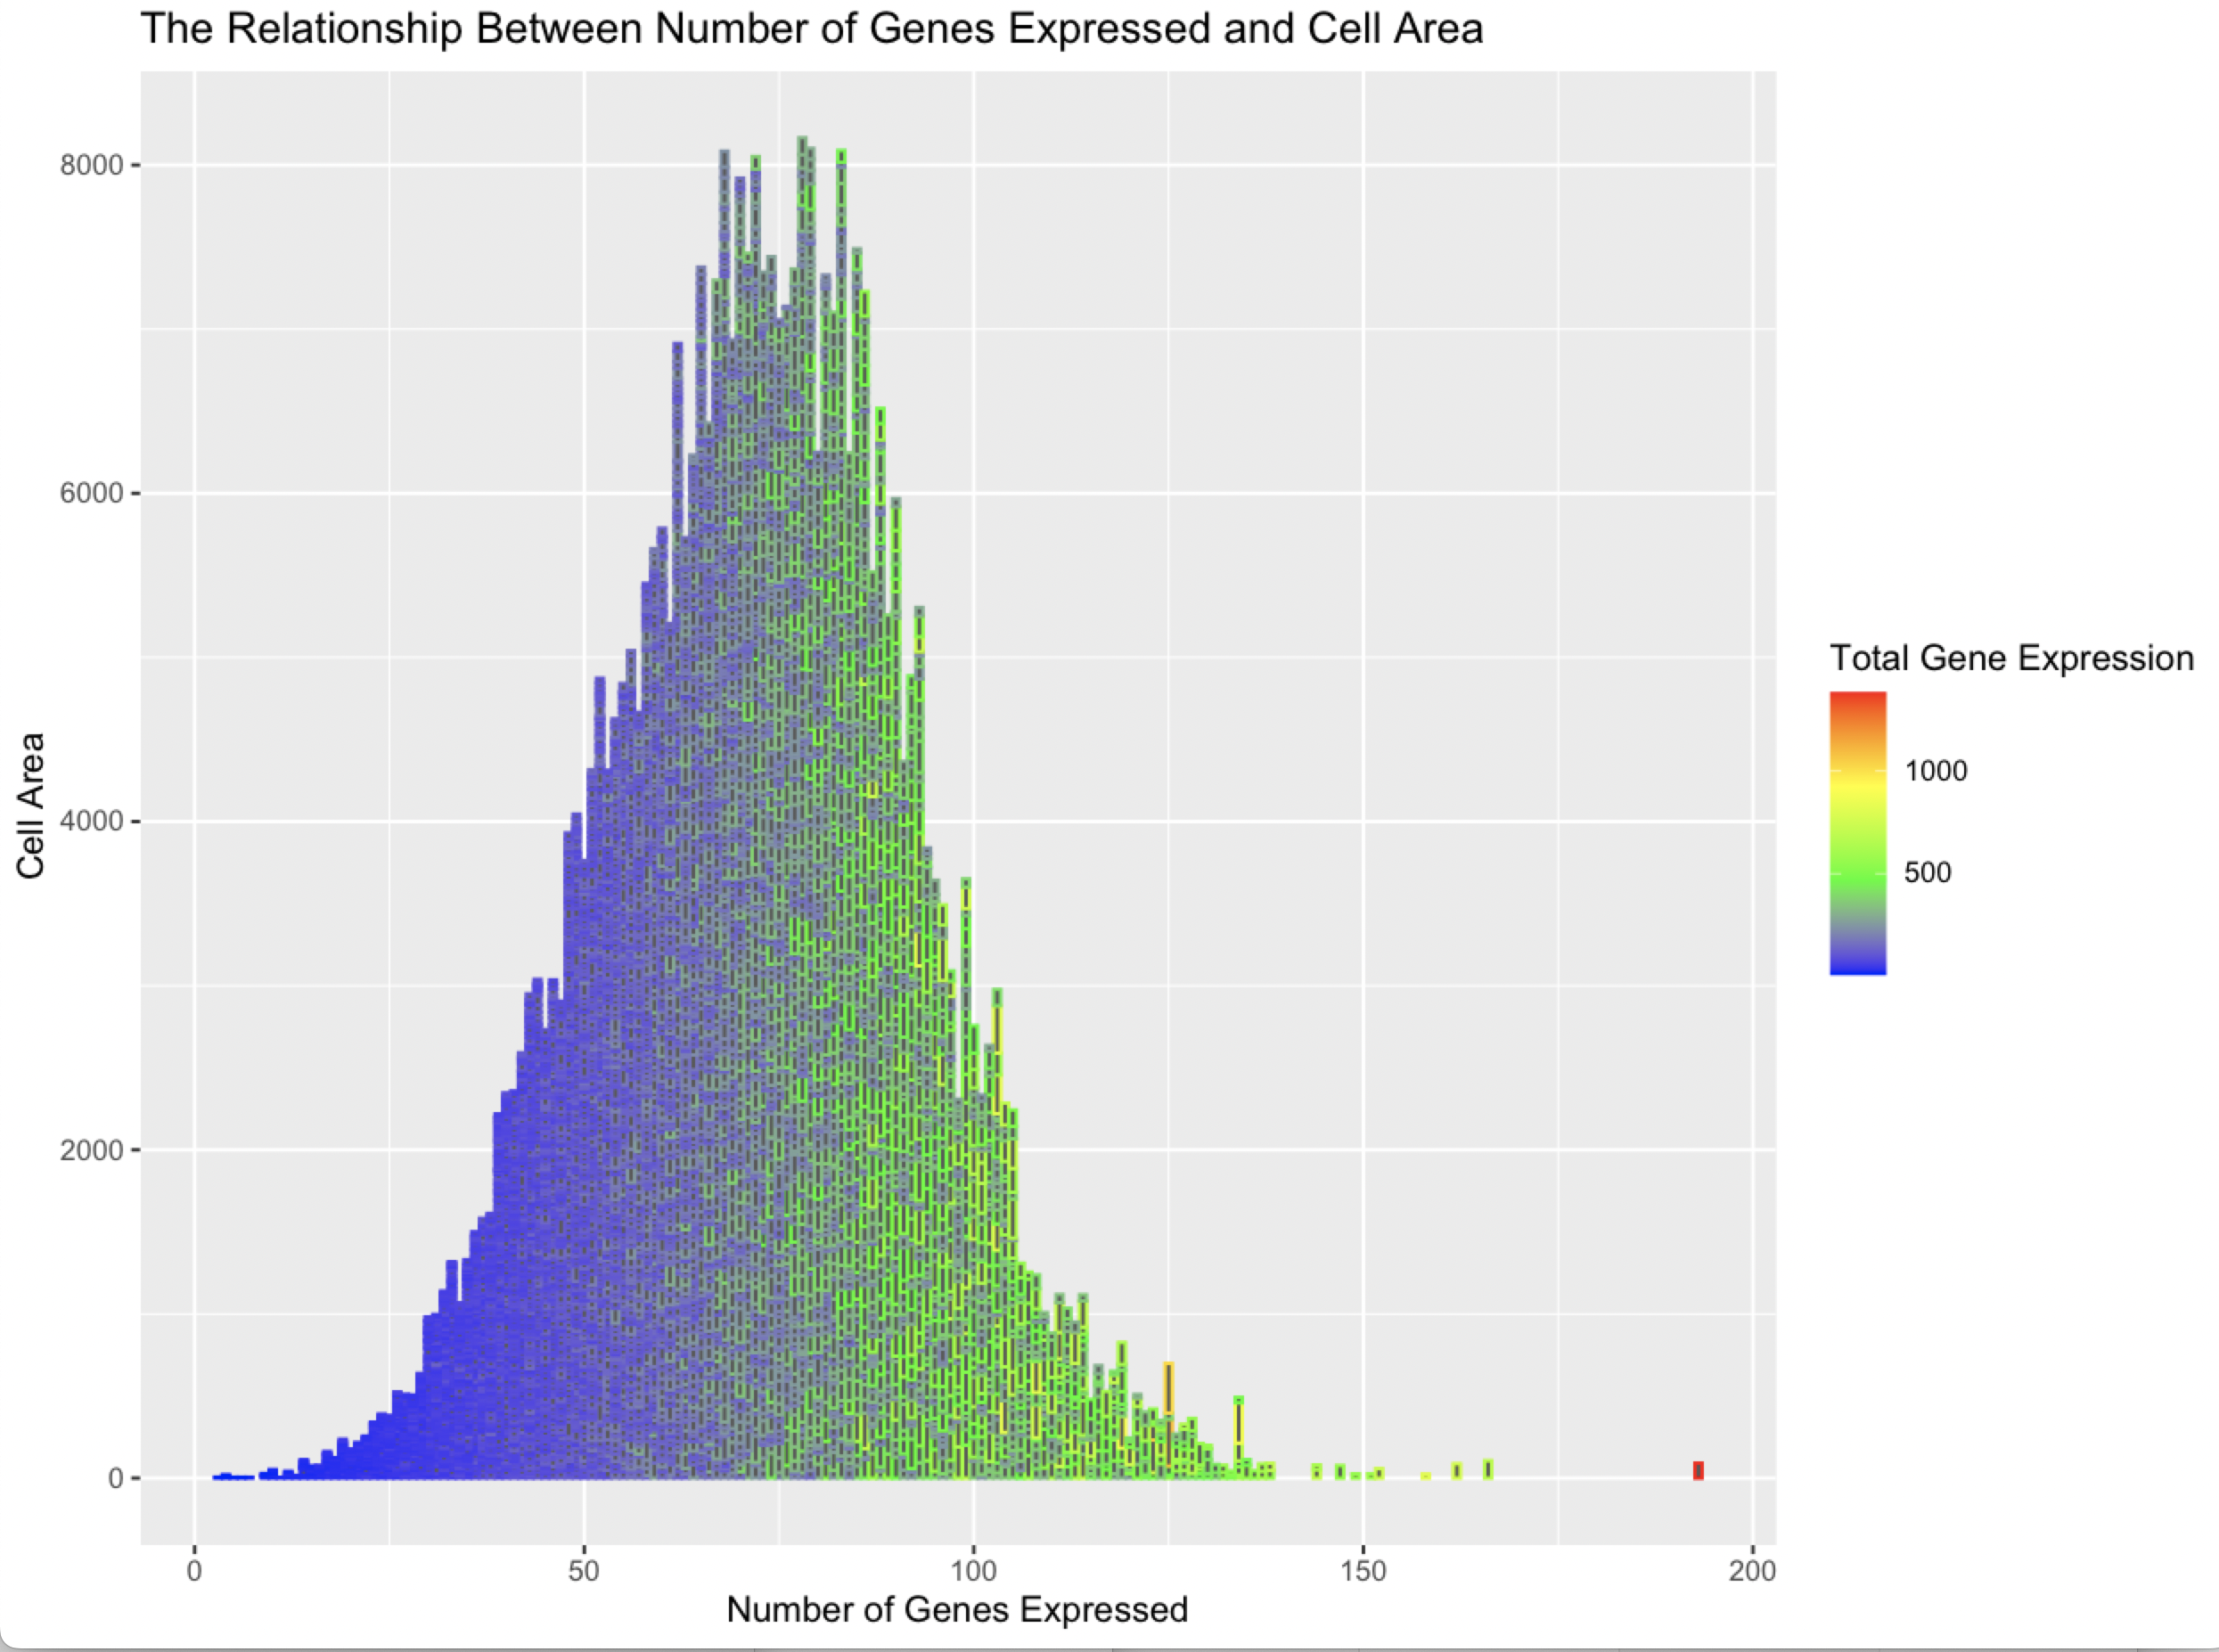
What data types are you visualizing? I am visualizing the given quantitative data type of “Cell Area”, and the calculated quantitative data type of “Number of Genes Expressed” (calculated by...
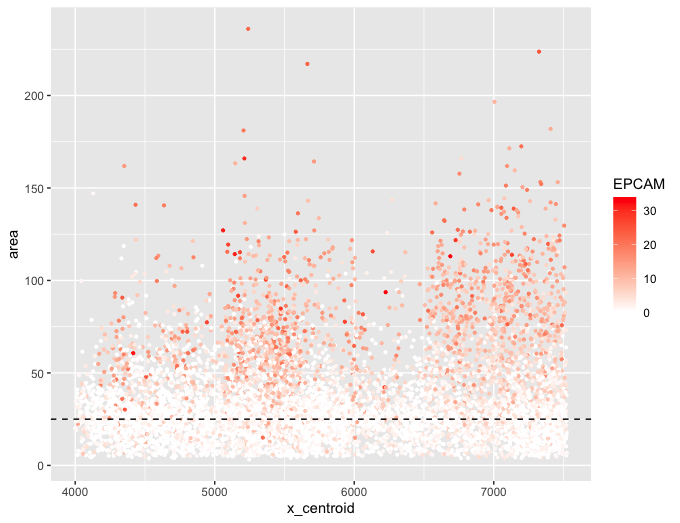
What data types are you visualizing? I am visualizing quantitative data of the expression count of the ERBB2 gene for each cell, quantitative data of the area for each cell,...
What data types are you visualizing? I am visualizing quantitative data of the comparative gene expression of two genes KRT7 and PTPRC. I am also visualizing the quantitative data of...
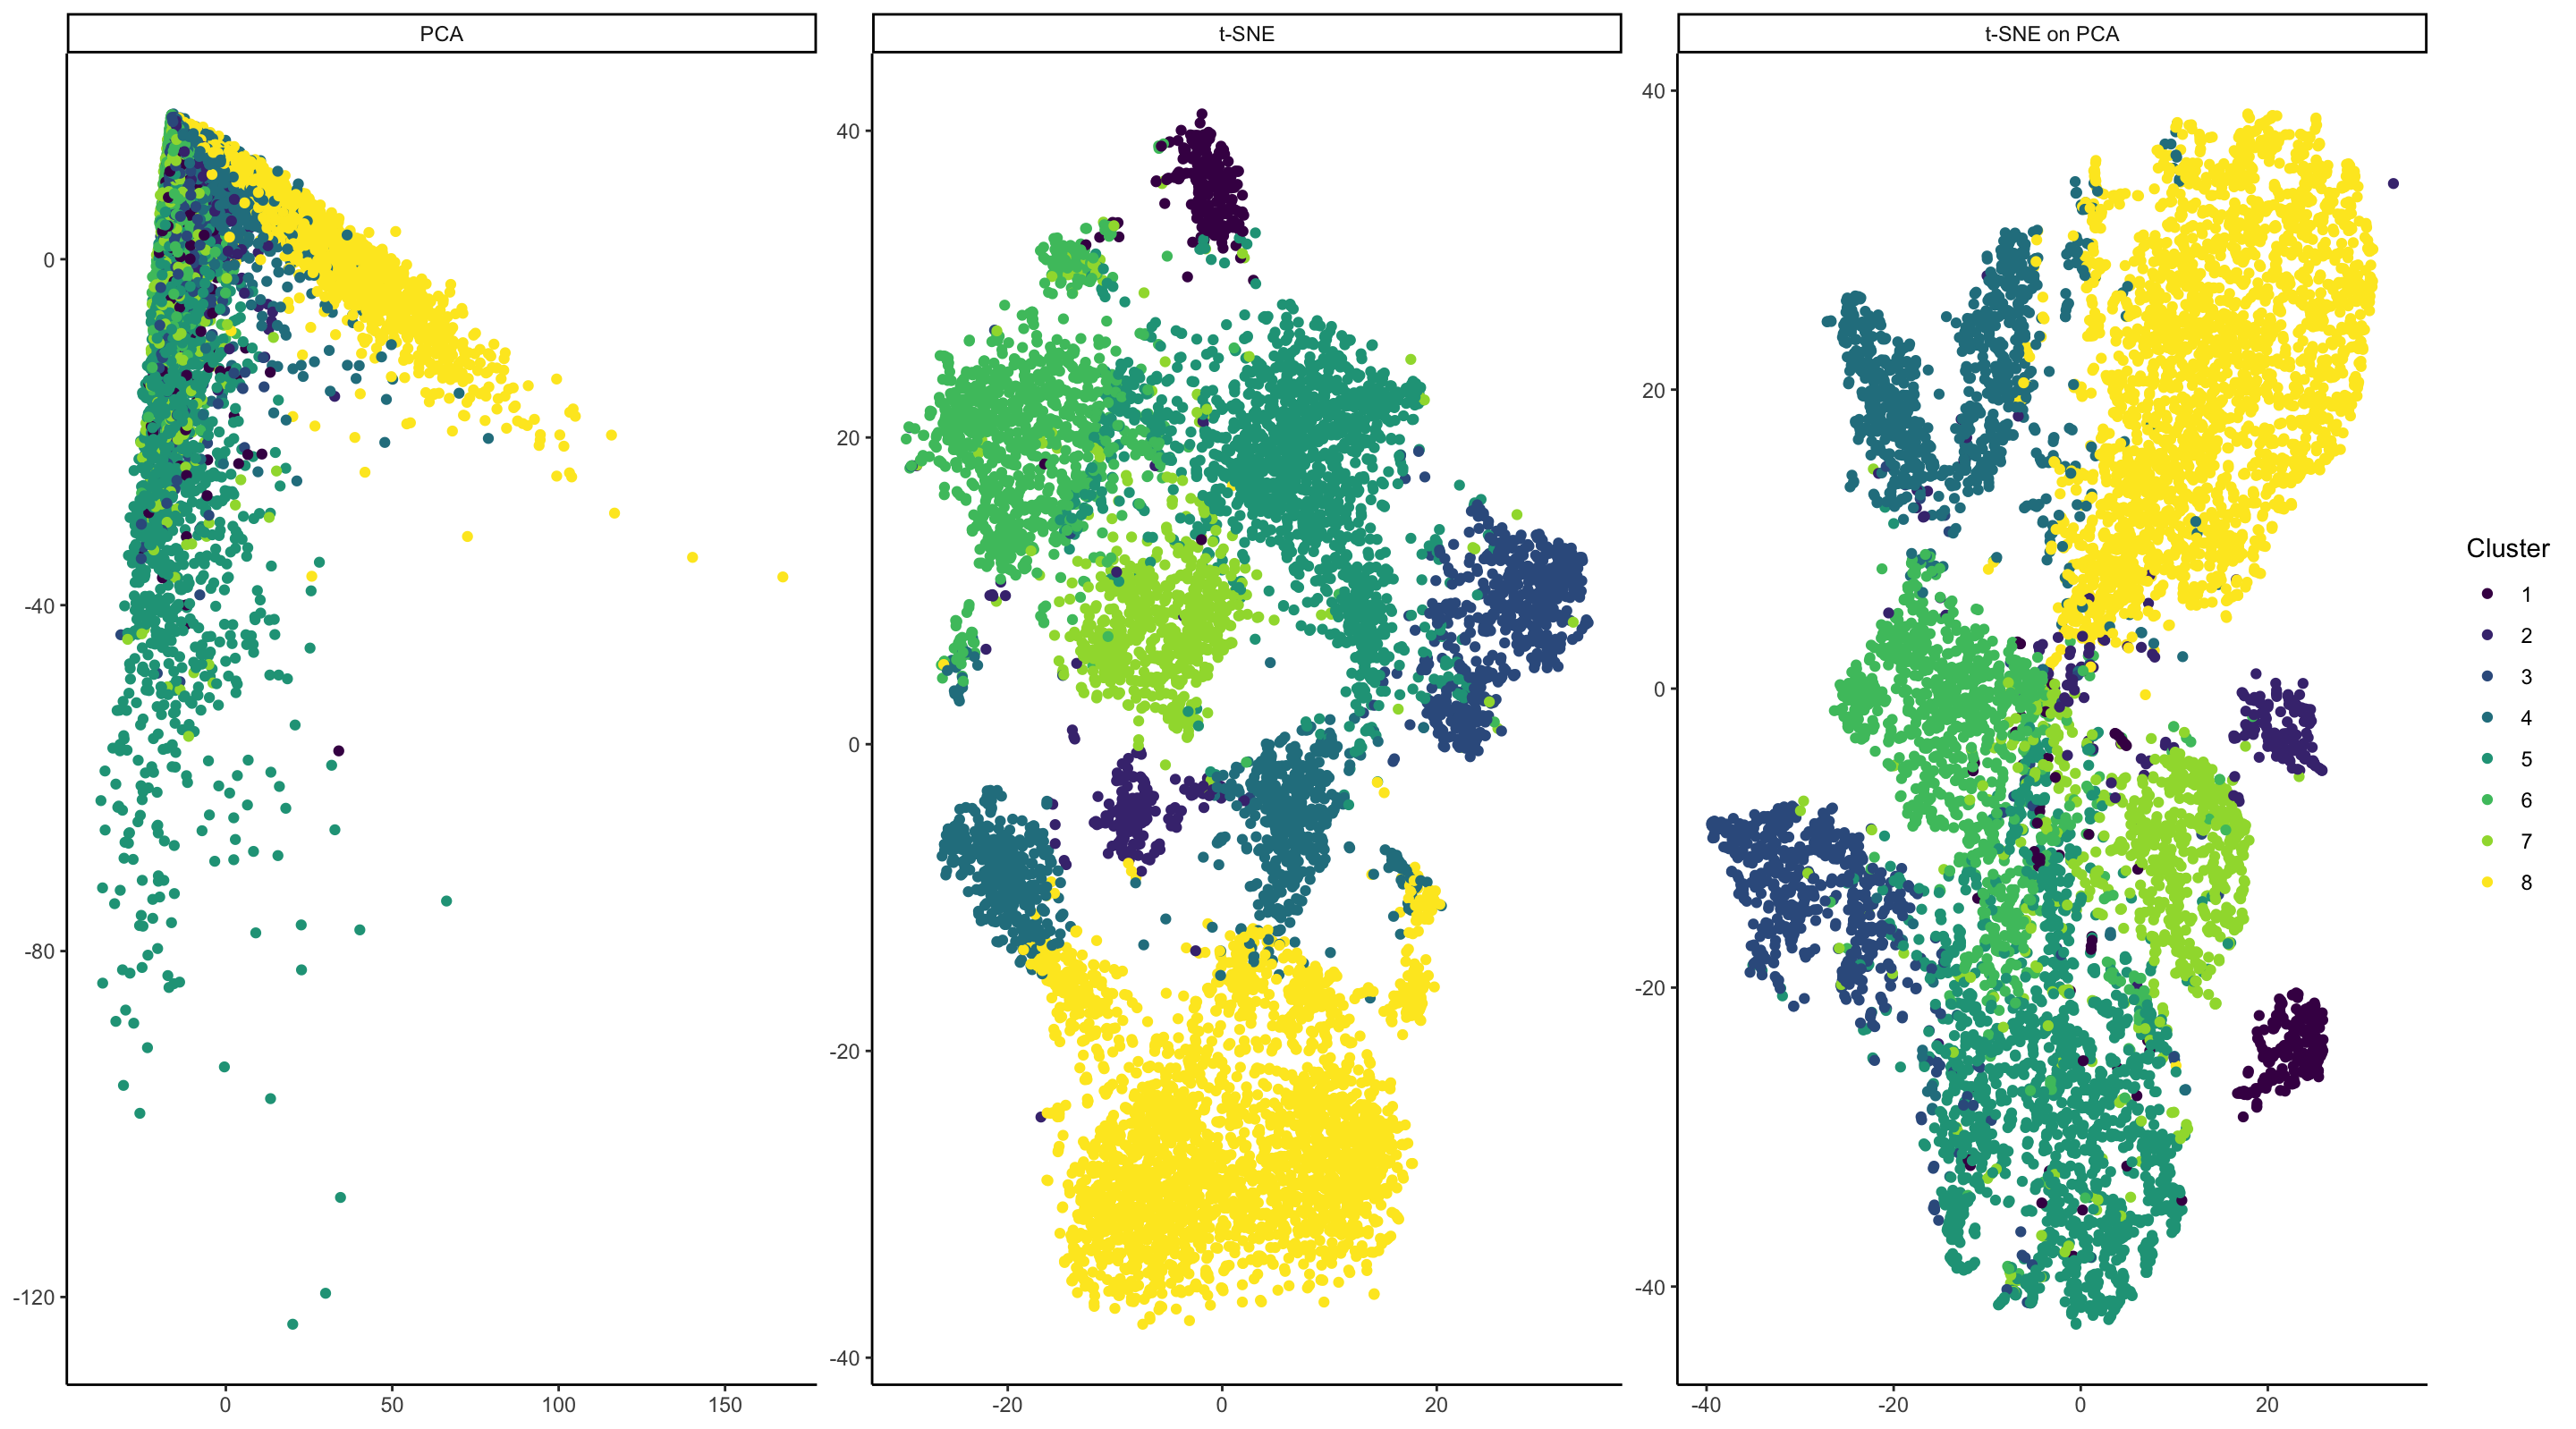
What data types are you visualizing? I am visualizing quantitative data of 2 dimensional reduction through PCA and tSNE of original PDGFRB expression for each cell, quantitative data of 2...
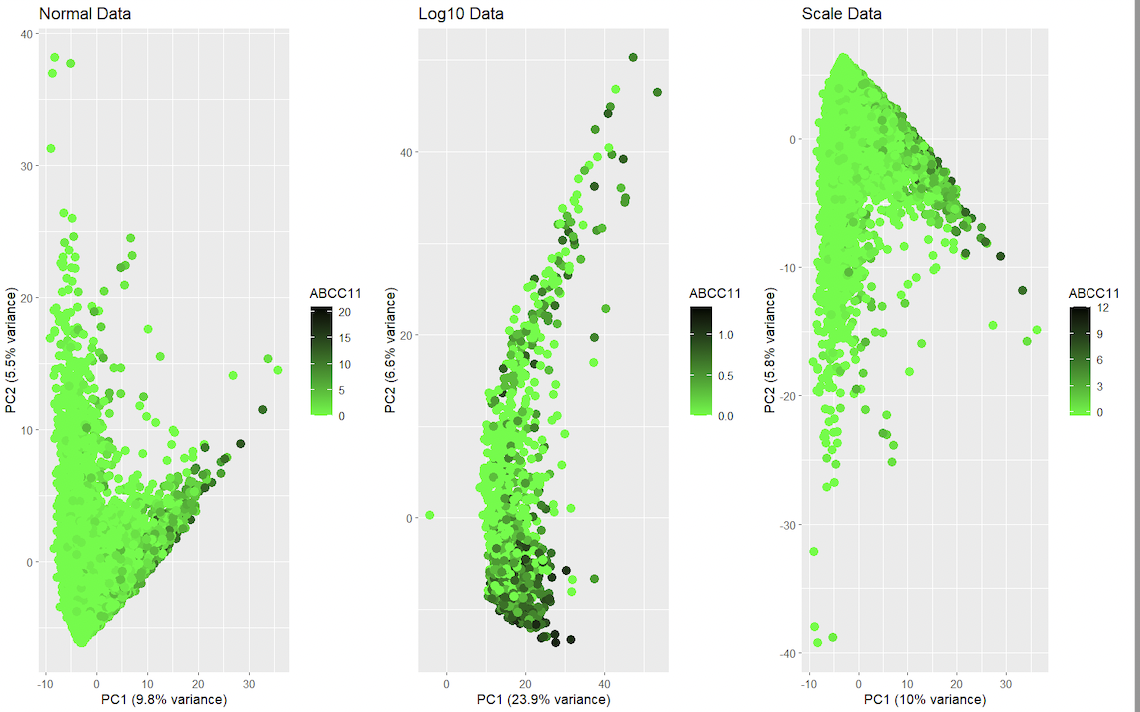
1. Should I normalize and/or transform the gene expression data (e.g. log and/or scale) prior to dimensionality reduction? It is recommended to normalize the data with scale to help take...
What data types are you visualizing? I am visualizing the similarities in levels of overall gene expression in cells that have non-zero expression of ERBB2 and the level of expression...
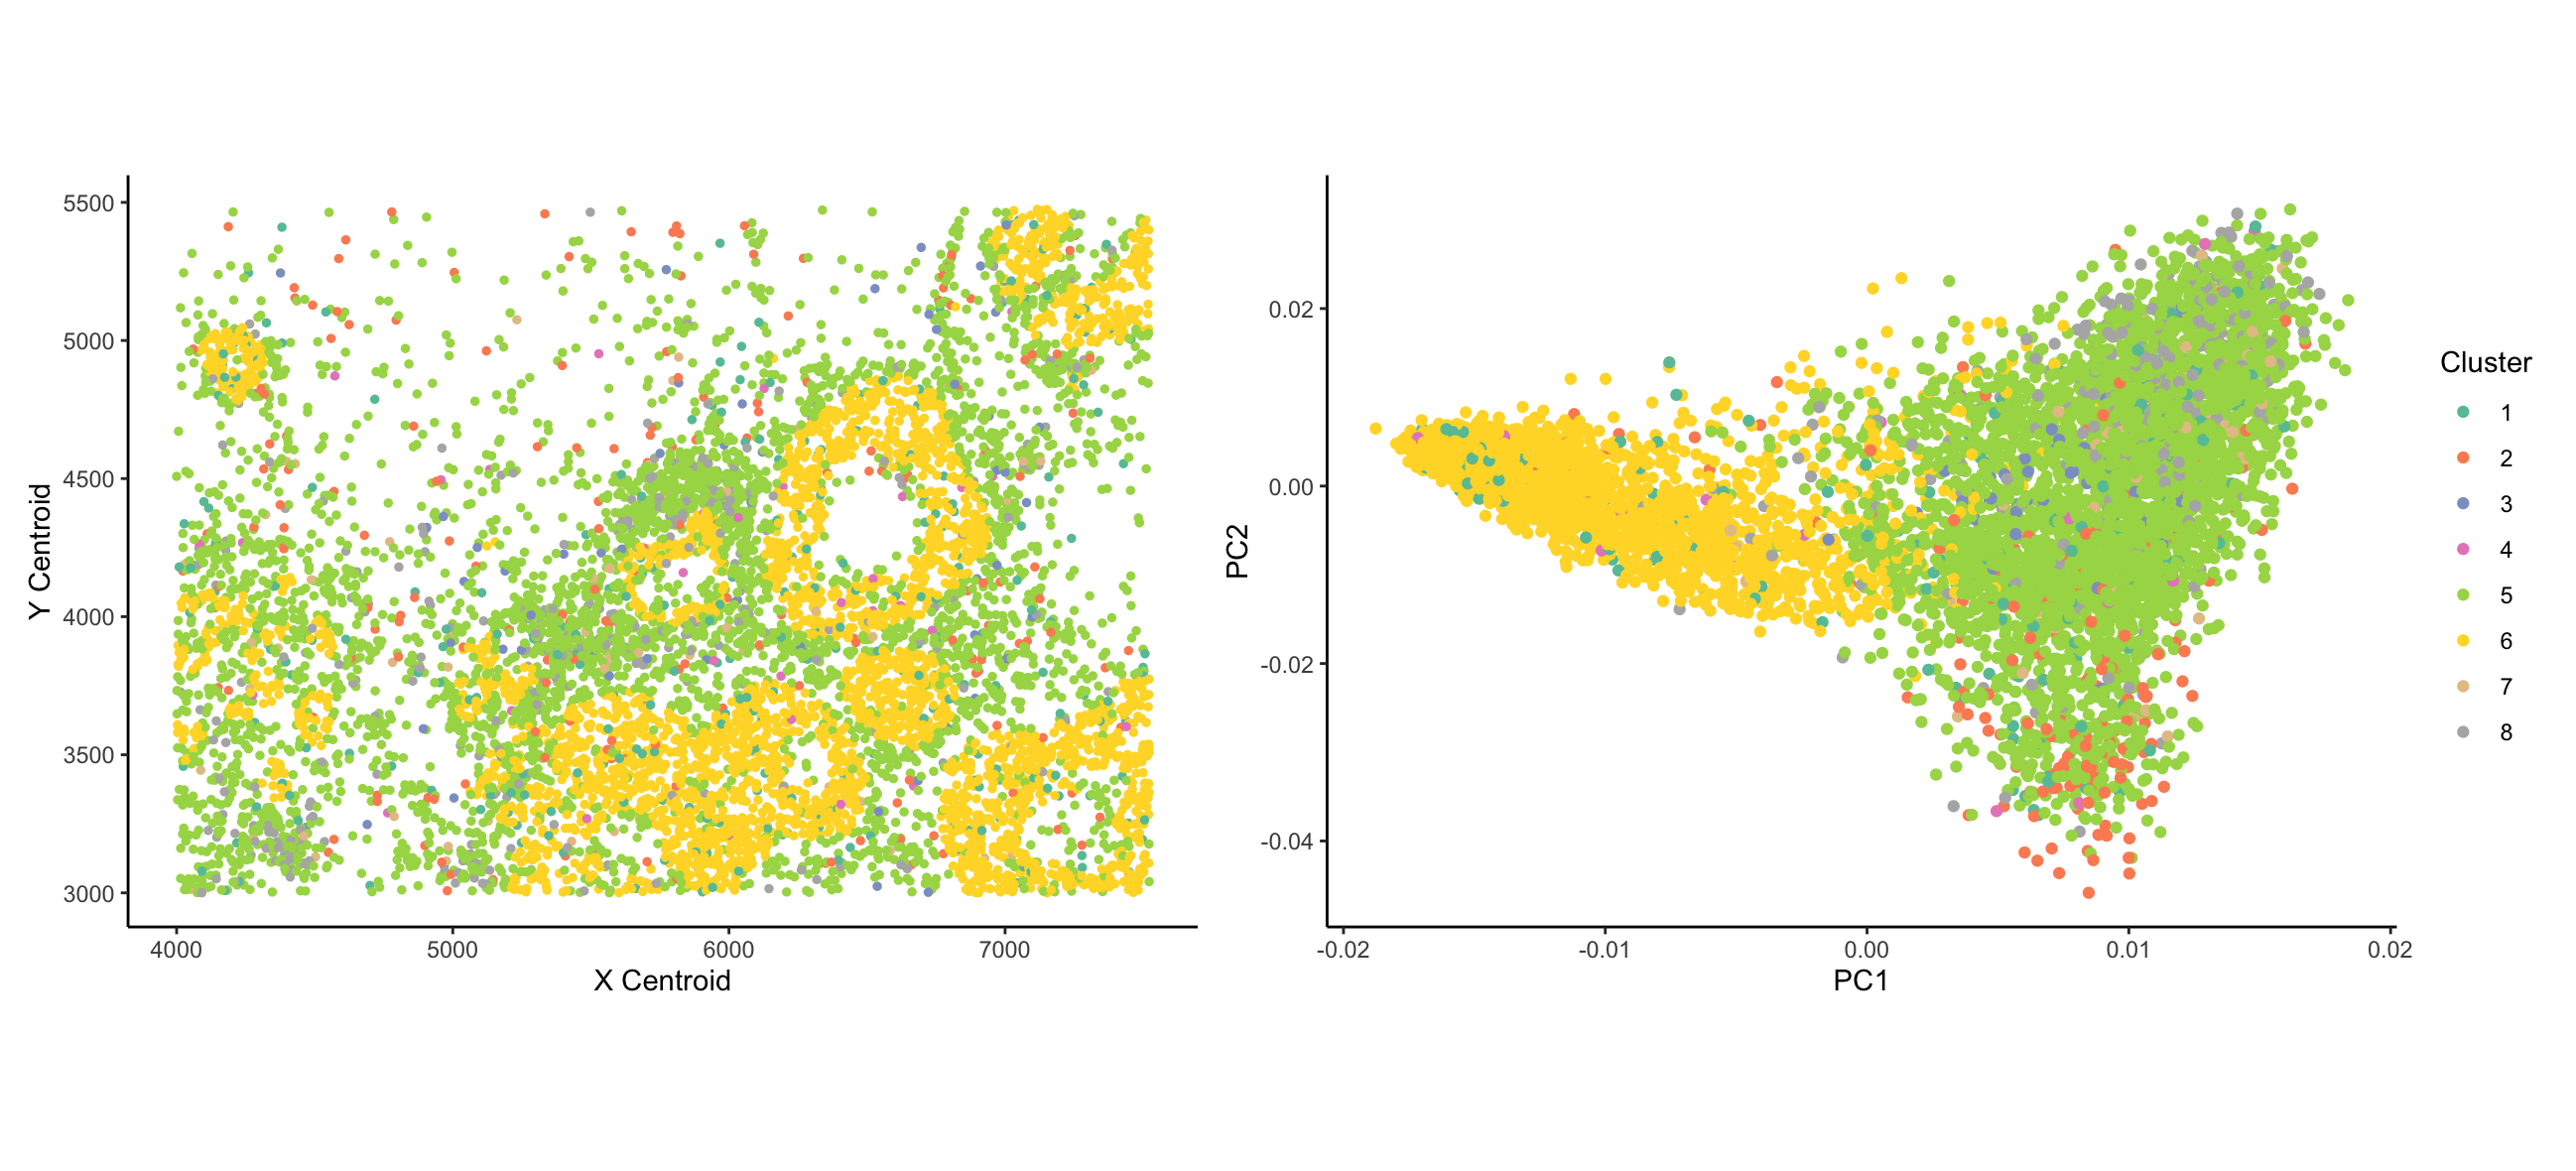
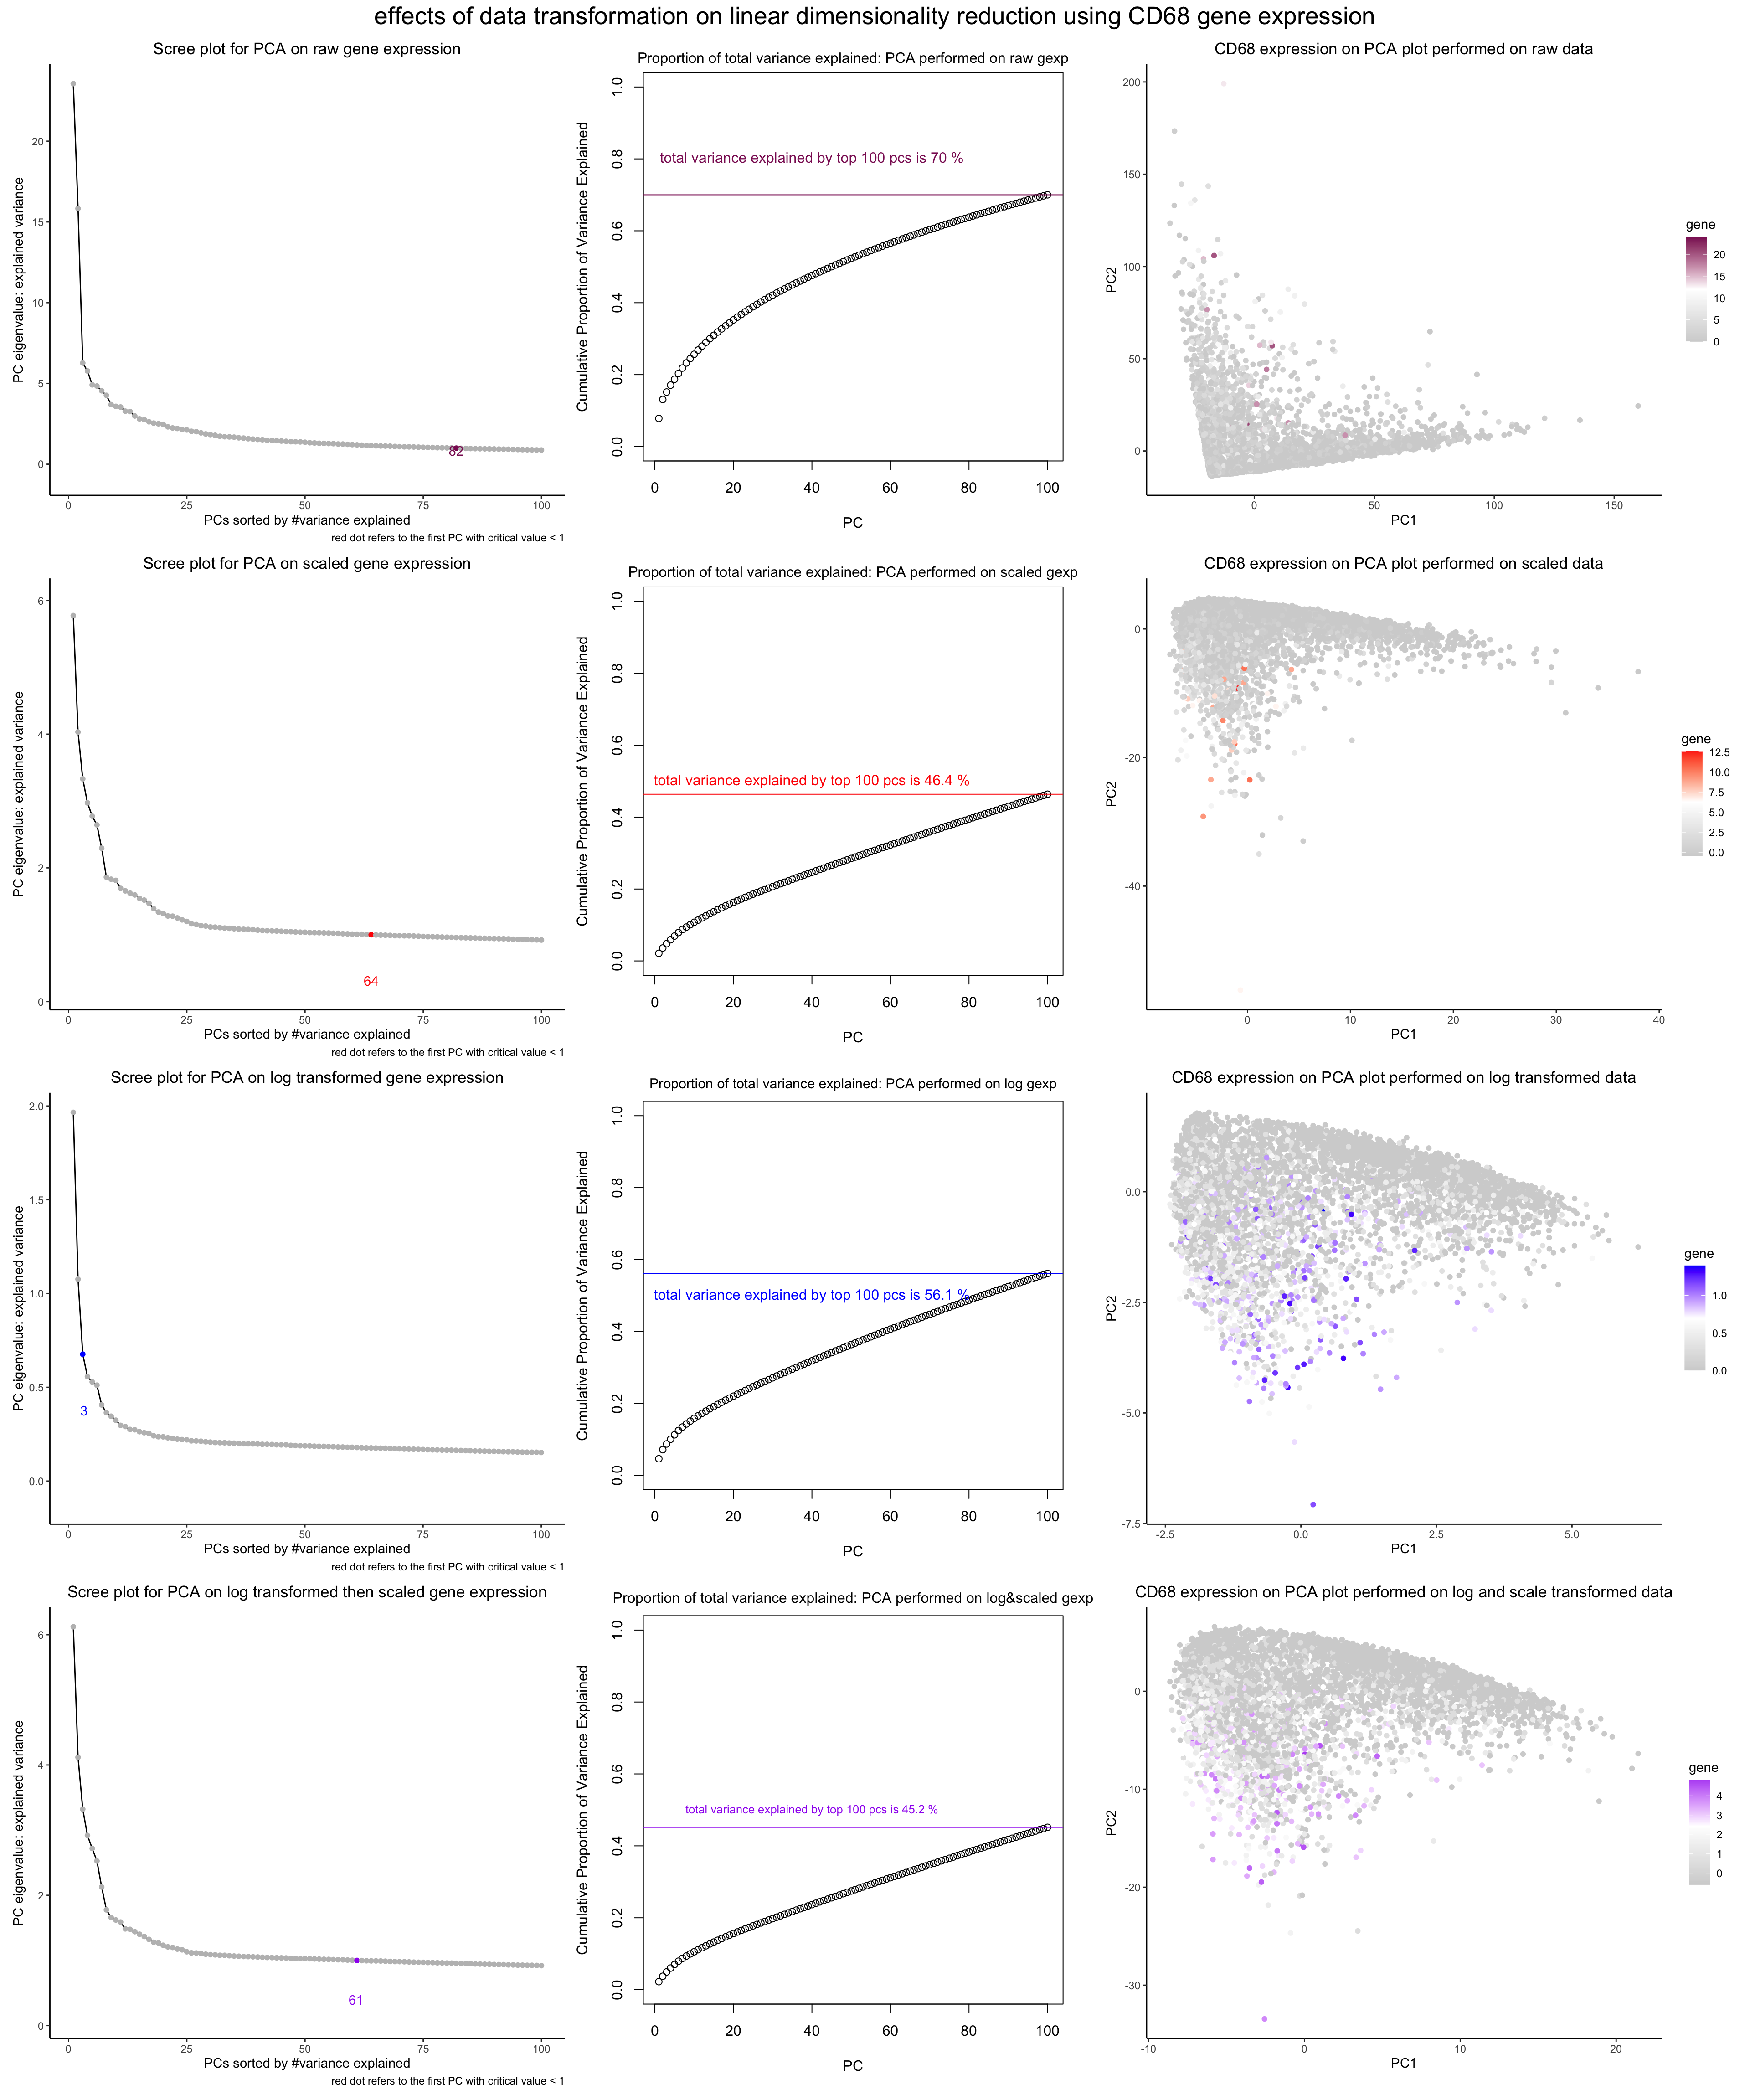
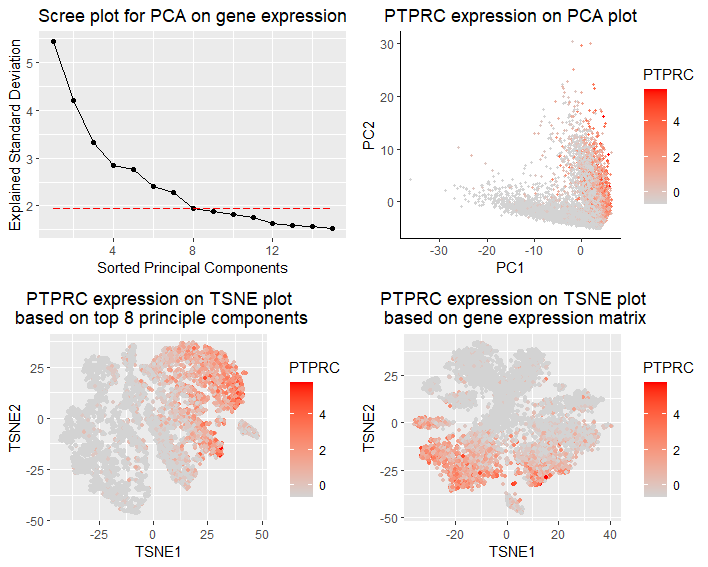
What data types are you visualizing? In this multi-panel plot, I am visualizing various quantitative and categorical data. For the PCA plot on the upper left, I am visualizing quantitative...
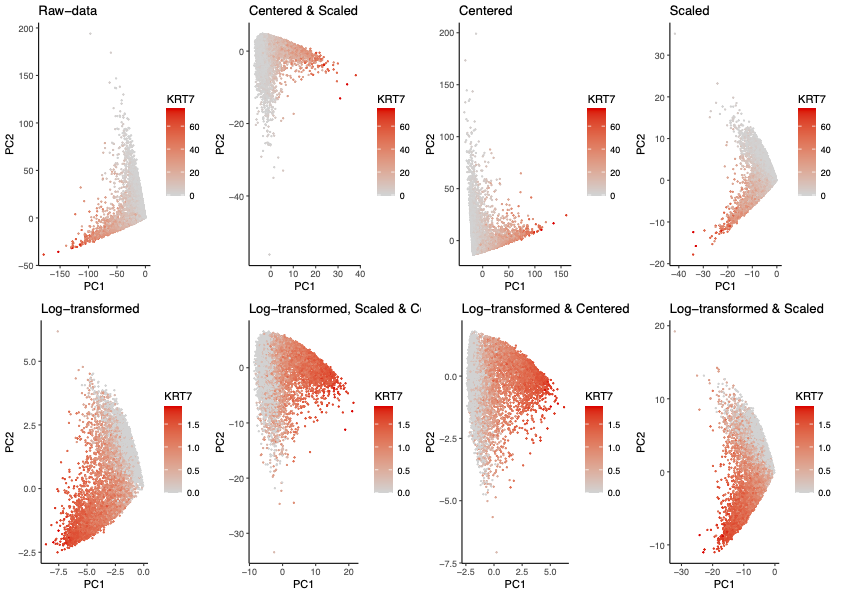
This series of plots demonstrates the effects of preprocessing steps taken prior to utilizing PCA for dimensionality reduction of multi-dimensional gene expression data. Some pre-processing steps include but is not...
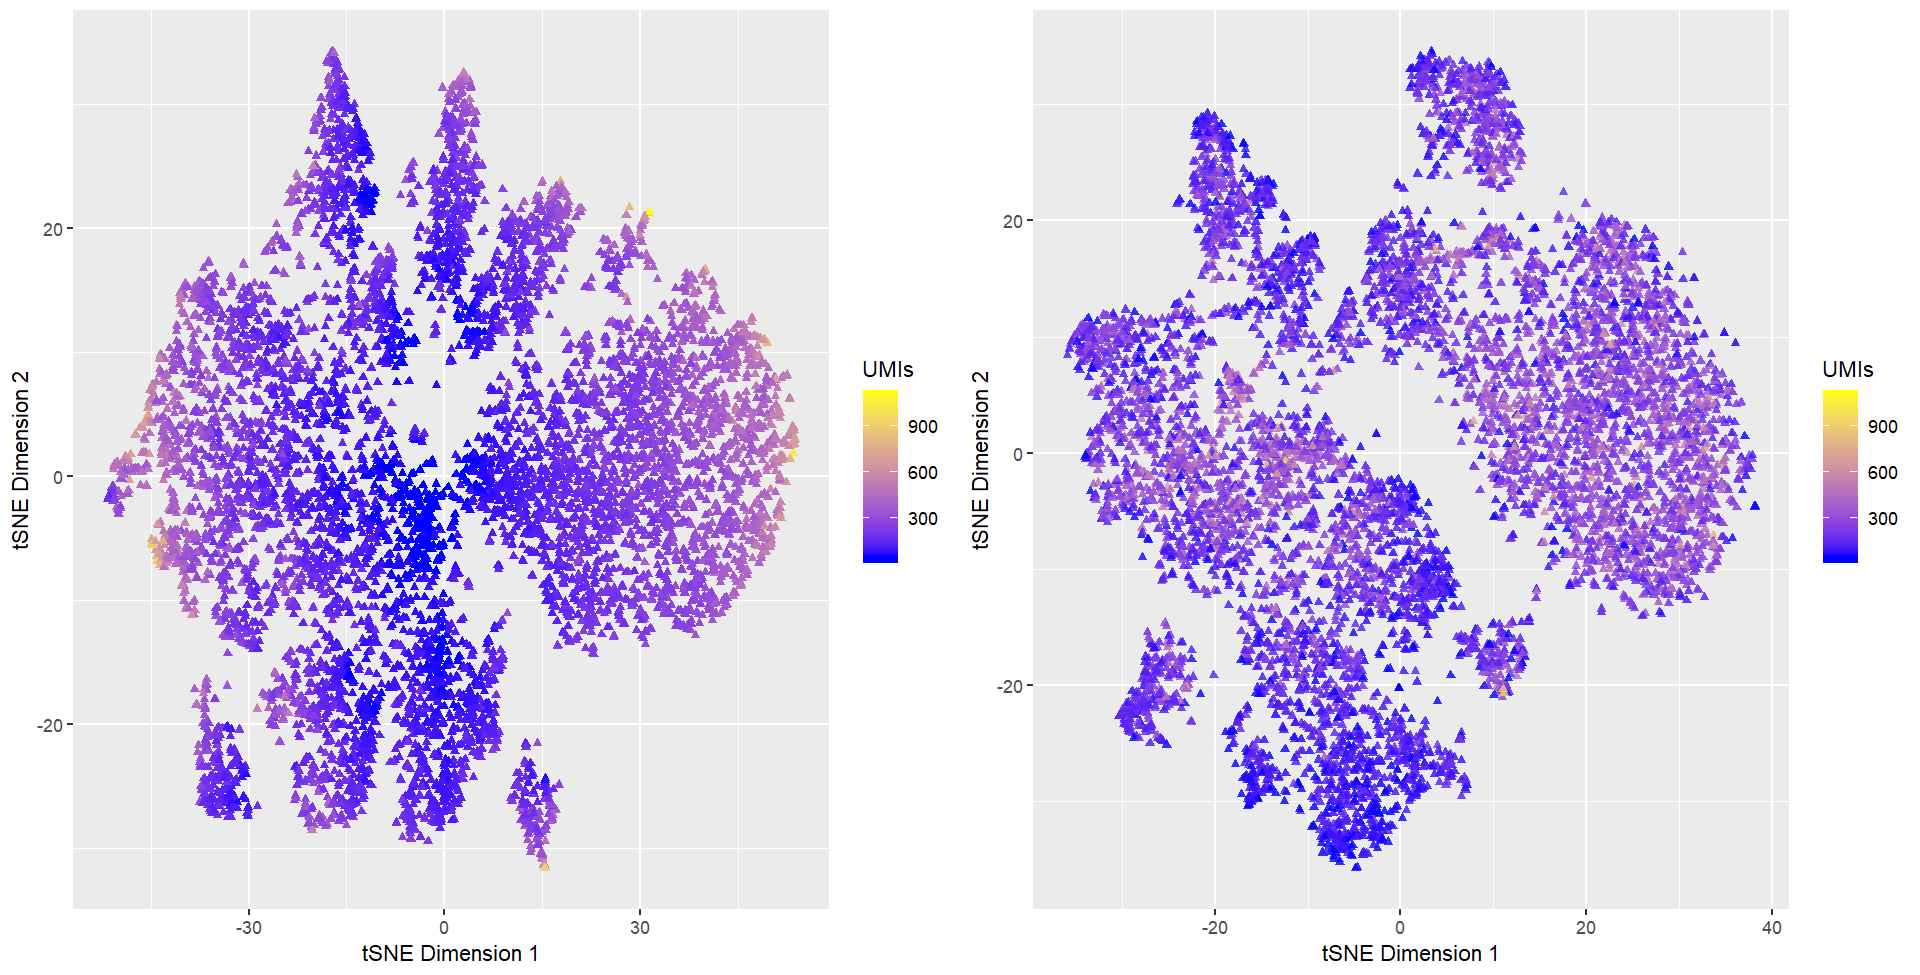
What data types are you visualizing? I am visualizing quantitative data of cells’ position on tSNE embedded 2-dimensional space. I am also visualizing the total gene count for each individual...
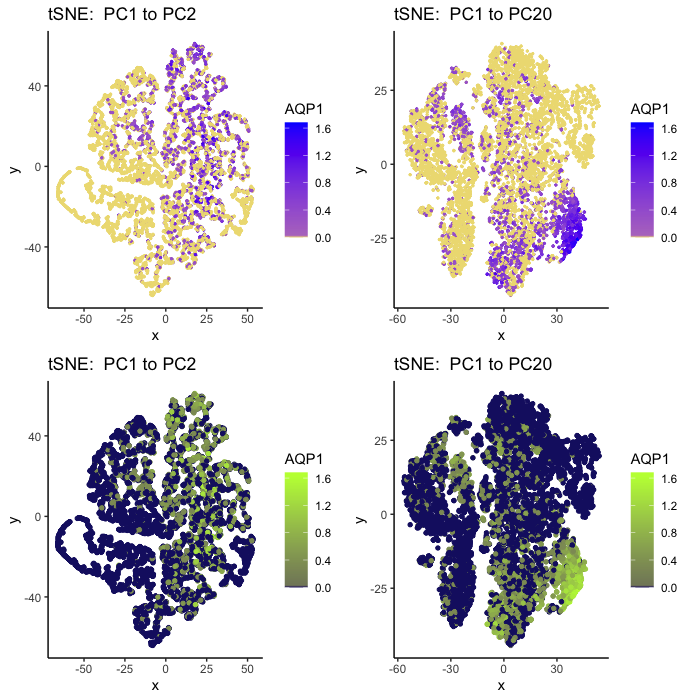
What data types are you visualizing? I am visualizing the qualitative expression data of PTPRC,the most dominant gene in PCA, with respect to different TSNE reductions upon gene expression or...
What data types are you visualizing? I present quantitative data of the PCA and tSNE reduced dimension applied to the raw gene expression data and the normalized by gene count...
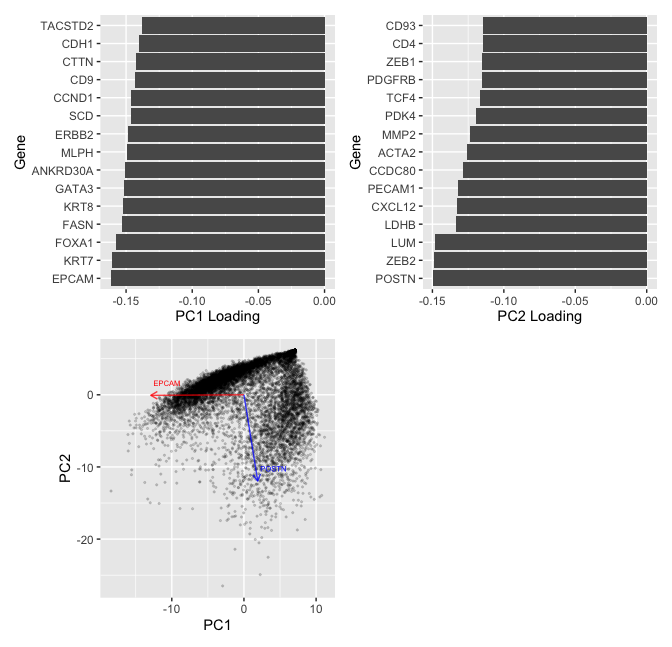
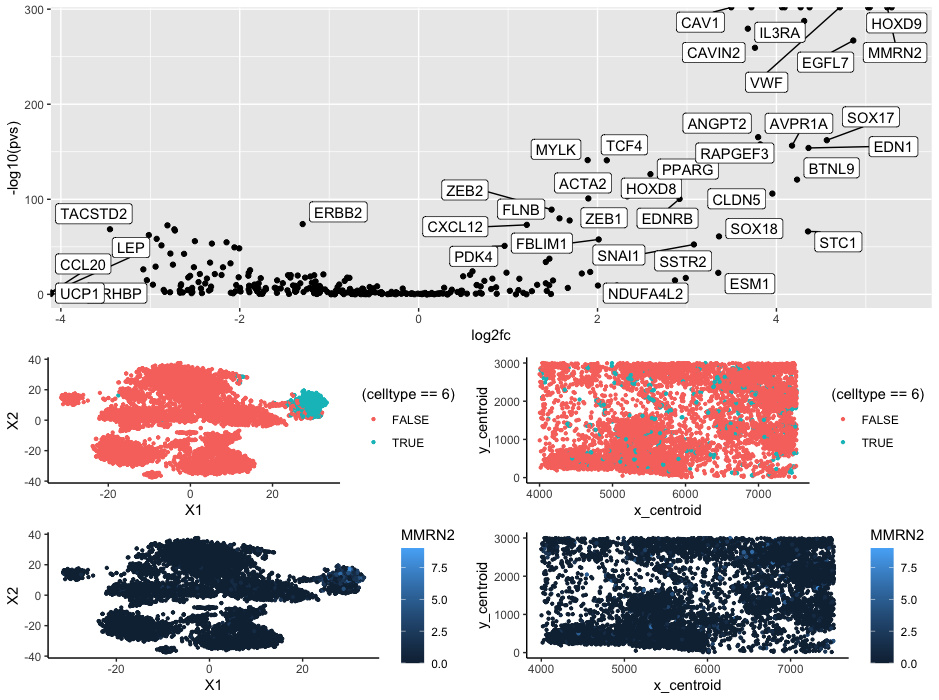
In my plots, I am looking at cell clusters 1 and 8. These clusters separate strongly from the other cells along PC1 and remain close together on t-SNE projections. In...
The cluster appears to be endothelial cells that make up adipose tissue. When looking at the Wilcox vs log2fc graph three of most significantly upregulated genes are CAV1, VWF, and...
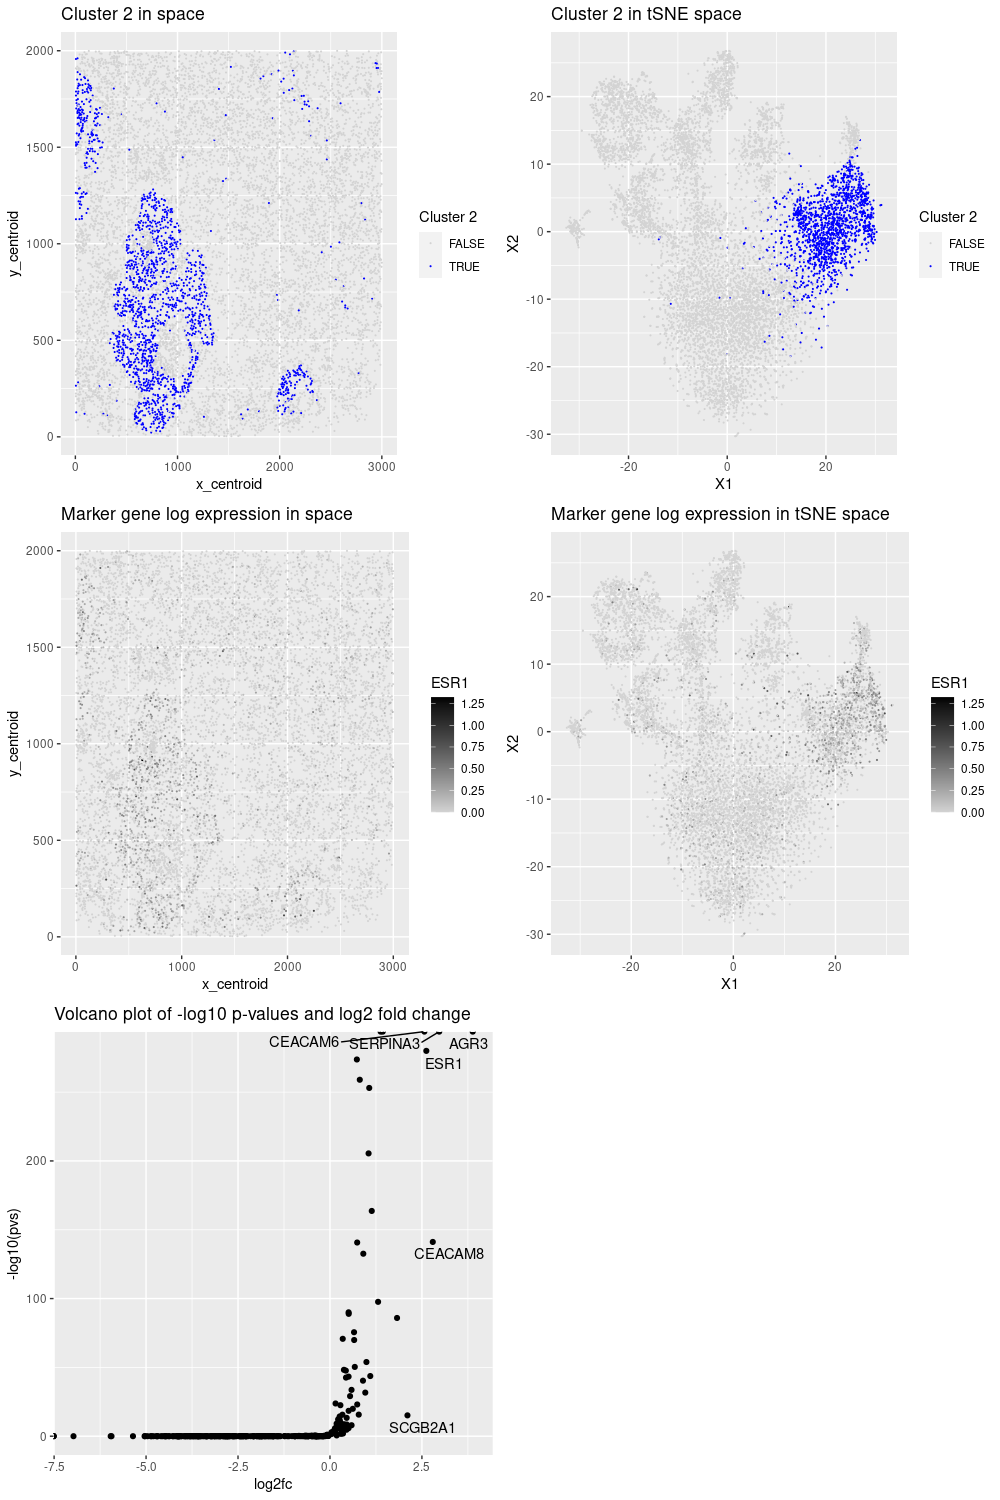
Cell-type annotation For this data visualization, we selected cluster 2 as it presented an interesting pattern. Then, by performing kmeans clustering and differential analysis on the normalized data, we noticed...
The data visualization chooses cluster 3 to be analyzed. It then identifies gene that are differentially expressed in that cluster compared to all the other clusters in the dataset. The...
In order to determine cell type from cell cluster, I aimed to find particular genes which are both highly specific to one type of breast cell and also present in...
Description of my multi-panel plot Here, I identified a cluster that seems to be CD8+ T cells. In order to generate the plot above, I normalized the raw gene expression...
I used kmeans clustering to identify different cell types by looking at clusters in my data. I preproceessed my data by normalizing by total gene count and putting everything on...
After performing kmeans clustering on my dataset, I randomly decided on investigating cluster 5 of my kmeans clustering. After a thorough analysis, I have concluded that this cluster is likely...
The visualization presented above comprises eight panels, all of which provide evidence to support the hypothesis that cluster 1 corresponds to breast glandular cells, a type of epithelial cell (1)....
The purpose of this visualization to present the usage of differential gene expression to validate cell type identification in k-means and tsne analysis of the dataset. The quantitative data of...
A. PCA and tSNE projection of spatial transcriptomics data. B. Cell cluster overlayed on spatial plot of cell patches. C. DE analysis of Cell Cluster 1 against all others; 20...
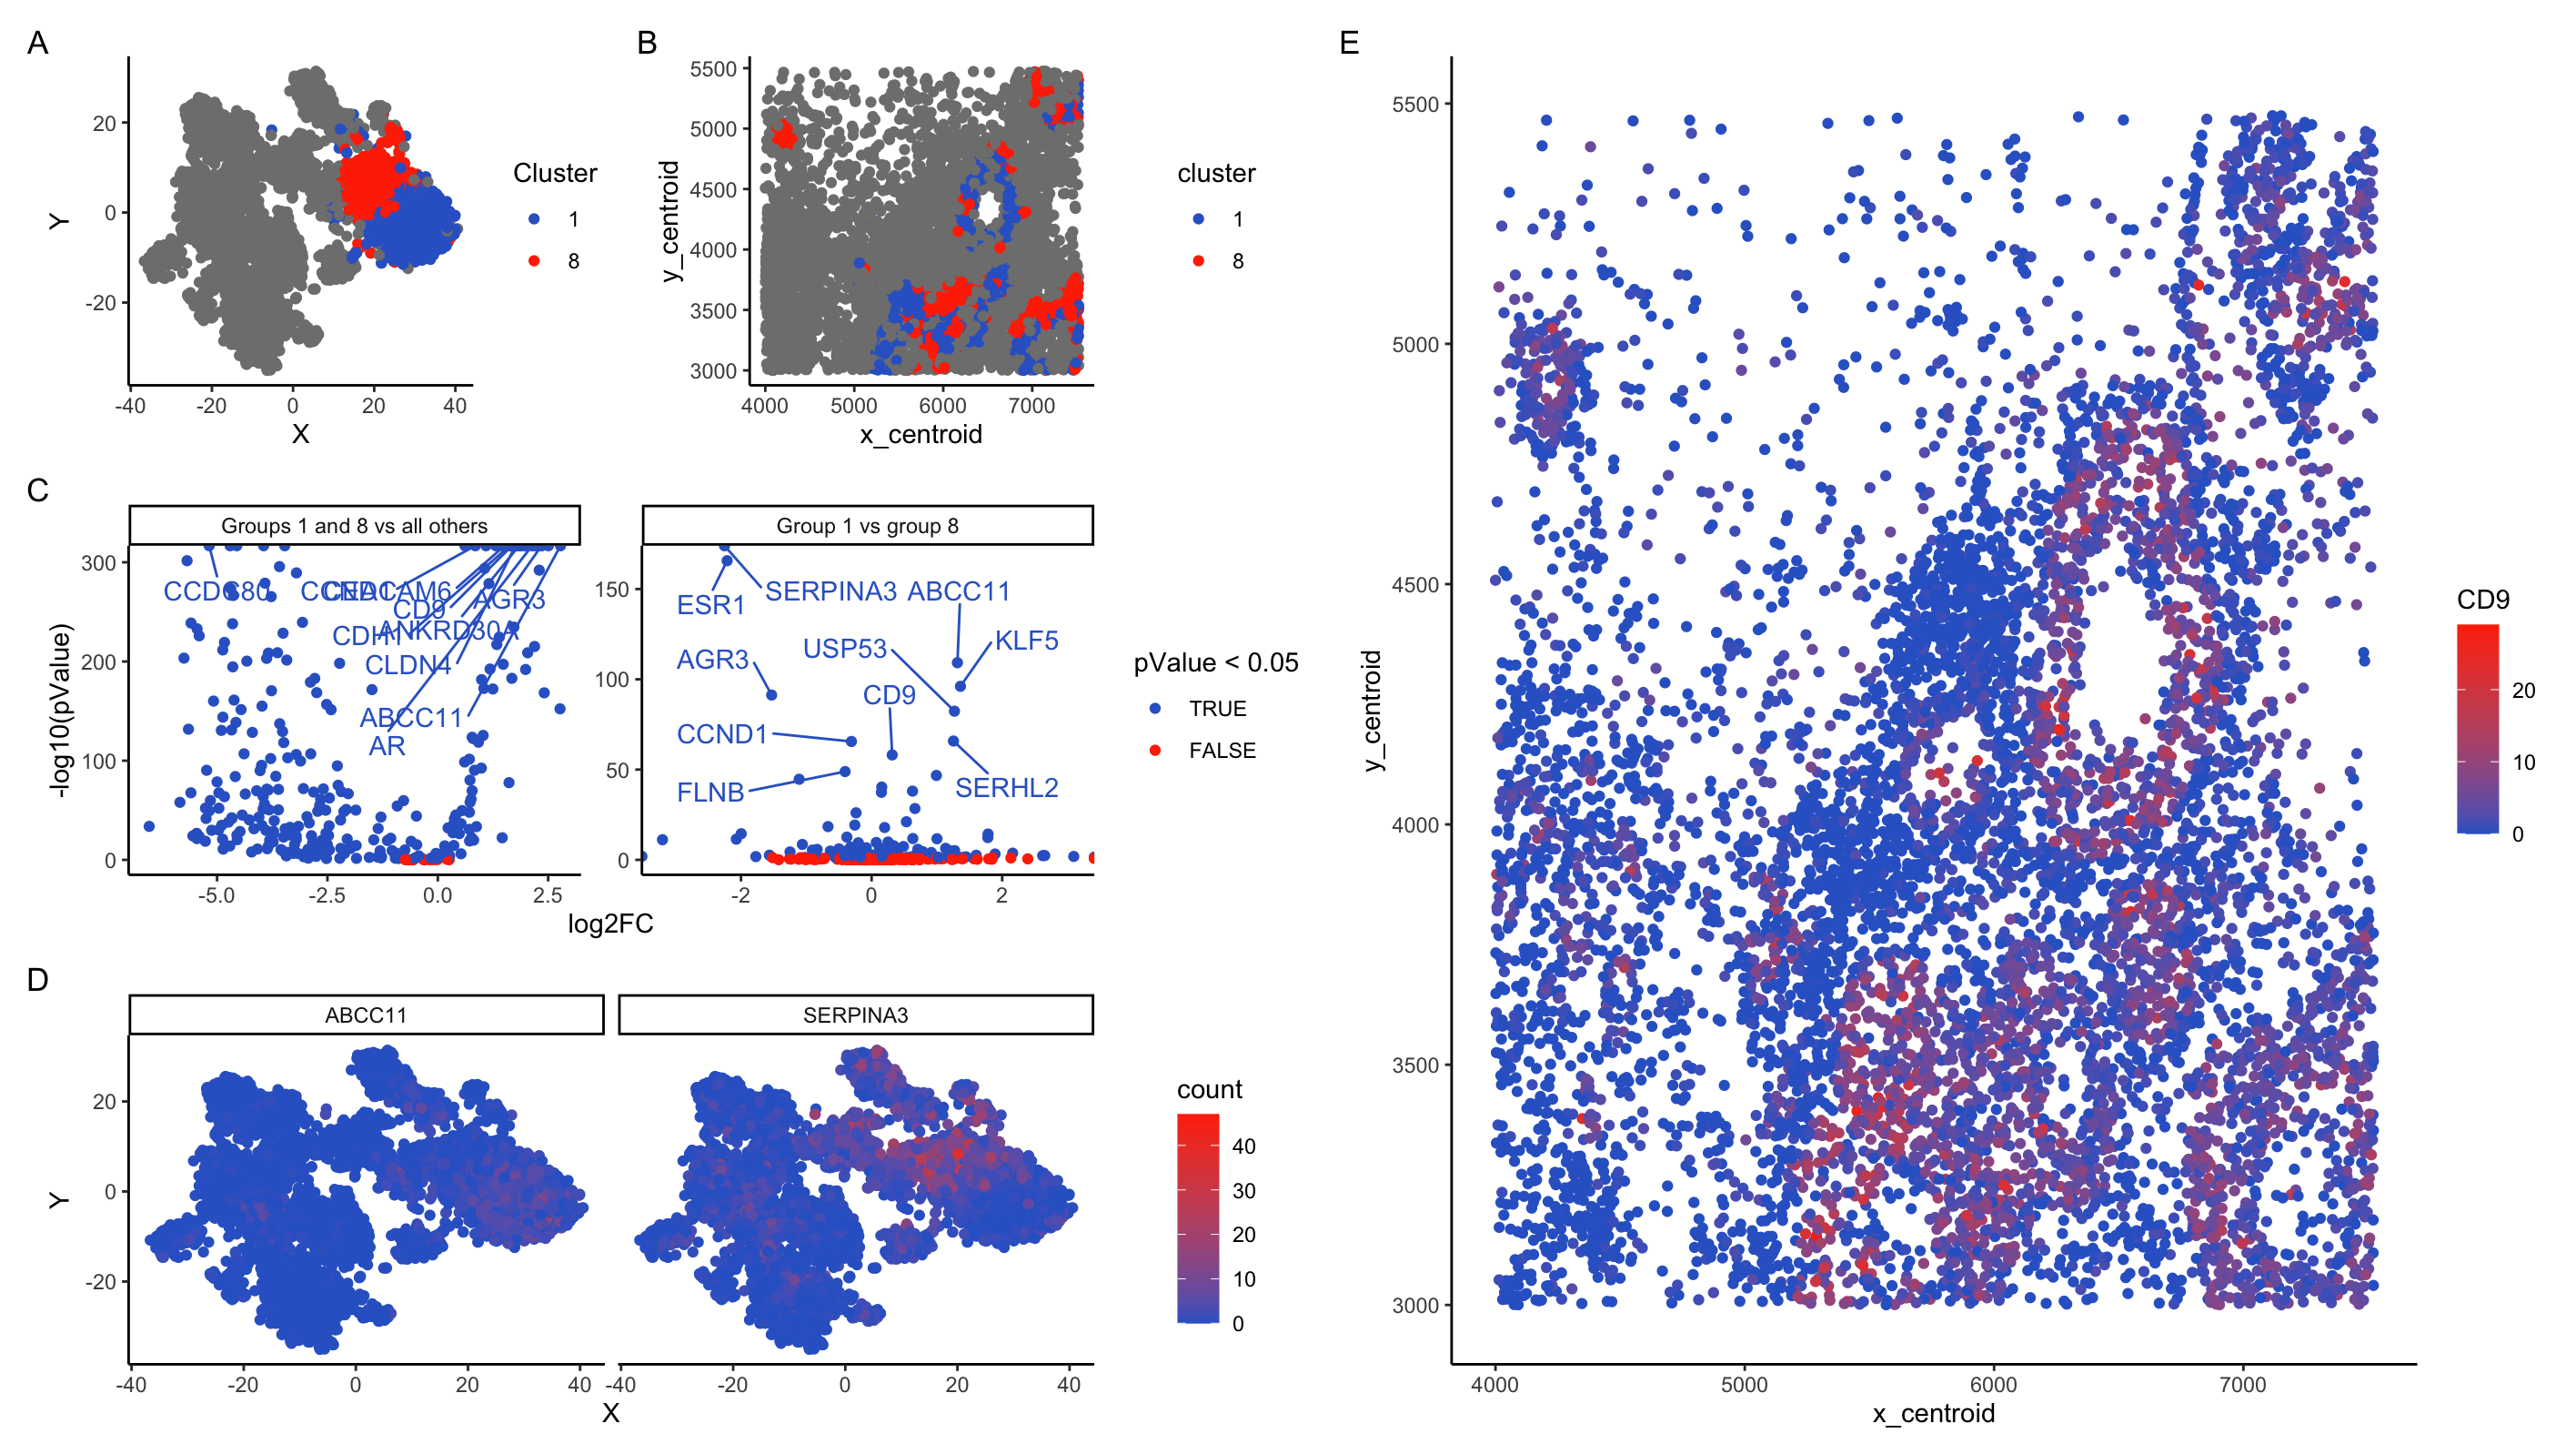
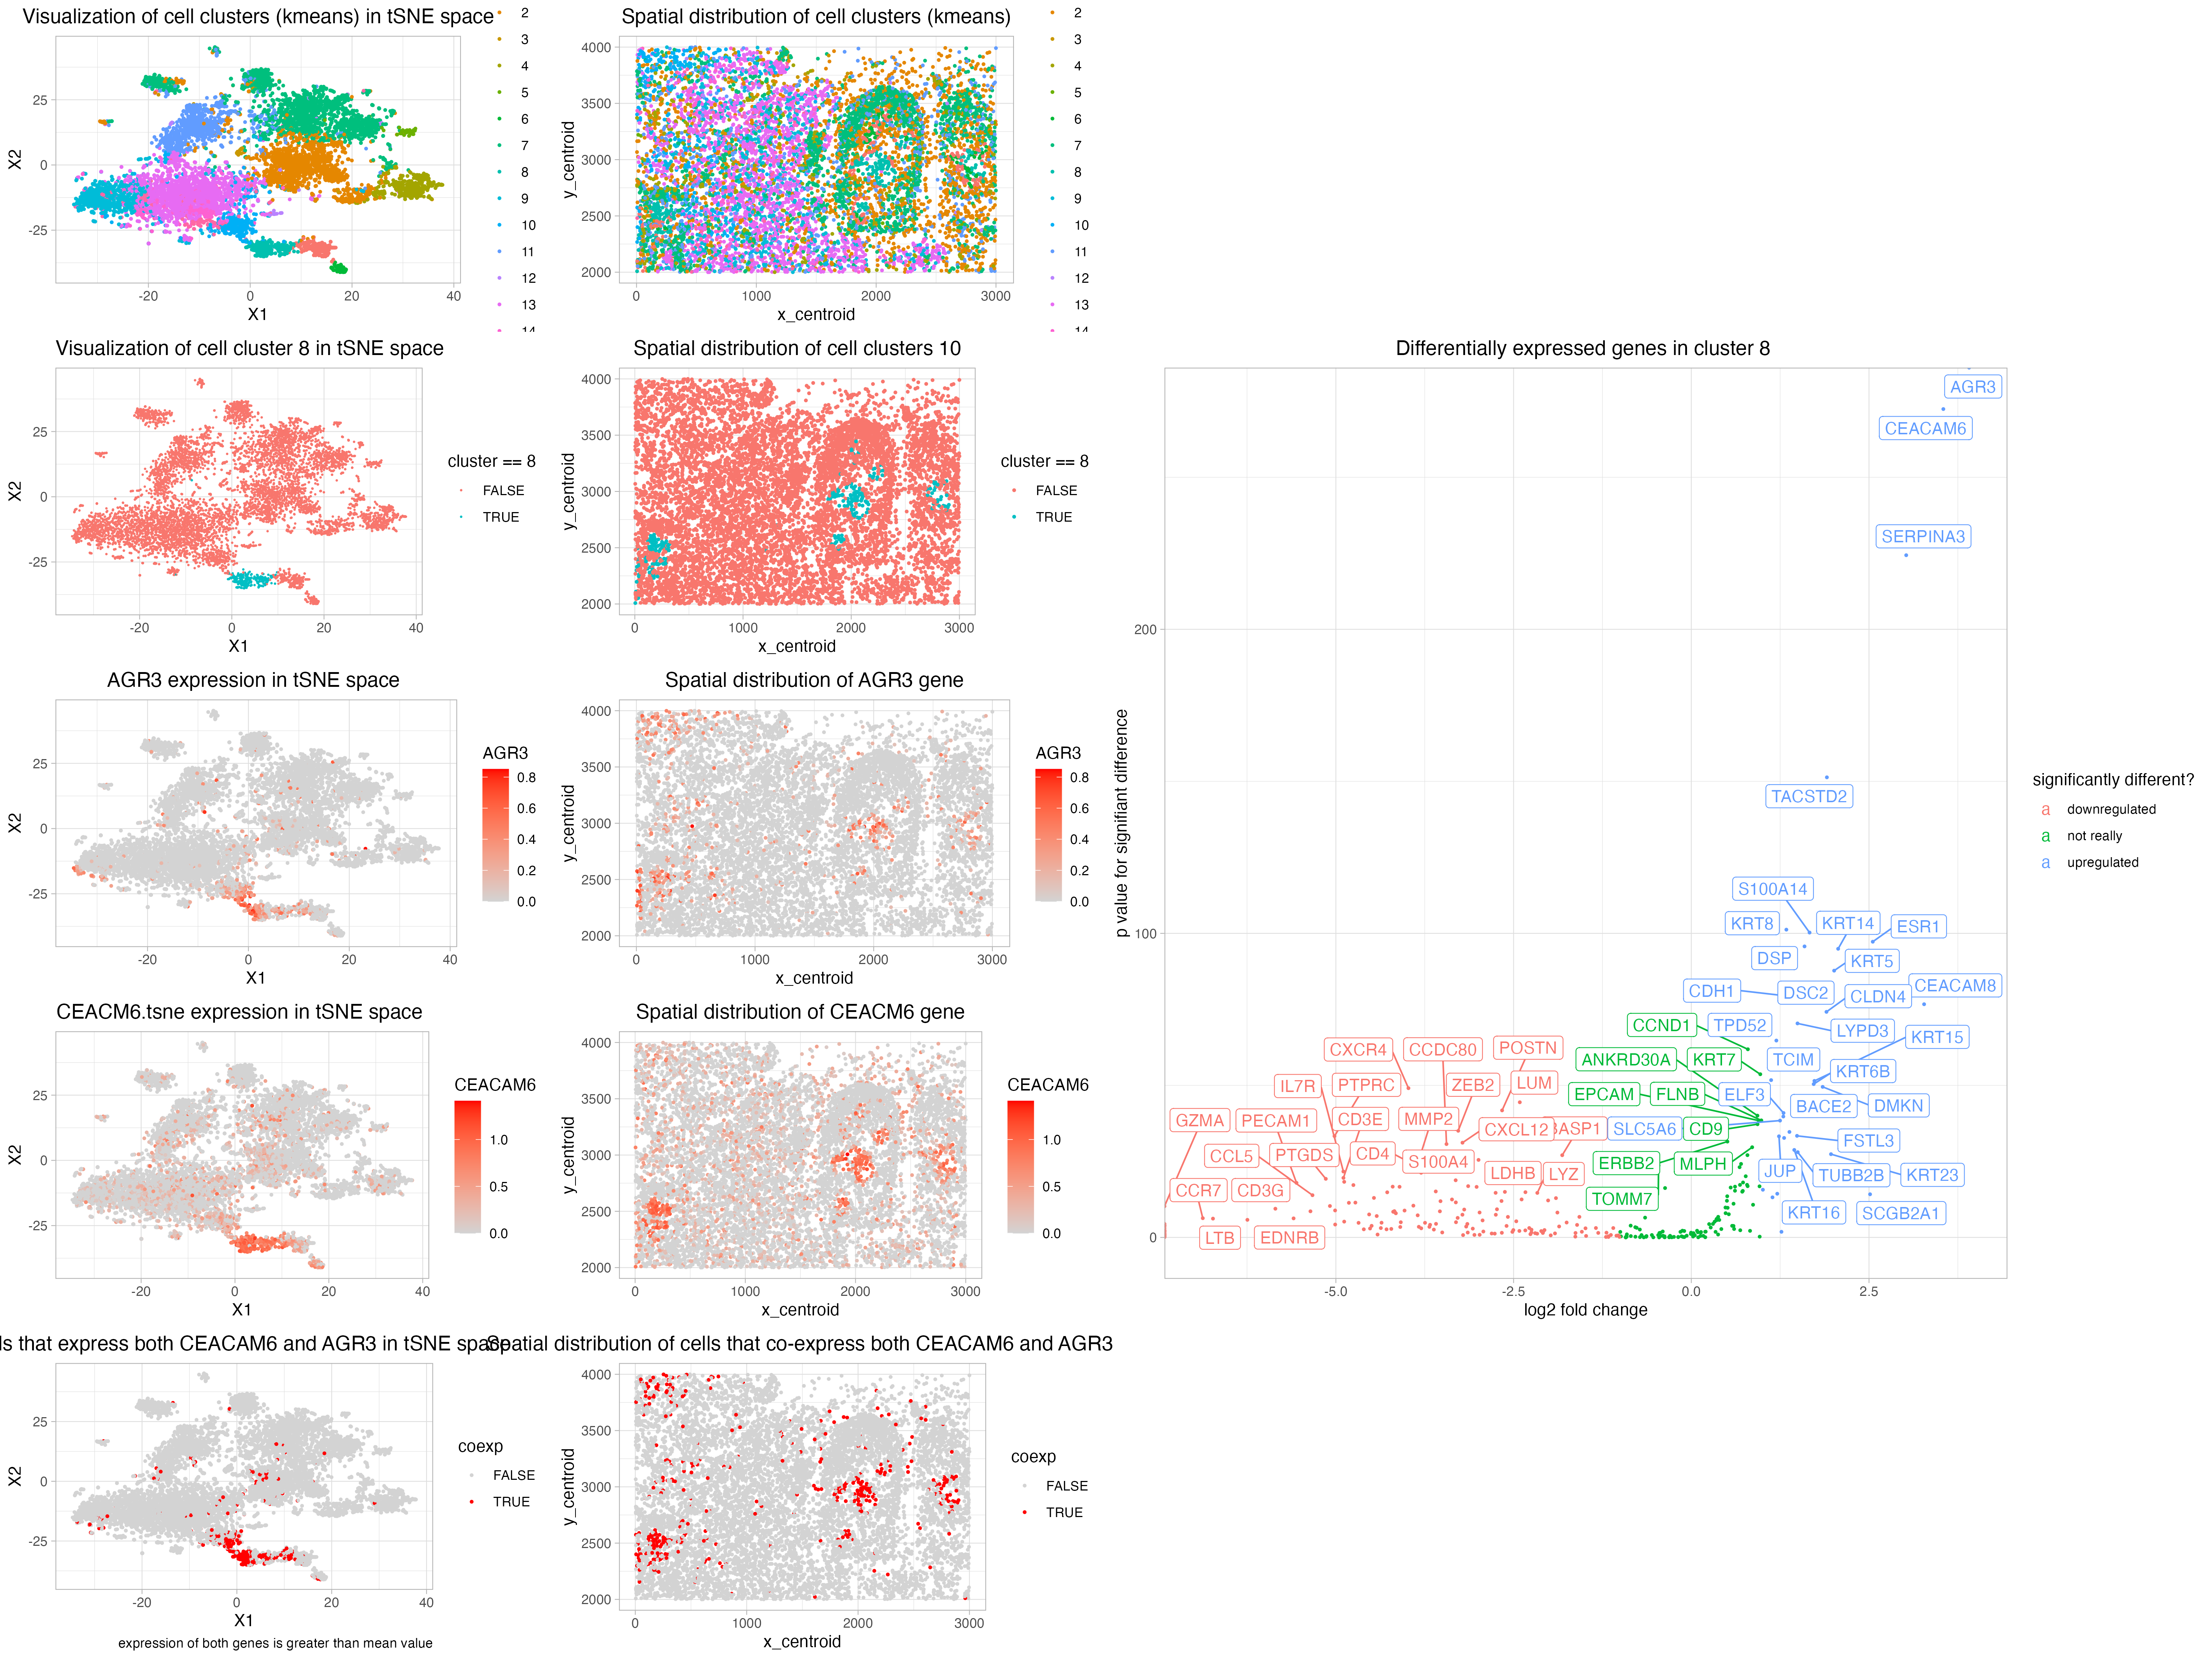
The visualization presented above comprises six panels, all of which provide evidence to support the hypothesis that cluster 8 corresponds to breast cancer cells. The top row panels are referred...
Looking at the cluster I found that the MUCL1 gene was heavily upregulated in the cluster. Looking at ProteinAtlas (https://www.proteinatlas.org/ENSG00000172551-MUCL1) this gene is heavily expressed in mammary glands. Considering the...
Given the differential gene expression analysis, the cell type equivalent to cluster 1 in the data file is most likely a macrophage. Having identified the overexpressed genes in this cluster...
The raw gene expression data set was normalized by dividing each gene of each cell by the total number of genes for that cell. This amount is then multiplied by...
Description of my multi-panel plot Here, I identified a cluster that seems to include T cells, macrophages, and other immune cells in the Visium breast cancer data. In order to...
I used kmeans clustering to identify different cell types by looking at clusters in my data. I preproceessed my data by normalizing by total gene count and putting everything on...
Similar to HW5, I performed kmeans clustering on my normalized dataset. I then went through each of the clusters in spatial representation as well as PC dimensional representation to understand...
The cluster I selected (Cluster 2) corresponds to breast cancer tumor cells. According to my differential expression analysis, the up-regulated DE genes include MAL2, TPD52, and DHCR24. Those are well-known...
The purpose of this visualization to present the usage of differential gene expression to validate cell type identification in k-means and tsne analysis of the dataset. The quantitative data of...
What cell type is the cluster you picked and what went in to your determination? I have identified cell cluster 5 as being Natural Killer cells due the differential expression...
Cell-type annotation After reading, cleaning and normalizing the data, I performed kmeans clustering and observed that cluster 2 presented an interesting pattern in space. The most significant proteins (low p-value...
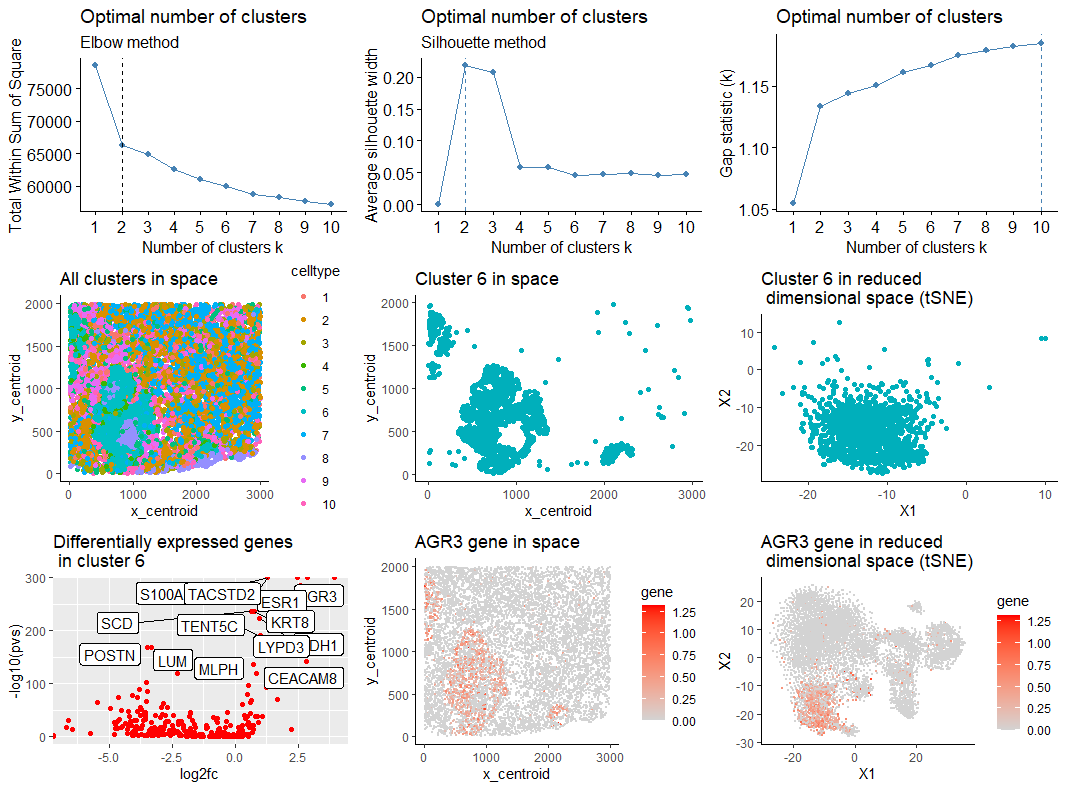
Comparing the gene expressions between clusters revealed that cluster 6 had a higher expression value for Podoplanin. To determine the optimal cluster, the highest gene expression value for a specific...
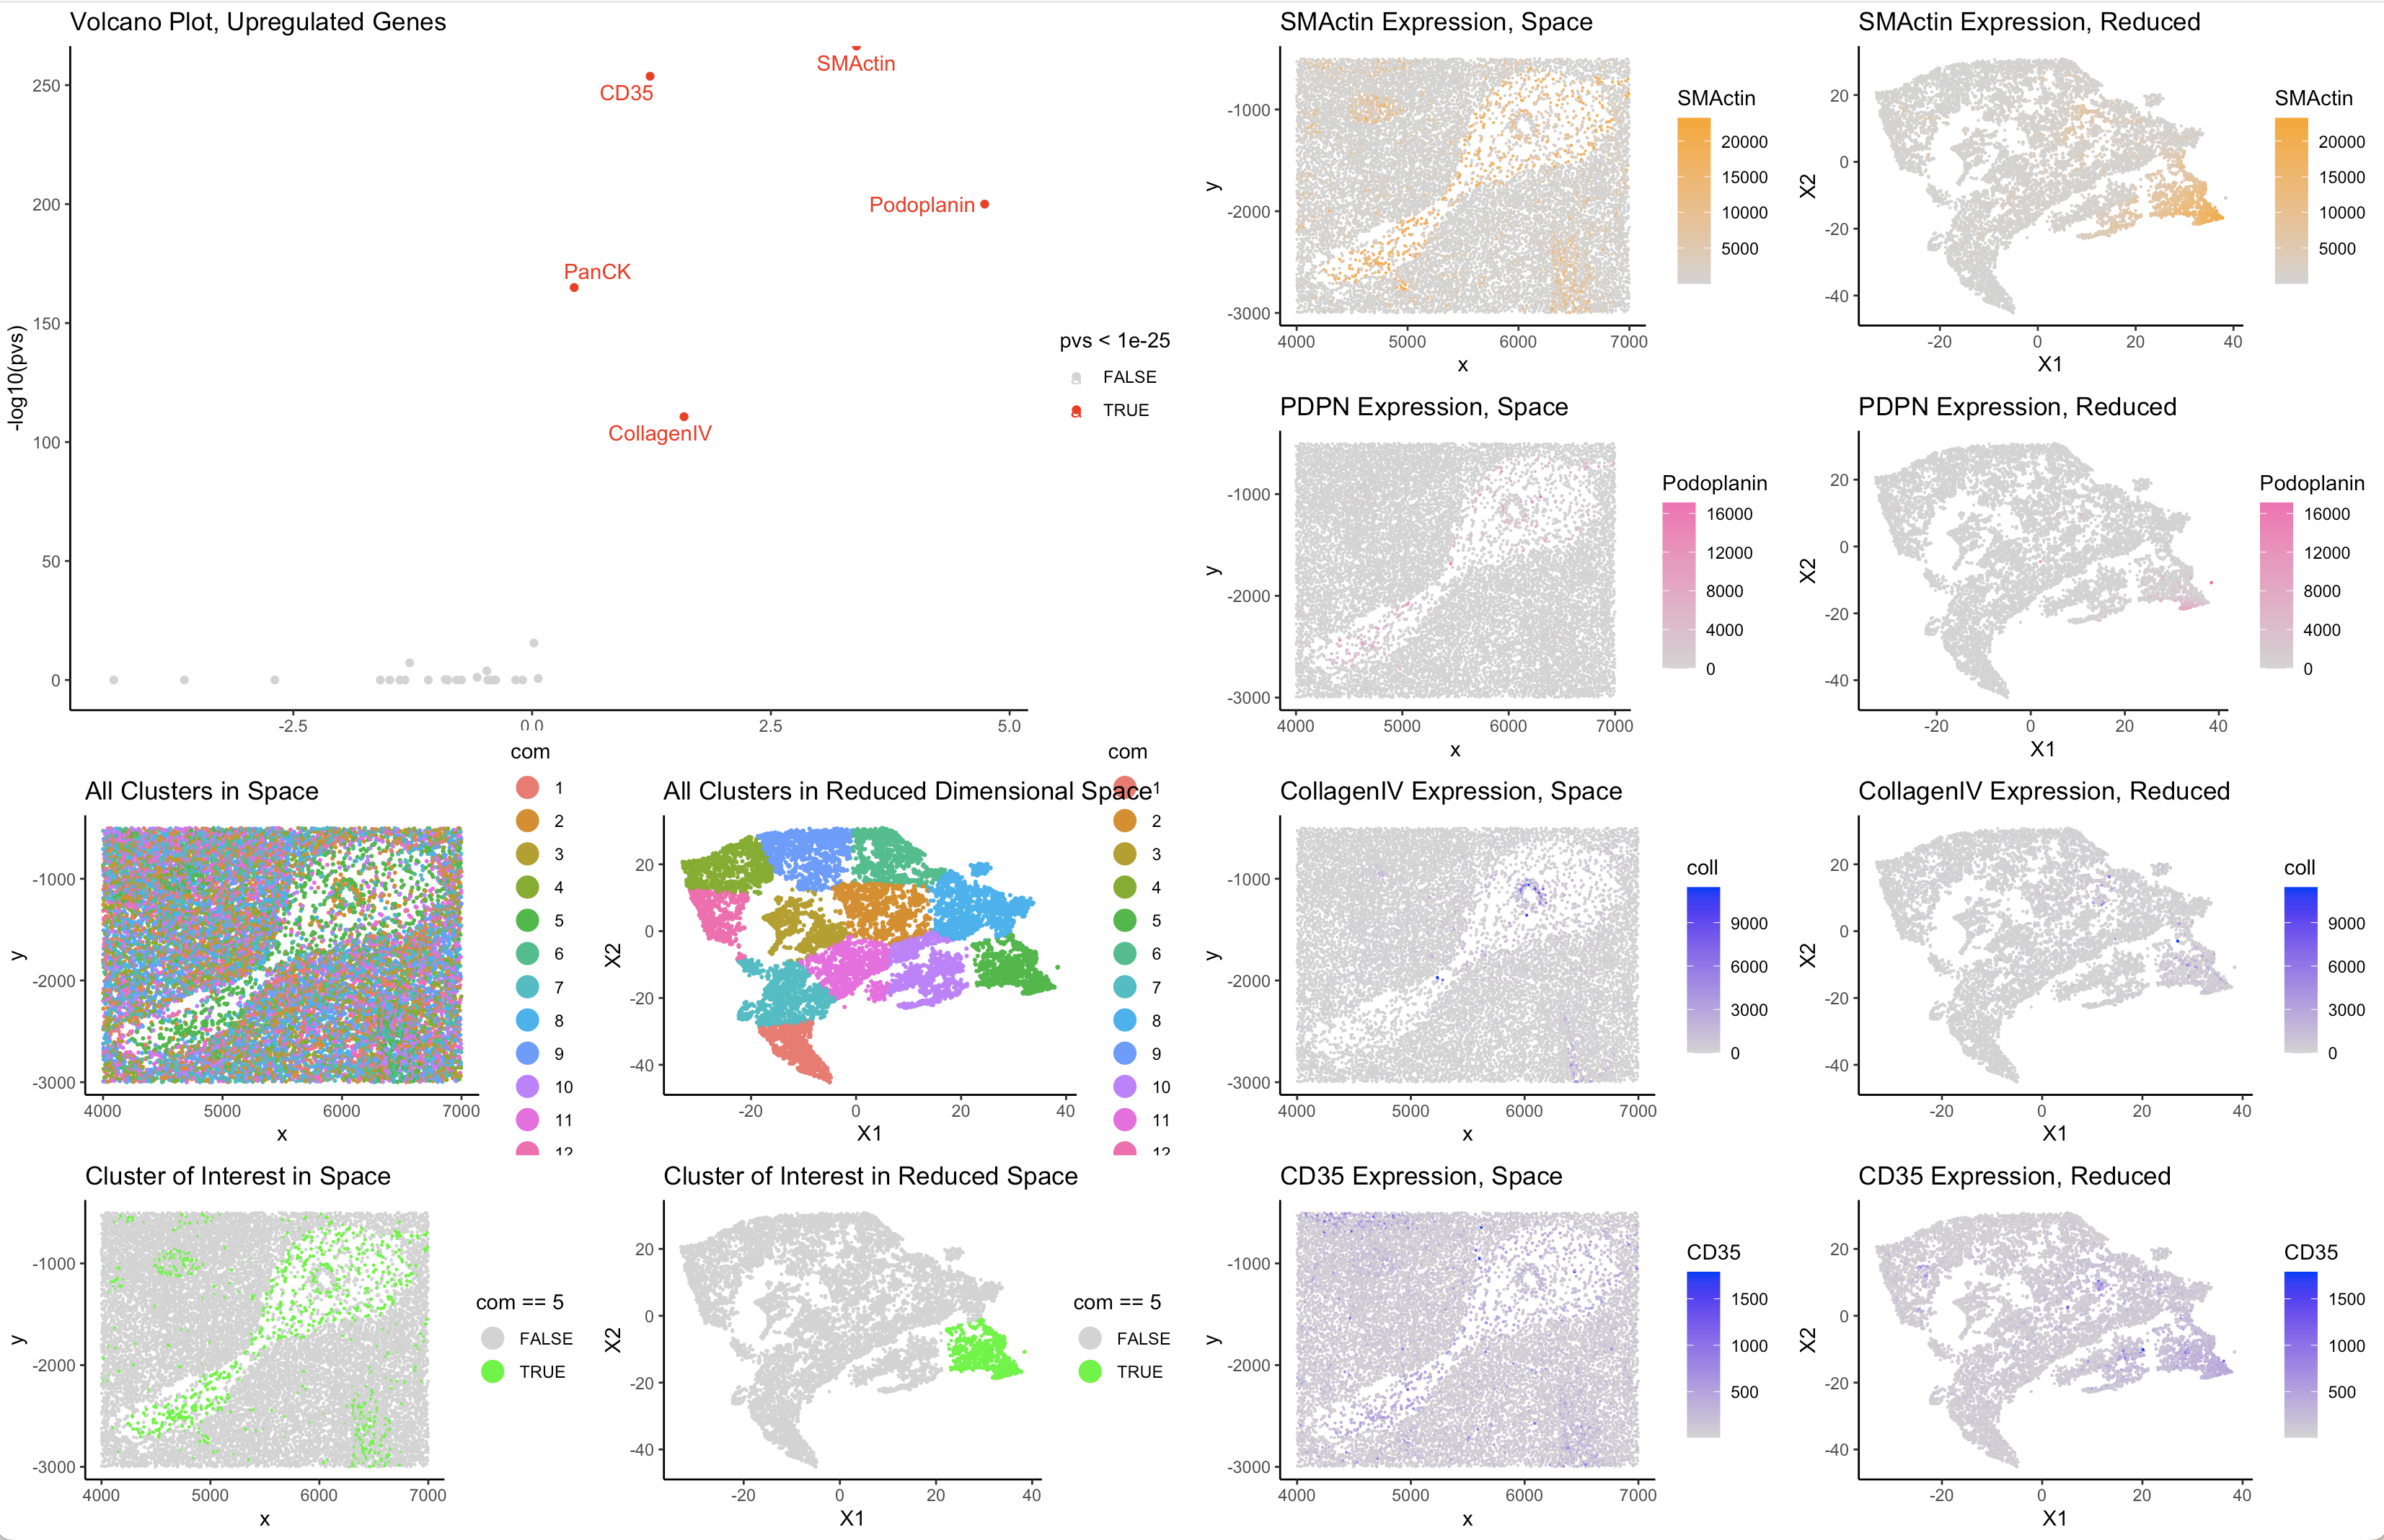
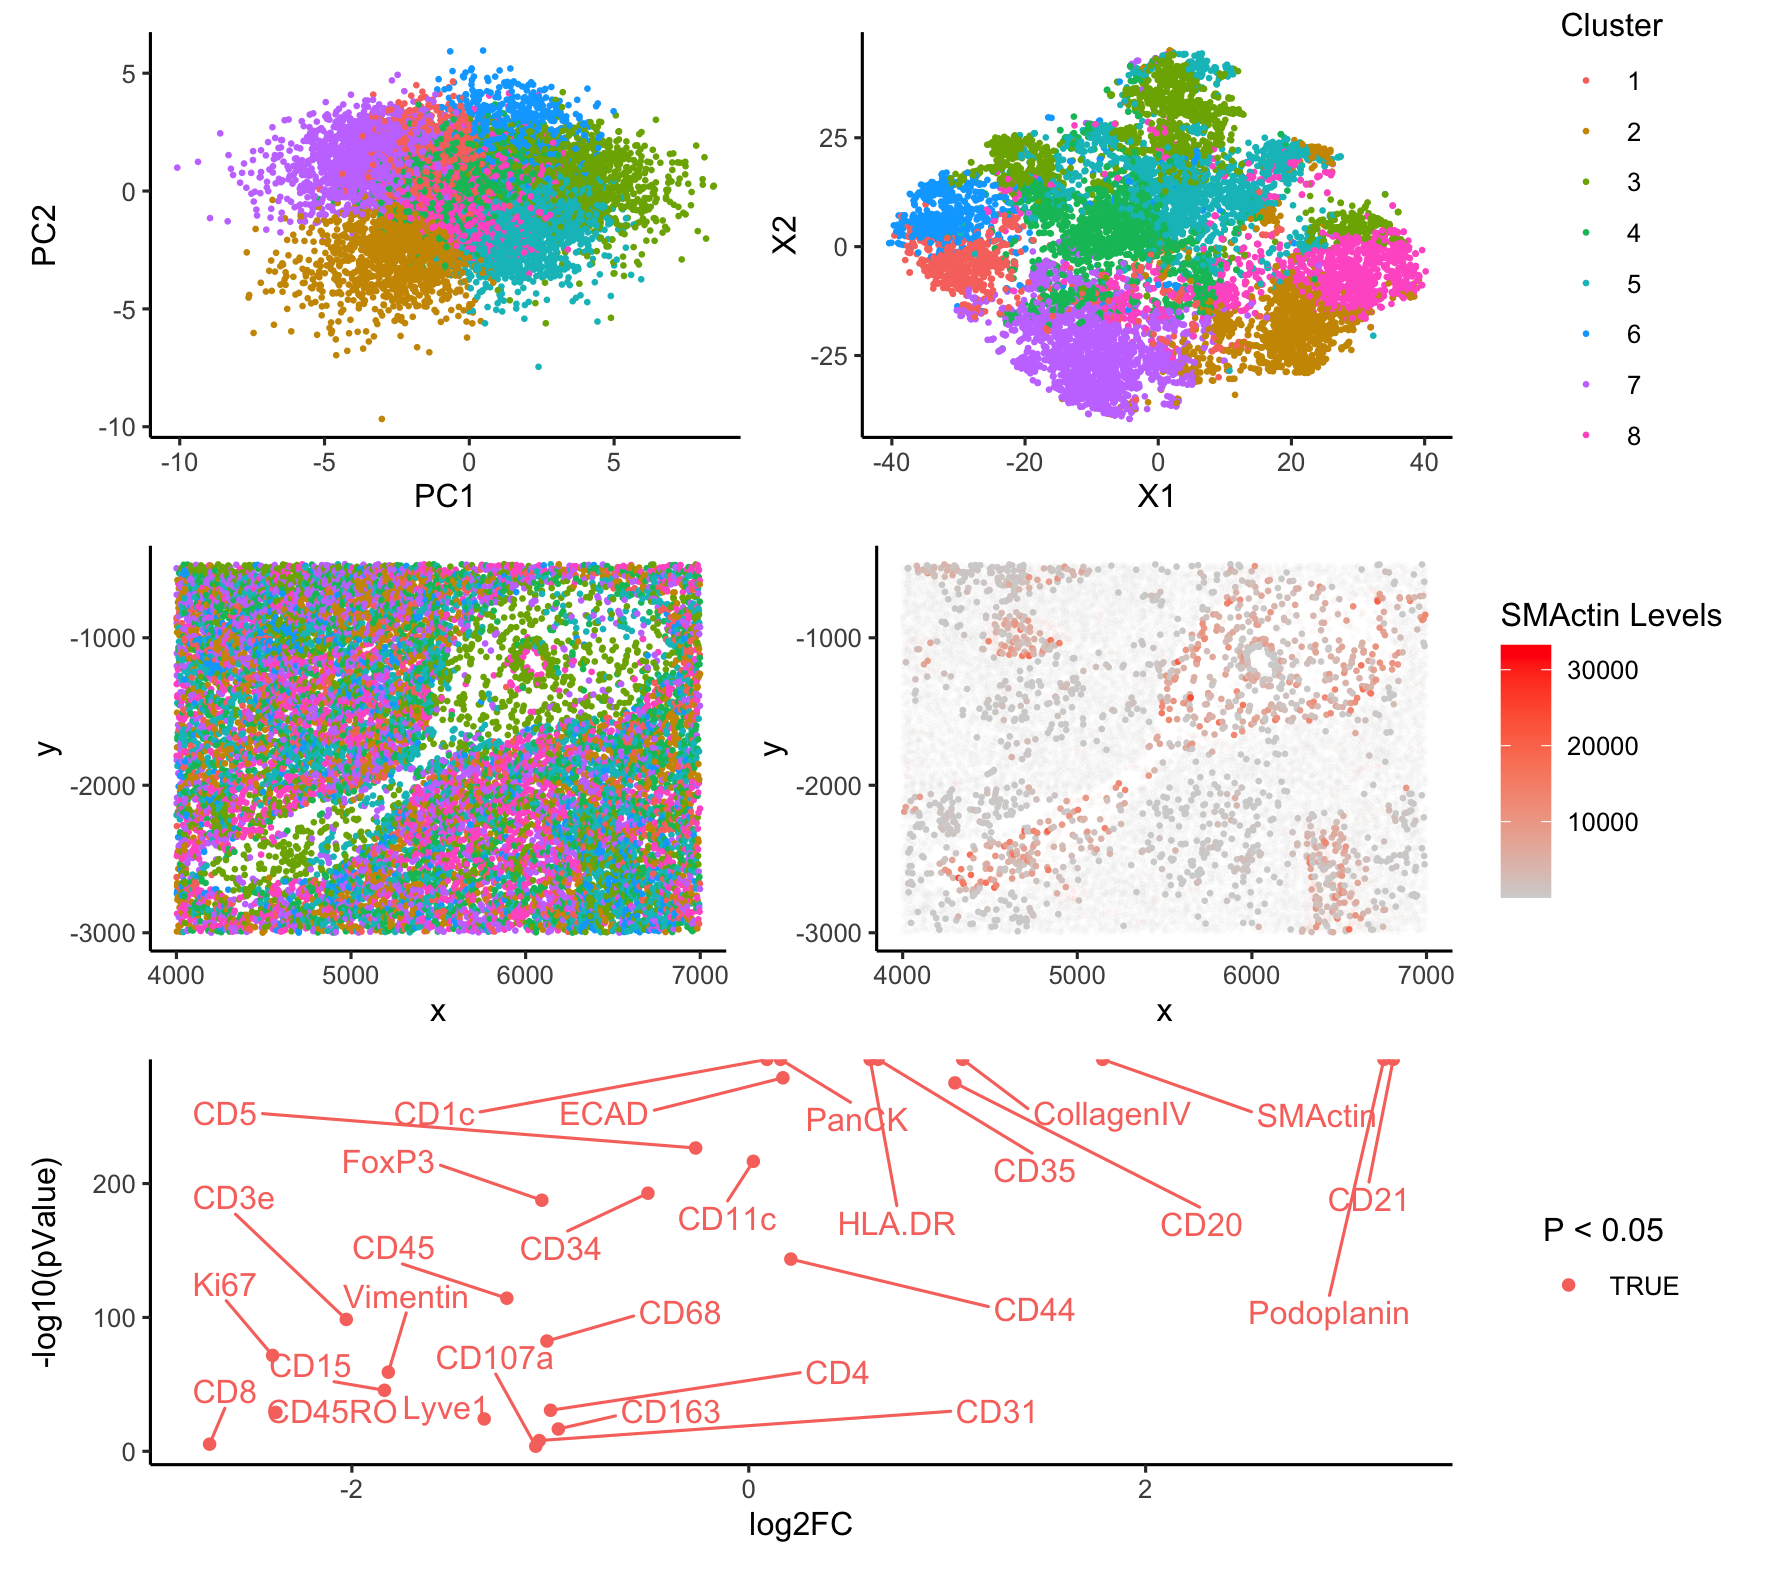
I suspect that cluster 3 represents follciular dendritic cells (FDCs). A number of proteins are significantly upregulated in cluster 3, including SMActin, Podoplanin, and CD21/CD35. SMActin is found in a...