Identification of HER2+ Breast Cancer Cells

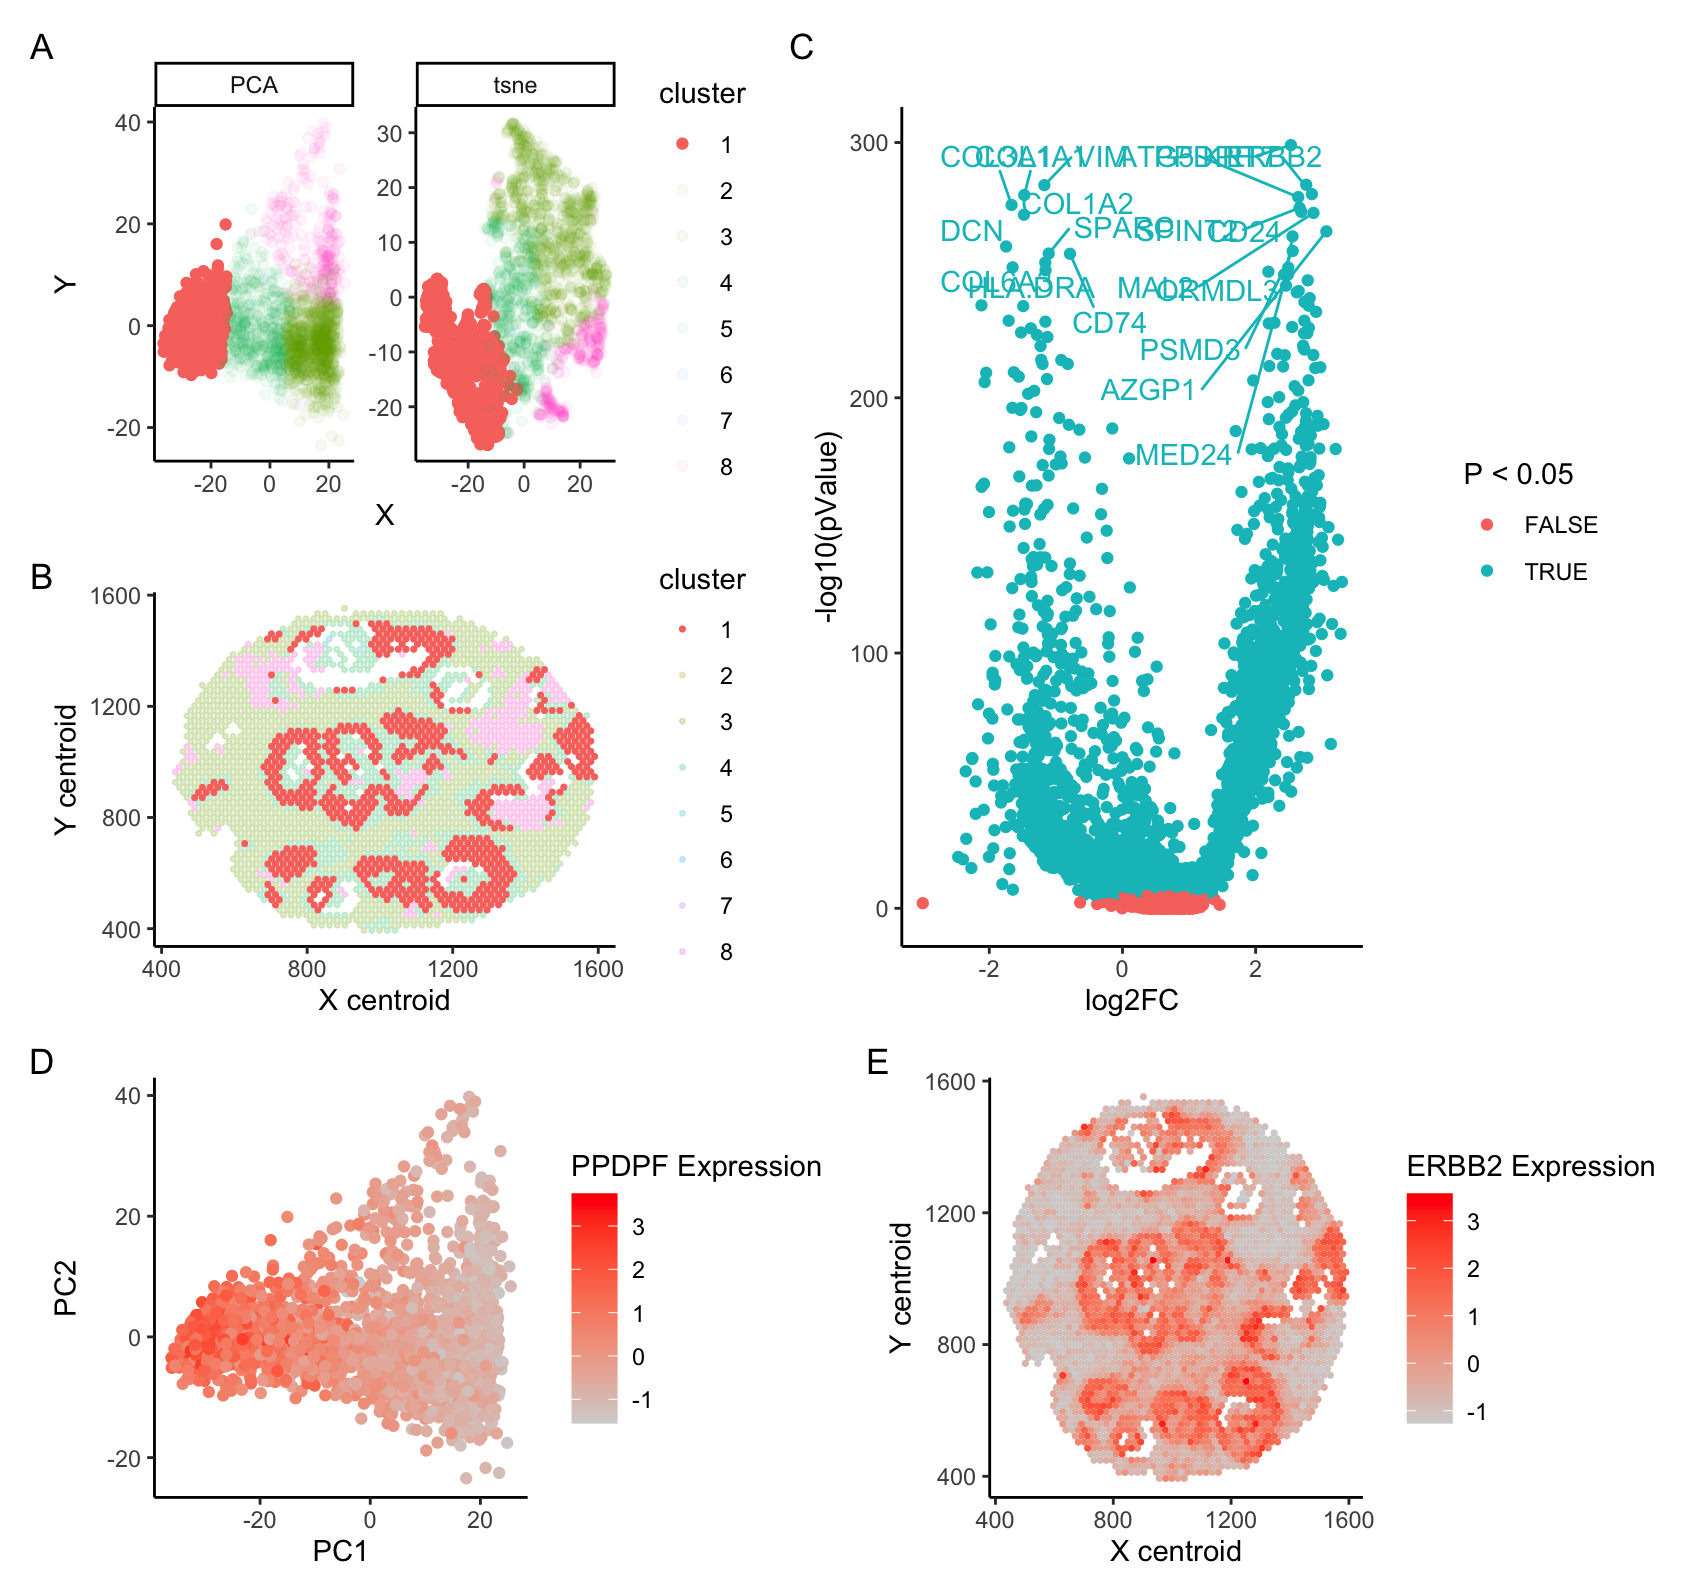
A. PCA and tSNE projection of spatial transcriptomics data. B. Cell cluster overlayed on spatial plot of cell patches. C. DE analysis of Cell Cluster 1 against all others; 20 top hits labeled. D. PCA colored by expression of PPDPF, a growth factor and oncogene (Yun et al 2022, Mao et al 2019) E. Spatial plots colored by expression of ERBB2, an oncogene encoding the HER2 protein (Yu et al 2000)
I have investigated the identity of cell type cluster 1, and suspect that these cells represent HER2+ breast cancer cells. PCA analysis indicates that cluster 1 cells are strongly separated from other cell types across PC1 (A), and DE analysis indicates that even when controlling for multiple testing, most genes are differentially expressed between cluster 1 and surrounding clusters.
Analysis of the top differentially expressed genes indicates that a number of cancer-associated genes are upregulated in cluster 1 cells. I have in particular chosen to highlight two such genes. PPDPF is a growth factor associated with a broad range of cancers, and is commonly associated with more aggressive tumor growth and metastasis. ERBB2 is an oncogene encoding HER2, a protein whose overexpression is commmonly associated with breast cancer.
Code:
library(ggplot2)
library(Rtsne)
library(ggrepel)
library(tidyverse)
library(patchwork)

data <- read.csv('~/genomic_data_viz/visium_breast_cancer.csv.gz', row.names=1)
pos <- data[,1:2]
gexp <- data[,3:ncol(data)]

## normalize
mat <- gexp/rowSums(gexp)
mat <- mat*mean(rowSums(gexp))

a <- apply(mat, 2, var)
hist(a)
# We should scale

#mat <- log10(mat + 1)
mat  <- data.frame(scale(mat))

set.seed(0)
pcs <- prcomp(mat)

within_ss_list <- c()
for (i in 1:15){
  set.seed(0)
  k <- kmeans(mat, centers=i)
  within_ss_list <- c(within_ss_list, k$tot.withinss)
}

pltDF <- data.frame(k = 1:15, withinSS <- within_ss_list)
ggplot(pltDF, aes(x = k, y = within_ss_list)) +
  geom_point() +
  theme_classic() +
  scale_x_continuous(breaks=seq(1,15,1),labels=seq(1,15,1))

set.seed(0)
k <- kmeans(mat, centers=8)

set.seed(0)
emb <- Rtsne(mat)

pc_plot <- data.frame(pcs$x[, c("PC1", "PC2")], cluster = as.factor(k$cluster), cluster_method = "PCA")
emb_plot <- data.frame(emb$Y, cluster = as.factor(k$cluster), cluster_method = "tsne")
colnames(pc_plot) <- colnames(emb_plot) <- c("X", "Y", "cluster", "cluster_method")
total_pot <- rbind(pc_plot, emb_plot)

pca_tsne_plot <- ggplot(total_pot, aes(x=X, y=Y, color = cluster, alpha = cluster)) +
  facet_wrap("cluster_method", scale="free") +
  geom_point() +
  theme_classic() +
  scale_alpha_manual(values = c(1, rep(0.05, times = 7)))

eigs <- pcs$sdev^2
eigs[1] / sum(eigs)
eigs[2] / sum(eigs)


# testing
cluster.cells <-  which(k$cluster == 1)
other.cells <- which(k$cluster != 1)

ggplot(total_pot[total_pot$cluster_method=='PCA', ], aes(x=X, y=Y, color = cluster)) +
  scale_color_manual(values = c("1" = "red")) +
  geom_point() +
  theme_classic()

ggplot(total_pot[total_pot$cluster_method=='PCA', ], aes(x=X, y=Y, color = rowSums(gexp))) +
  geom_point() +
  theme_classic()

# First, comparing clusters 1+8 against all else
up <- sapply(colnames(mat), function(g){
  wilcox.test(mat[cluster.cells, g],
              mat[other.cells, g],
              alternative = 'greater')$p.value

})

up_genes <- names(up)[up < (0.05/ncol(mat))]
head(sort(up), n=40)

diff <- sapply(colnames(mat), function(g){
  wilcox.test(mat[cluster.cells, g],
              mat[other.cells, g],
              alternative = 'two.sided')$p.value
})

diff_names <- names(head(sort(diff), n=20))

fc <- sapply(colnames(gexp), function(g){
  log2(mean(gexp[cluster.cells, g])/mean(gexp[other.cells, g]))
})

df_volcano <- data.frame(log2FC = fc, pValue = diff, comparison = "Group 1 vs All Others")

df_volcano$gname <- rownames(df_volcano)

volcano_plot <- ggplot(df_volcano, aes(x = log2FC, y = -log10(pValue), color = pValue < (0.05/ncol(mat)))) +
  geom_point() +
  theme_classic() +
  labs(color='P < 0.05') +
  geom_text_repel(data = df_volcano %>%
                    mutate(label = ifelse(gname %in% diff_names,
                                          gname, "")),
                  aes(label = label),
                  box.padding = 1,
                  show.legend = FALSE,
                  max.overlaps = Inf)


# Plotting in space
df <- data.frame(pos, cluster = factor(k$cluster))

space_plot <- ggplot(data = df,  aes(x = V6, y = V5, color = cluster, alpha = cluster)) +
  geom_point(size = 0.6) +
  theme_classic() +
  xlab('X centroid') +
  ylab('Y centroid') +
  scale_alpha_manual(values = c(1, rep(0.2, times = 7)))

PPDPF_PCA <- ggplot(total_pot[total_pot$cluster_method=='PCA', ], aes(x=X, y=Y, color = mat$PPDPF)) +
  scale_color_gradient(low = 'lightgrey', high='red') +
  labs(color='PPDPF Expression') +
  geom_point() +
  xlab('PC1') +
  ylab('PC2') +
  theme_classic()

ERBB2_space <- ggplot(data = df,  aes(x = V6, y = V5, color = mat$ERBB2)) +
  geom_point(size = 0.6) +
  scale_color_gradient(low = 'lightgrey', high='red') +
  labs(color='ERBB2 Expression') +
  theme_classic() +
  xlab('X centroid') +
  ylab('Y centroid')

((pca_tsne_plot / space_plot) | volcano_plot) / (PPDPF_PCA + ERBB2_space) +
  plot_annotation(tag_levels = 'A') +
  plot_layout(heights = c(2, 1))
Citations:
Yun M, Yingzi L, Jie G, Guanxin L, Zimei Z, Zhen C, Zhi L, Yingjie N, Lunquan S, Tao C, Yuezhen D, Chengzhi Z. PPDPF Promotes the Progression and acts as an Antiapoptotic Protein in Non-Small Cell Lung Cancer. Int J Biol Sci. 2022 Jan 1;18(1):214-228. doi: 10.7150/ijbs.65654. PMID: 34975328; PMCID: PMC8692159.
| Mao, Zhengfa MDa,∗; Li, Xi BSb; Ma, Xiaoyan MDc; Wang, Xuqing MDa; Zhang, Jiangxin MDa; Fan, Xin MDa,∗. Pancreatic progenitor cell differentiation and proliferation factor predicts poor prognosis in heptaocellular carcinoma. Medicine 98(9):p e14552, March 2019. | DOI: 10.1097/MD.0000000000014552 |
Yu, D., Hung, MC. Overexpression of ErbB2 in cancer and ErbB2-targeting strategies. Oncogene 19, 6115–6121 (2000). https://doi.org/10.1038/sj.onc.1203972