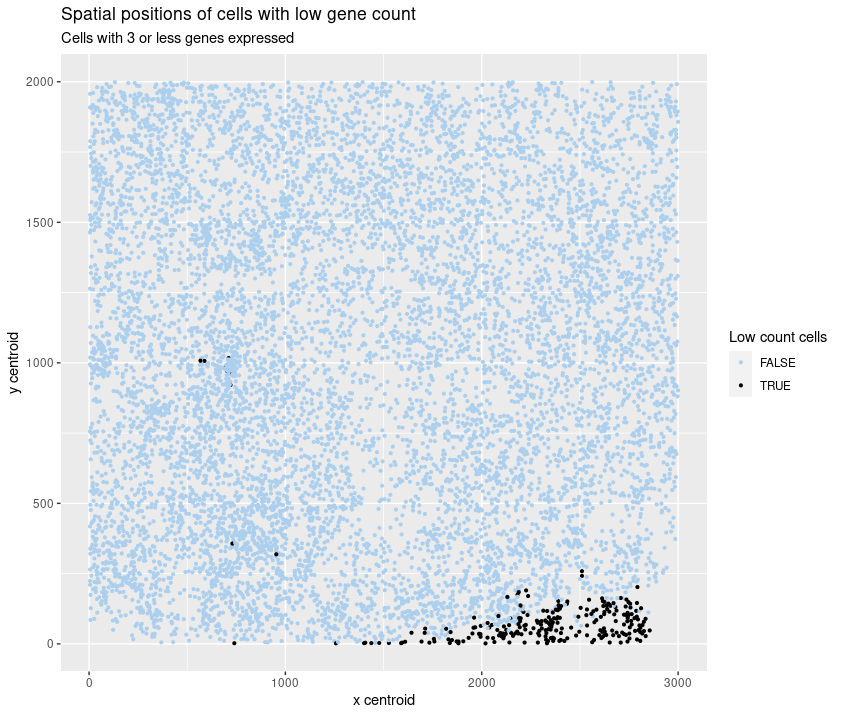
Spatial position of cells with low gene count

What data types are you visualizing?
I am visualizing the categorical data of the presence of 3 or fewer genes in a cell together with the spatial data of the (x, y) coordinates of these same cells.
What data encodings are you using to visualize these data types?
I am using the geometric primitive of a point to represent the cells. To encode the categorical data (low gene count), I am using the visual channel of color. To encode the spatial data (coordinates), I am using the visual channel of position.
What type of data visualization is this? What about the data are you trying to make salient through this data visualization?
My visualization tries to identify if there is a specific region of the tissue where the cells expressed fewer genes.
What Gestalt principles or knowledge about perceptiveness of visual encodings are you using to accomplish this?
I am using the Gestalt principle of similarity and proximity to represent the low gene count cells as a group. The gestalt principle of proximity was also used to put the legends on the side.
Code
data <- read.csv('data/pikachu.csv.gz')

metadata <- data[, 1:4]
gexp <- data[5:ncol(data)]

library(tidyverse)

metadata %>%
    mutate(count = rowSums(gexp)) %>%
    mutate(low_count_cells = ((count <= 3))) %>%
    ggplot() +
    geom_point(aes(x=x_centroid, y=y_centroid, color=low_count_cells),
               size=.8) +
    scale_color_manual(values=c("#ABCFED", "#000000")) +
    labs(title = "Spatial position of cells with low gene count",
         subtitle = "Cells with 3 or less genes expressed",
         x = "x centroid", y = "y centroid",
         color = "Low count cells")