Exploring the Cell Types of Breast Cancer Visium Data

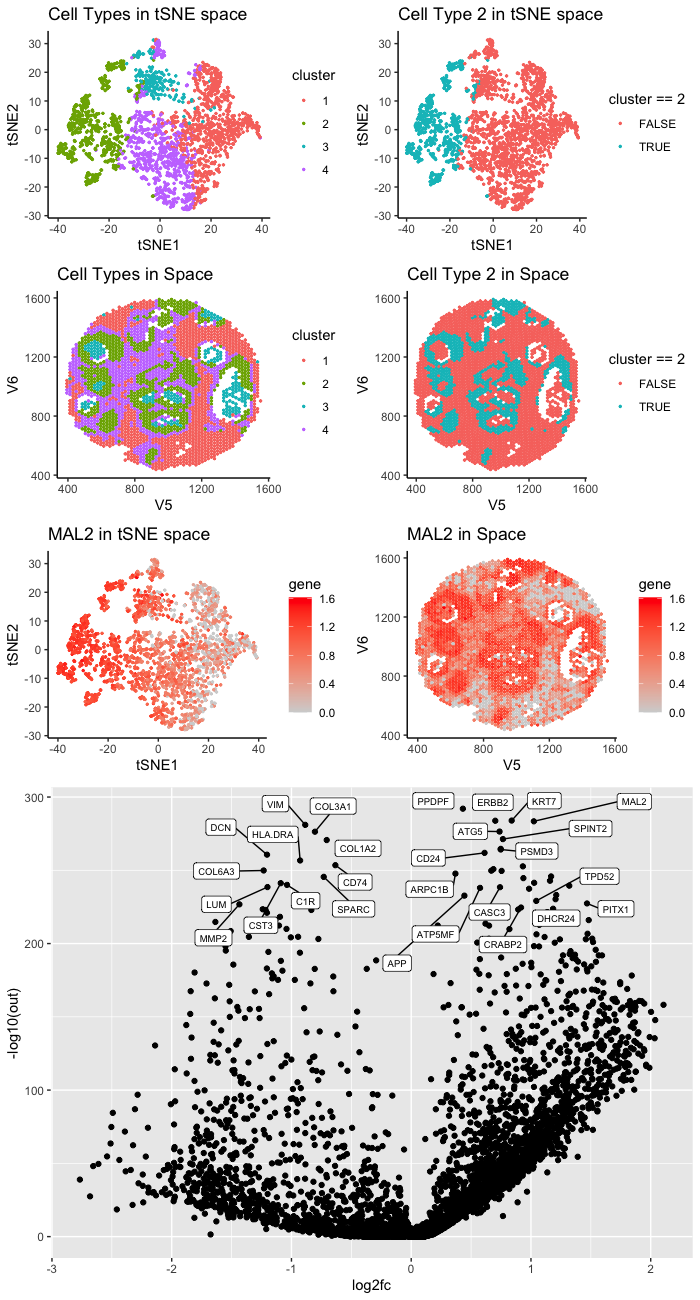
The cluster I selected (Cluster 2) corresponds to breast cancer tumor cells. According to my differential expression analysis, the up-regulated DE genes include MAL2, TPD52, and DHCR24. Those are well-known breast cancer marker genes.
-
According to Bhandari et al. [1], MAL2 are overexpressed in breast cancer tumor tissue. They showed that knocking down MAL2 can reduce the ability of the breast cancer cell lines to proliferate and migrate.
-
TPD52 is known as a breast cancer oncogene. According to Ren et al. [2], TPD52 is upregulated in breast cancer cell lines, and it promotes the growth and migration of breast cancer cell.
-
According to Qiu et al., DHCR24 enhances the proliferation of breast cancer stem-like cells via the Hedgehog pathway. They found that the overexpression of DHCR24 is frequent in lunimal and HER2 positive breast cancer.
1
2
3
4
5
6
7
8
9
10
11
12
13
14
15
16
17
18
19
20
21
22
23
24
25
26
27
28
29
30
31
32
33
34
35
36
37
38
39
40
41
42
43
44
45
46
47
48
49
50
51
52
53
data = read.csv("visium_breast_cancer.csv.gz",row.names = 1)
pos = data[,1:2]
gexp= data[,3:ncol(data)]
##QC
hist(log10(colSums(gexp) + 1),breaks = 100)
good.genes = colnames(gexp)[log10(colSums(gexp)+1)<=5.25]
hist(log10(rowSums(gexp) + 1))
good.cells = rownames(gexp)[log10(rowSums(gexp)+1)>=3]
pos = pos[good.cells,]
gexp = gexp[good.cells,good.genes]
##normalize
mat = gexp / rowSums(gexp)
mat = mat * mean(rowSums(gexp))
mat = log10(mat + 1)
##tSNE dimension reduction
emb = Rtsne::Rtsne(mat)
##Kmeans clustering
wss <- sapply(1:10,
              function(k){kmeans(mat, k)$tot.withinss})
plot(wss,type = "l")
com = kmeans(mat,center  = 4)
df = data.frame(pos,emb$Y,cluster = as.factor(com$cluster))
p_cluster = ggplot(df, aes(x = X1, y = X2,col = cluster)) + geom_point(size = 0.5) +theme_classic() +labs(x="tSNE1",y = "tSNE2")+ggtitle("Cell Types in tSNE space")
p_cluster_s = ggplot(df, aes(x = V5, y = V6,col = cluster)) + geom_point(size = 0.5) +theme_classic() + ggtitle("Cell Types in Space")
p_cluster_2 = ggplot(df, aes(x = X1, y = X2,col = cluster == 2)) + geom_point(size = 0.5) +theme_classic() +labs(x="tSNE1",y = "tSNE2")+ggtitle("Cell Type 2 in tSNE space")
p_cluster_s2 = ggplot(df, aes(x = V5, y = V6,col = cluster==2)) + geom_point(size = 0.5) +theme_classic() + ggtitle("Cell Type 2 in Space")
cluster.of.interest = names(which(com$cluster == 2))
cluster.other  =  names(which(com$cluster != 2))
out = sapply(colnames(mat), function(g){
  wilcox.test(mat[cluster.of.interest, g],mat[cluster.other, g],alternative="two.sided")$p.value
})

log2fc <- sapply(colnames(mat), function(g) {
  a <- mat[cluster.of.interest, g]
  b <- mat[cluster.other, g]
  log2(mean(a)/mean(b))
})


## volcano plot
df = data.frame(out, log2fc)
df_subset = df[names(head(sort(out), n=40)),]
volcano = ggplot(df, aes(y=-log10(out) , x=log2fc)) + geom_point()  +ggrepel::geom_label_repel(data = df_subset, aes(x=log2fc,y=-log10(out),label = rownames(df_subset)),size = 2.5,force = 50)

g <- 'MAL2'
df <- data.frame(pos, emb$Y, gene=mat[,g])
p_MAL2_s = ggplot(df, aes(x = V5, y = V6, col=gene)) +
  geom_point(size = 0.5) + theme_classic() + scale_color_continuous(low='lightgrey', high='red') + ggtitle("MAL2 in Space")
p_MAL2= ggplot(df, aes(x = X1, y = X2, col=gene)) + geom_point(size = 0.5) +
  theme_classic() + scale_color_continuous(low='lightgrey', high='red') +labs(x="tSNE1",y = "tSNE2")+ggtitle("MAL2 in tSNE space")

library(gridExtra)
grid.arrange(p_cluster,p_cluster_2,p_cluster_s,p_cluster_s2,p_MAL2,p_MAL2_s,volcano,layout_matrix = rbind(c(1,2), c(3,4),c(5,6),c(7,7),c(7,7)))
Reference
[1] Bhandari, Adheesh, et al. “MAL2 promotes proliferation, migration, and invasion through regulating epithelial-mesenchymal transition in breast cancer cell lines.” Biochemical and biophysical research communications 504.2 (2018): 434-439.
[2] Ren, Jing, et al. “Tumor protein D52 promotes breast cancer proliferation and migration via the long non-coding RNA NEAT1/microRNA-218-5p axis.” Annals of Translational Medicine 9.12 (2021).
[3] Qiu, Ting, et al. “24‐Dehydrocholesterol reductase promotes the growth of breast cancer stem‐like cells through the Hedgehog pathway.” Cancer Science 111.10 (2020): 3653-3664.