Relationship between the centroid mass, area and its occurrences of ZEB1

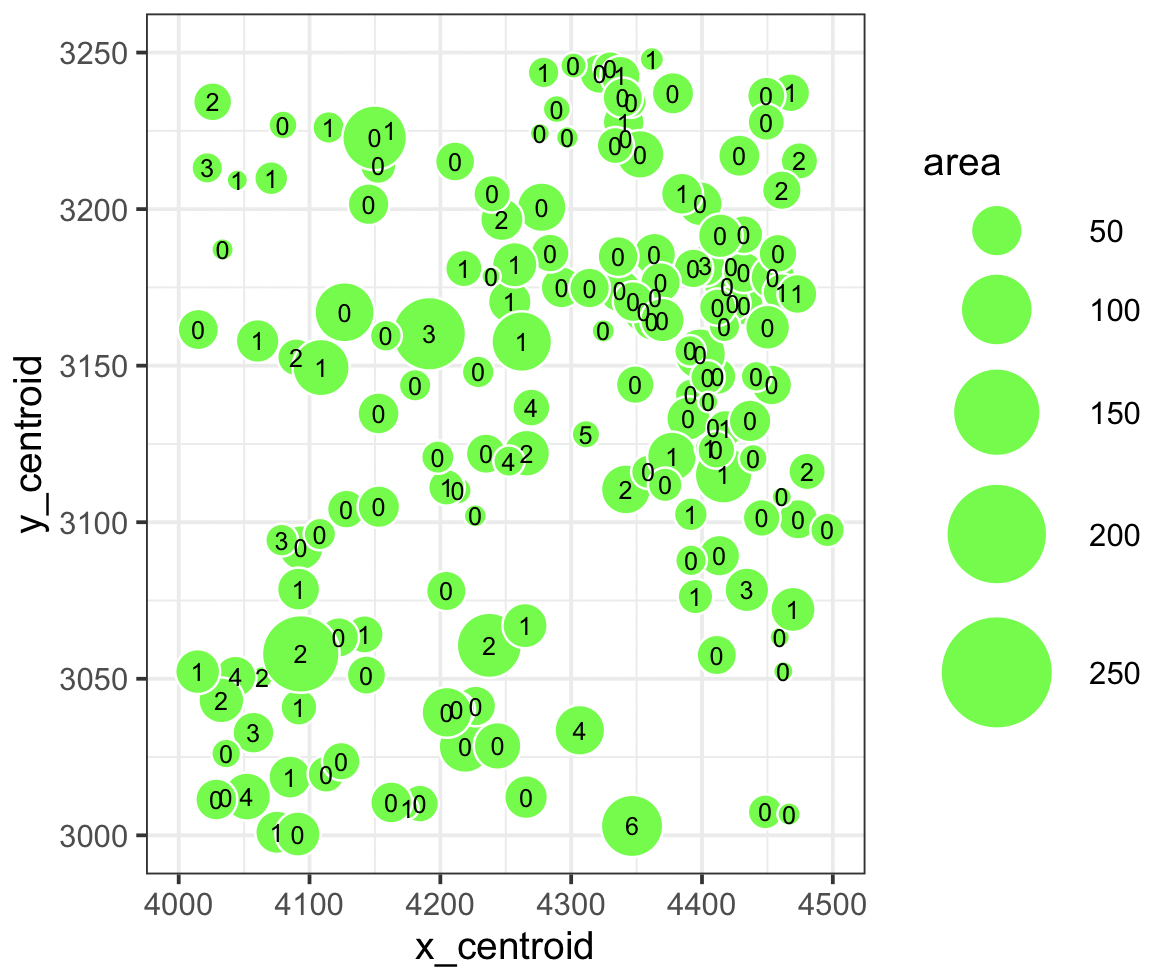
What data types are you visualizing?
It’s visualizing a quantitative data type of how many ZEB1 genes are found in a specific area given the x_centroid (4000-4500) and y_centroid (3000-3250).
What data encodings are you using to visualize these data types?
The geometric primitives points are being used to represent the ZEB1 gene. Using the visual channels of positions along x_centroid and y_centroid and size for the area of the ZEB1 gene.
What type of data visualization is this? What about the data are you trying to make salient through this data visualization?
This is an explanatory data visualization to make more salient the relationship between the area, center of mass position, and how many times it occurs for gene ZEB1.
What Gestalt principles or knowledge about perceptiveness of visual encodings are you using to accomplish this?
The gestalt principles being used are similarity and proximity for the areas of ZEB1.
Code
> file <- '~/desktop/data/squirtle.csv.gz'
> data <- read.csv(file, row.names=1)
> ggplot(data=data, aes(x=x_centroid, y=y_centroid, size=area, label=ZEB1),guide=FALSE)+
+  geom_point(color="white", fill="green", shape=21)+ scale_size_area(max_size = 15)+
+       scale_x_continuous(name="x_centroid", limits=c(4000,4500))+
+       scale_y_continuous(name="y_centroid", limits=c(3000,3250))+
+     geom_text(size=2.5)+ theme_bw()