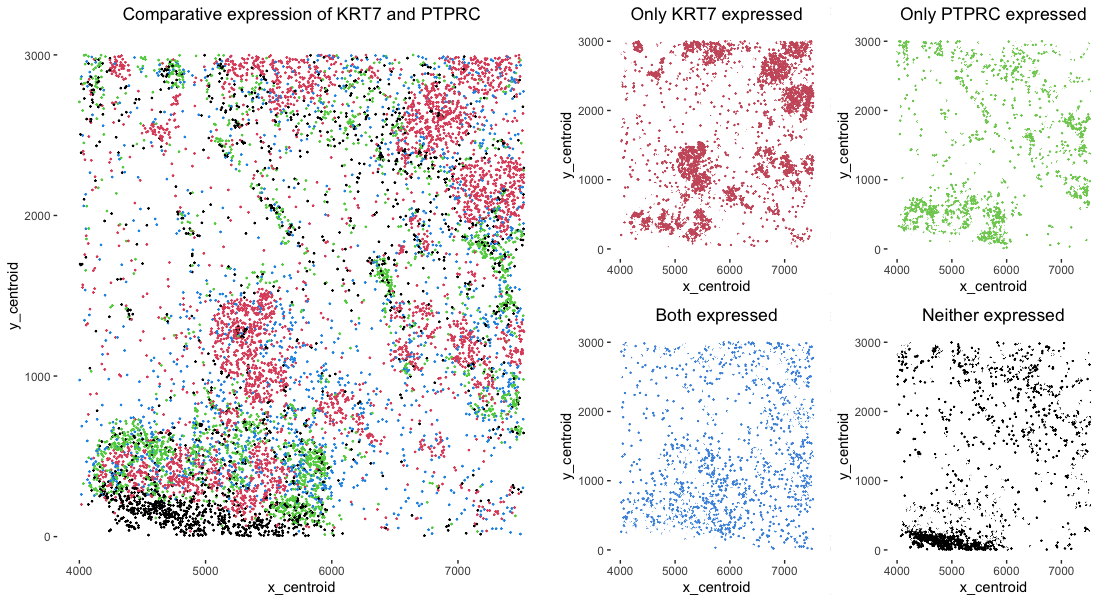
Comparative detection of KRT7 and PTPRC gene expression

What data types are you visualizing?
I am visualizing categorical data of the comparative gene expression detection of two genes KRT7 and PTPRC. There are four possible categories: only KRT7 detected, only PTPRC detected, both detected, and neither detected. I am also visualizing the positional data of each of the cells. (Answer modified from Prof. Fan’s sample answer)
What data encodings are you using to visualize these data types?
I am using the geometric primitive of points to represent each cell. To encode each of the expression detection categories, I am using the visual channel of color. To encode both the x and y positional data I am using the visual channel of position along the respective x and y axis to indicate the location of the cells in the image. (Answer modified from Prof. Fan’s sample answer)
What type of data visualization is this? What about the data are you trying to make salient through this data visualization?
The goal of this visualization was to make salient the different clusters of cell types that are present in the image and visualize any potential structures that exist. I hoped to this by looking at the most negatively correlated genes (KRT7 and PTPRC) and see if similar cell types (based on gene expression) were located in the same location in the image and see how different cell types were positioned around each other.
What Gestalt principles or knowledge about perceptiveness of visual encodings are you using to accomplish this?
I am using the Gesalt princples of proximity and continuity to visualize structures within the image such as clusters located in the middle of the image or layers/tube located in the bottom left of the image.
Code
library(ggplot2)
require(gridExtra) #Used to arrange ggplots

data <- read.csv('Downloads/charmander.csv.gz')

#Probably a better way to do this but assigns a category to each read based on KRT7 and PTPRC detection (no longer boolean but the name stayed)
krt7data <- data['KRT7']
ptprcdata <- data['PTPRC']
bools <- list()
for (i in 1:8486) {
  krt7val = krt7data[i,]
  ptprcval = ptprcdata[i,]
  if (krt7val>0) {
    if (ptprcval==0) {
      bools <- append(bools,2)
    }
    else {
      bools <- append(bools,4)
    }
  }
  else {
    if (ptprcval==0) {
      bools <- append(bools,1)
    }
    else {
      bools <- append(bools,3)
    }
  }
}
data$bool <- bools

#Create five graphs, one for each of the cases (two only expressed graphs, and then both and neither expressed) and then a graph with all channels combined
krt7only <-ggplot(data, aes(x = x_centroid, y = y_centroid,
                             col =(KRT7>0 & PTPRC==0))) + geom_point(size=0.1) +
  scale_color_manual(values=c("white", "#CC5C6B")) + #https://www.datanovia.com/en/lessons/combine-multiple-ggplots-into-a-figure/
  theme(panel.background = element_rect(fill = "white"), legend.position = "none", plot.title=element_text(hjust=0.5)) + #https://r-graph-gallery.com/240-custom-layout-background-ggplot2.html#:~:text=Let's%20start%20with%20a%20very,to%20the%20theme()%20function.
  ggtitle("Only KRT7 expressed")

ptprconly <-ggplot(data, aes(x = x_centroid, y = y_centroid,
                        col =(KRT7==0 & PTPRC>0))) + geom_point(size=0.1) +
  scale_color_manual(values=c("white", "#7ECD60")) + #https://www.datanovia.com/en/lessons/combine-multiple-ggplots-into-a-figure/
  theme(panel.background = element_rect(fill = "white"), legend.position = "none", plot.title=element_text(hjust=0.5)) + #https://r-graph-gallery.com/240-custom-layout-background-ggplot2.html#:~:text=Let's%20start%20with%20a%20very,to%20the%20theme()%20function.
  ggtitle("Only PTPRC expressed")

both <-ggplot(data, aes(x = x_centroid, y = y_centroid,
                             col =(KRT7>0 & PTPRC>0))) + geom_point(size=0.1) +
  scale_color_manual(values=c("white", "#4A95E0")) + #https://www.datanovia.com/en/lessons/combine-multiple-ggplots-into-a-figure/
  theme(panel.background = element_rect(fill = "white"), legend.position = "none", plot.title=element_text(hjust=0.5)) + #https://r-graph-gallery.com/240-custom-layout-background-ggplot2.html#:~:text=Let's%20start%20with%20a%20very,to%20the%20theme()%20function.
  ggtitle("Both expressed")

neither <-ggplot(data, aes(x = x_centroid, y = y_centroid,
                        col = (KRT7==0 & PTPRC==0))) + geom_point(size=0.1) +
  scale_color_manual(values=c("white", "black")) + #https://www.datanovia.com/en/lessons/combine-multiple-ggplots-into-a-figure/
  theme(panel.background = element_rect(fill = "white"), legend.position = "none", plot.title=element_text(hjust=0.5)) + #https://r-graph-gallery.com/240-custom-layout-background-ggplot2.html#:~:text=Let's%20start%20with%20a%20very,to%20the%20theme()%20function.
  ggtitle("Neither expressed")

allcolors <-ggplot(data, aes(x = x_centroid, y = y_centroid,
                        col=bool)) + geom_point(size=0.2) + #https://www.datanovia.com/en/lessons/combine-multiple-ggplots-into-a-figure/
  theme(panel.background = element_rect(fill = "white"), legend.position = "left", plot.title=element_text(hjust=0.5)) + #https://r-graph-gallery.com/240-custom-layout-background-ggplot2.html#:~:text=Let's%20start%20with%20a%20very,to%20the%20theme()%20function.
  ggtitle("Comparative expression of KRT7 and PTPRC")

grid.arrange(allcolors, grid.arrange(krt7only, ptprconly, both, neither, ncol = 2, nrow = 2), ncol = 2)
(do you think my data visualization is effective? why or why not?) I don’t think your data visualization is effective as it is not readily apparent what you are trying to make salient. Part of this is the decision to not put the y positon on the y-axis instead to choosing to put ERBB2 expression there which makes it confusing to see any trends in the data. Additionally, there is not enough of a difference between the sizes of the points which makes it hard to see any trends related to cell area.