Homework 5

Description
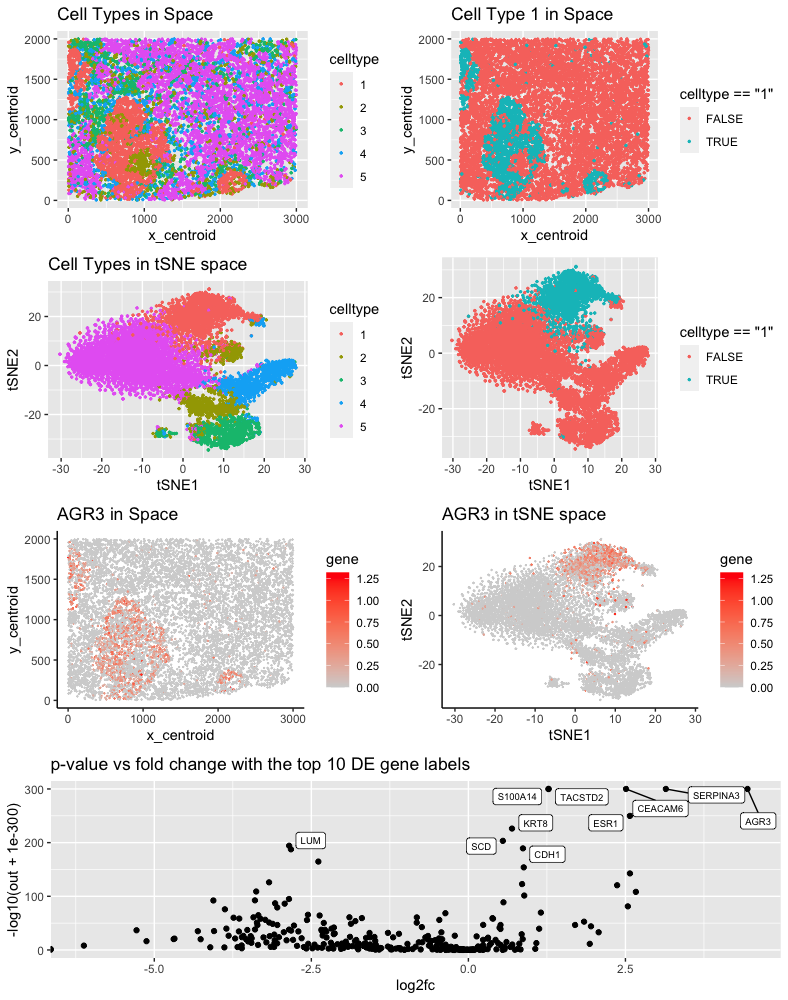
The cluster I selected (Cluster 1) corresponds to breast cancer tumor cells. Since cell types can usually be characterized by the states of several marker genes, I will analyze the differentially expression gene to identify the cluster of interest. According to my differential expression analysis, the DE genes include AGR3, TACSTD2, and ESR1.
-
According to Jian et al. [1], AGR3 is upregulated in ER-positive breast cancer cell lines. Similar results are found by Garczyk et al [2]. They concluded that “AGR3 was predominantly expressed in the cytoplasm of breast tumour cells.” My computational is consistent with this result, where we can observe an upregulation of AGR3 gene in the cluster of interest, indicated by the large positive fold change.
-
TACSTD2 belongs to the family of tumor associated calcium signal transducer. It is reported to be present in all breast cancer subtype and correlated with tumor proliferation genes by Vidula et al. [3]
-
According to Dustin el al., “ESR1 mutations can pre-exist in primary tumor” of breast cancer and “can be enriched during metastasis.” Again, this agrees with my differential expression analysis, where the expression pattern of ESR1 differs across cluster 1 and other clusters significantly.
Other differentially expressed genes are also consistent with the claim that the cluster of interest corresponds to primary breast cancer tumor cell population.
Reference:
[1] Jian, Lei, et al. “AGR3 promotes estrogen receptor‑positive breast cancer cell proliferation in an estrogen‑dependent manner.” Oncology Letters 20.2 (2020): 1441-1451.
[2] Garczyk, Stefan, et al. “AGR3 in breast cancer: prognostic impact and suitable serum-based biomarker for early cancer detection.” PloS one 10.4 (2015): e0122106.
[3] Vidula, Neelima, Christina Yau, and Hope Rugo. “Trophoblast Cell Surface Antigen 2 gene (TACSTD2) expression in primary breast cancer.” Breast Cancer Research and Treatment 194.3 (2022): 569-575.
[4] Dustin, Derek, Guowei Gu, and Suzanne AW Fuqua. “ESR1 mutations in breast cancer.” Cancer 125.21 (2019): 3714-3728.
Code
1
2
3
4
5
6
7
8
9
10
11
12
13
14
15
16
17
18
19
20
21
22
23
24
25
26
27
28
29
30
31
32
33
34
35
36
37
38
39
40
41
42
43
44
45
46
47
48
49
50
51
52
data = read.csv("pikachu.csv.gz",row.name =1)
pos = data[,1:2]
gexp = data[,4:ncol(data)]

good.cells = rownames(gexp)[rowSums(gexp)>10]
pos = pos[good.cells,]
gexp = gexp[good.cells,]

totgexp = rowSums(gexp)
mat = gexp/totgexp
mat = mat * median(totgexp)
mat = log10(mat + 1)

emb = Rtsne::Rtsne(mat)
com = kmeans(mat,center  = 5)
library(ggplot2)
df = data.frame(pos, emb$Y,celltype = as.factor(com$cluster))
p1 = ggplot(df,aes(x = x_centroid,y = y_centroid,col= celltype)) + geom_point(size = 0.5) + ggtitle("Cell Types in Space")
p2 = ggplot(df,aes(x = X1, y = X2 ,col = celltype)) + geom_point(size = .5)+labs(x="tSNE1",y = "tSNE2")+ggtitle("Cell Types in tSNE space")
p1_c1 = ggplot(df,aes(x = x_centroid,y = y_centroid,col= celltype == "1")) + geom_point(size = 0.5) +ggtitle("Cell Type 1 in Space")+theme(legend.key.width= unit(.5, 'cm'))
p2_c1 = ggplot(df,aes(x = X1, y = X2 ,col = celltype == "1")) + geom_point(size = .5)+labs(x="tSNE1",y = "tSNE2")+theme(legend.key.width= unit(.5, 'cm'))
+ggtitle("Cell Type 1 in tSNE Space")
cluster.of.interest = names(which(com$cluster == 1))
cluster.other  =  names(which(com$cluster != 1))
out = sapply(colnames(mat), function(g){
  wilcox.test(mat[cluster.of.interest, g],mat[cluster.other, g],alternative="two.sided")$p.value
})

## visualize this gene
g <- 'AGR3'
df <- data.frame(pos, emb$Y, gene=mat[,g])
p3_agr <- ggplot(df, aes(x = x_centroid, y = y_centroid, col=gene)) +
  geom_point(size = 0.1) + theme_classic() + scale_color_continuous(low='lightgrey', high='red') + ggtitle("AGR3 in Space")
p4_agr <- ggplot(df, aes(x = X1, y = X2, col=gene)) + geom_point(size = 0.1) +
  theme_classic() + scale_color_continuous(low='lightgrey', high='red') +labs(x="tSNE1",y = "tSNE2")+ggtitle("AGR3 in tSNE space")

log2fc <- sapply(colnames(mat), function(g) {
  a <- mat[cluster.of.interest, g]
  b <- mat[cluster.other, g]
  log2(mean(a)/mean(b))
})

## volcano plot
df = data.frame(out, log2fc)
df_subset = df[names(head(sort(out), n=10)),]

library(ggrepel) ## install.packages("ggrepel")
p5 = ggplot(df, aes(y=-log10(out + 1e-300) , x=log2fc)) + geom_point() +ggtitle("p-value vs fold change with the top 10 DE gene labels") +
  ggrepel::geom_label_repel(data = df_subset, aes(x=log2fc,y=-log10(out+ 1e-300),label = rownames(df_subset)),size = 2.5)

library(gridExtra)
grid.arrange(p1,p1_c1,p2,p2_c1,p3_agr,p4_agr,p5,layout_matrix = rbind(c(1,2), c(3,4),c(5,6),c(7,7)))