Relationship between Number of Genes Expressed and Cell Area

What data types are you visualizing?
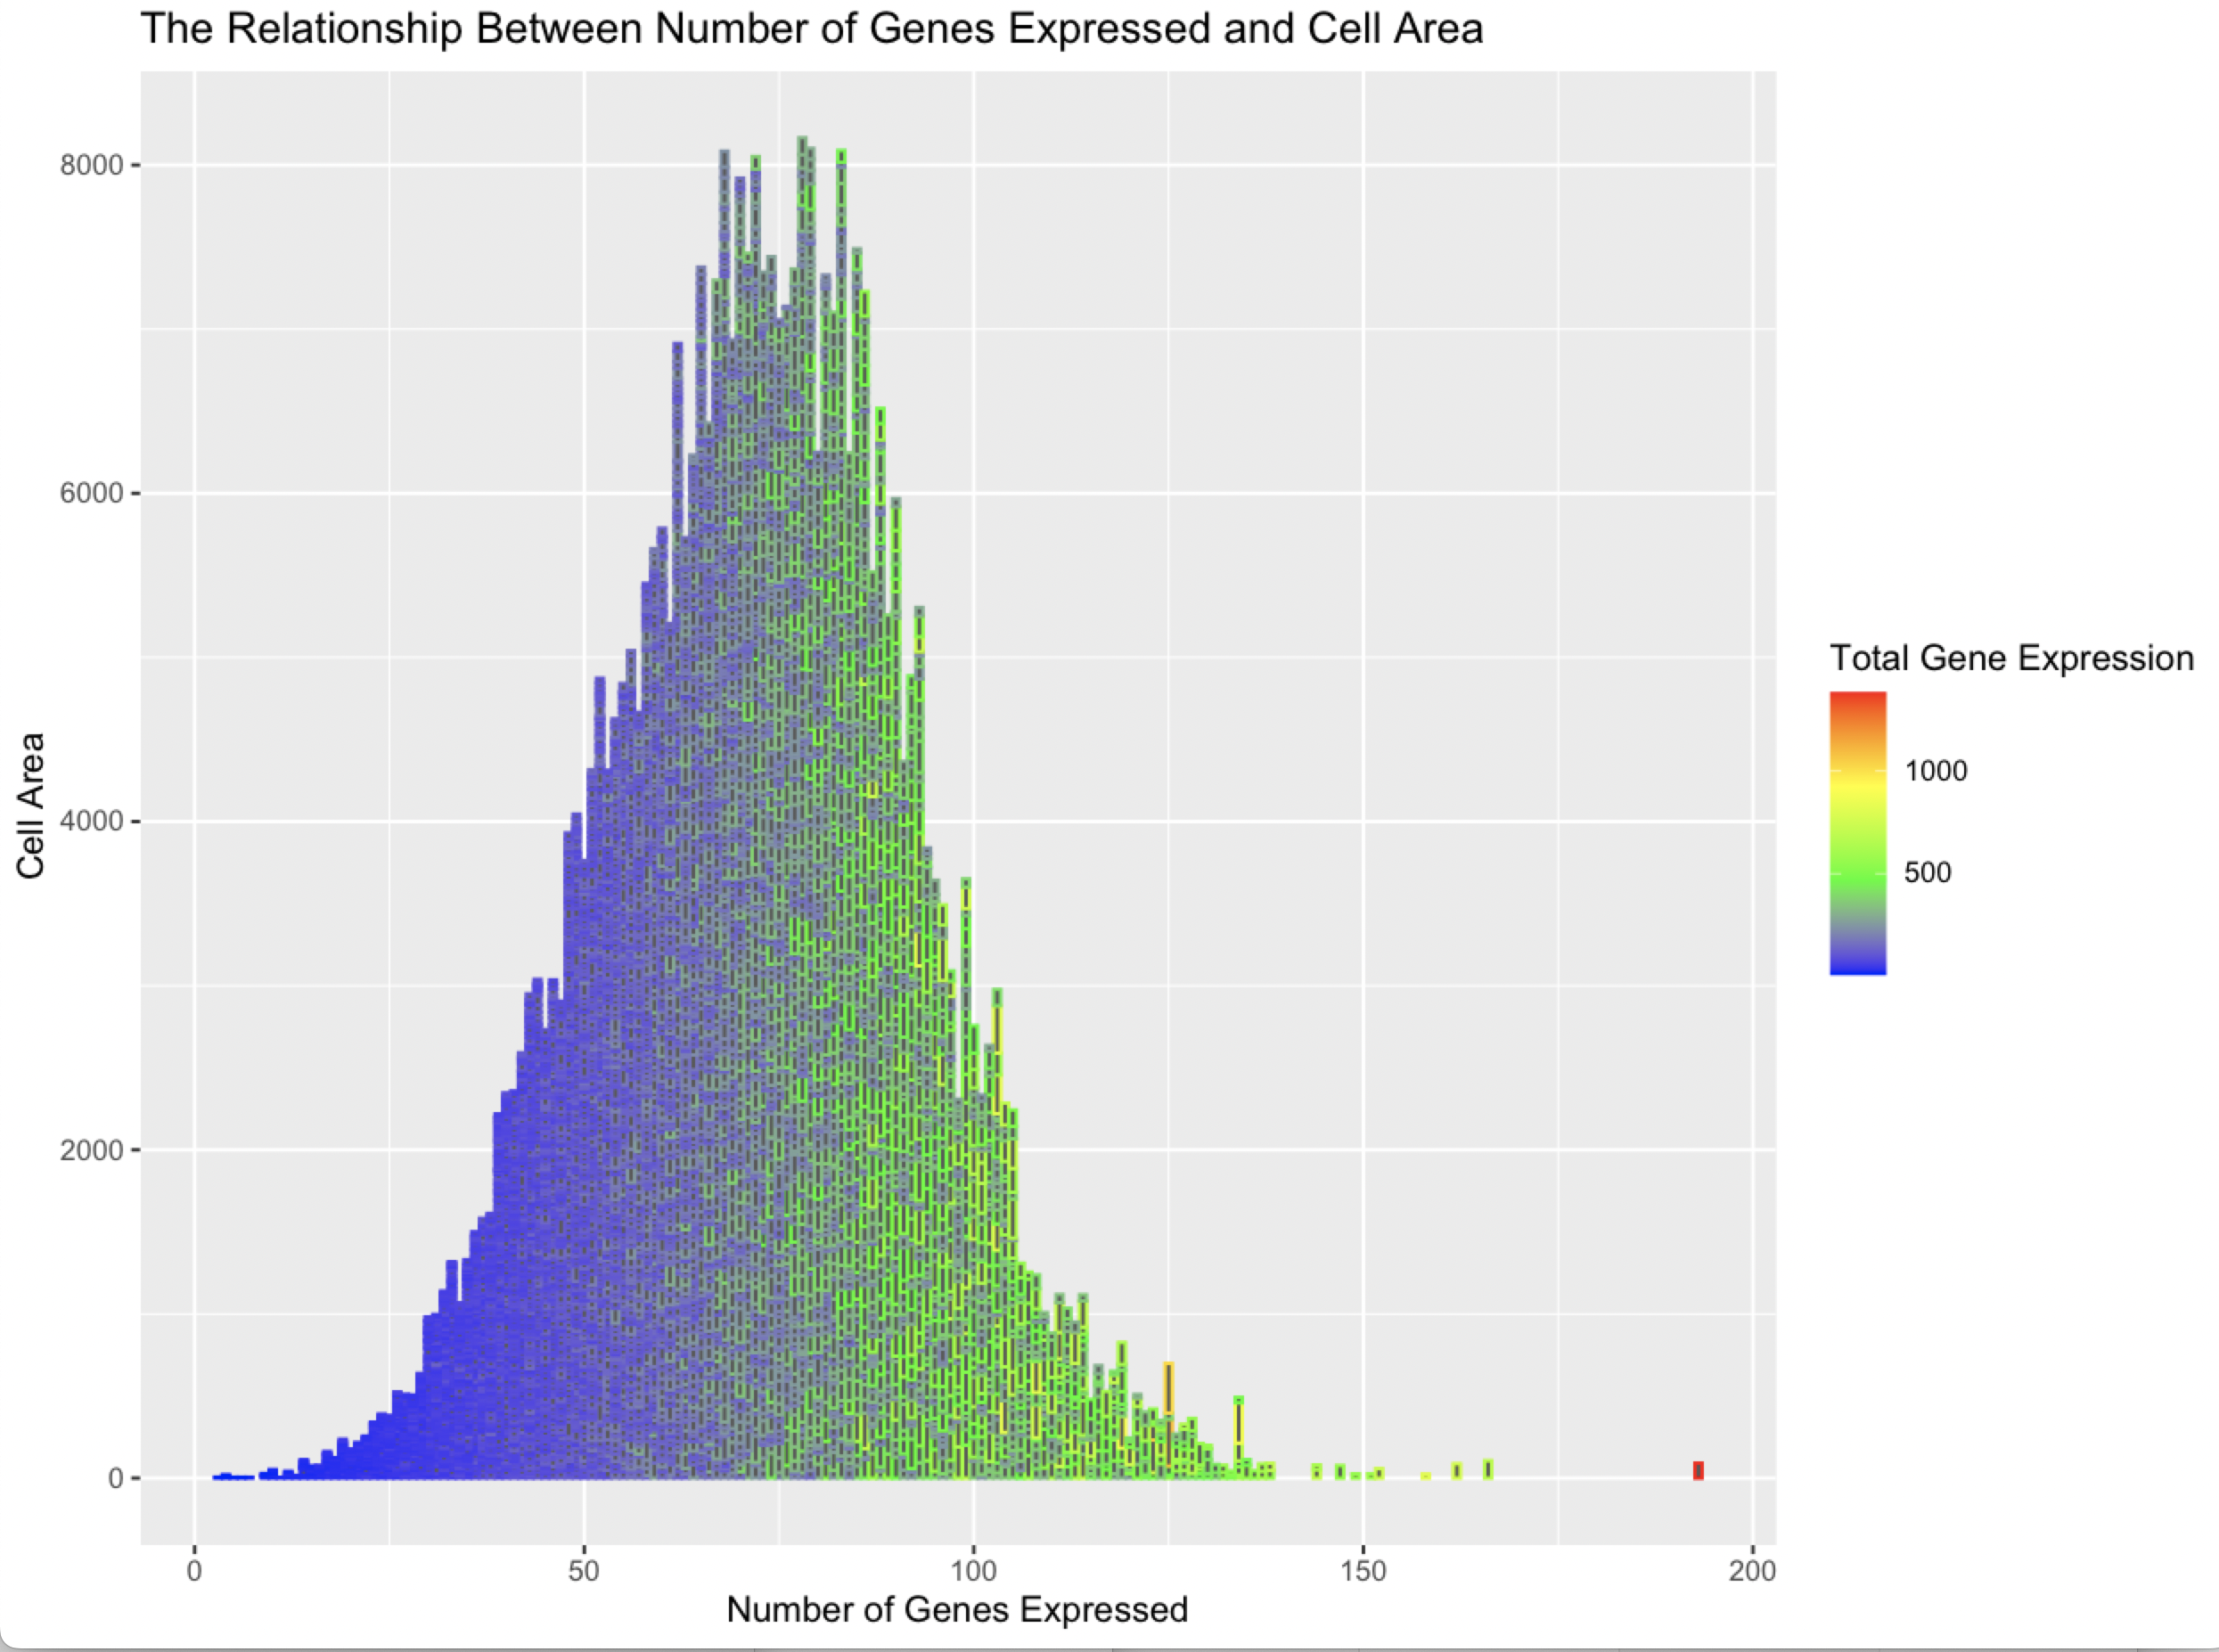
I am visualizing the given quantitative data type of “Cell Area”, and the calculated quantitative data type of “Number of Genes Expressed” (calculated by summing the number of non-zero gene expression entries for a given cell) and the calculated quantitative data type of “Total Gene Expression” (calculated by summing all the entries for a given cell).
What data encodings are you using to visualize these data types?
I used the geometric primitive of lines to represents a cell, there is overlap between lines given the scale of the x-axis. The visual channels of size and position encode cell area. The color hue encodes total gene expression on a scale from low to high.
What type of data visualization is this? What about the data are you trying to make salient through this data visualization?
The data visualization makes salient the relationship between the number of genes expressed and the area of the cell, it shows the relatively bell-shaped density this relationship seems to make. It also shows the relationship between number of genes expressed and total gene expression which indicates the two variables are positively correlated.
What Gestalt principles or knowledge about perceptiveness of visual encodings are you using to accomplish this?
I am using the Gestalt principle of similarity to show relationships between different colors. I am using the Gestalt principle of continuitiy so show the curve represented by the outline of the shape.
Code
data <- read.csv('bulbasaur.csv.gz')
dim(data)

#initialization from in-class by Prof. Fan (1/27)
pos <- data[,2:3]
area <- data[,4]
gexp <- data[,5:ncol(data)]
rownames(pos) < names(area) < rownames(gexp) <- data[,1]
head(pos)
head(area)

mean(area)
sd(area)
total_gexp <- rowSums(gexp)

##https://www.geeksforgeeks.org/how-to-find-index-of-element-in-vector-in-r/
max_idx <- which(total_gexp == max(total_gexp))
max_loc <- data[max_idx,2:3]
dist_from_max = c()
for (i in 1:nrow(data)) {
  dist_from_max[i] <- sqrt((max_loc[1] - pos[i,1])^2 + (max_loc[2] - pos[i,2])^2)
}

dist = as.numeric(dist_from_max)

num_nonzero = c()
for (i in 1:nrow(data)) {
  count = 0
  for (j in 5:ncol(data)) {
    if (data[i,j] != 0) {
      count = count + 1
    }
  }
  num_nonzero[i] <- count
}

num_genes_expressed = as.numeric(num_nonzero)


# proportion of overall gene exp and area
#http://www.sthda.com/english/wiki/ggplot2-barplots-quick-start-guide-r-software-and-data-visualization
#https://ggplot2.tidyverse.org/reference/scale_gradient.html
#https://www.geeksforgeeks.org/how-to-change-legend-title-in-ggplot2-in-r/
#https://www.educative.io/answers/what-is-the-asnumeric-function-in-r

library(ggplot2)
ggplot(data = data, aes(x = num_genes_expressed, y = area, color = total_gexp)) + geom_col()  +
  scale_colour_gradientn(colors = c("blue", "green", "yellow", "red")) + xlab("Number of Genes Expressed") +
  ylab("Cell Area") +  labs(color = "Total Gene Expression") + ggtitle("The Relationship Between Number of Genes Expressed and Cell Area")