Homework 1 Submission

What data types are you visualizing?
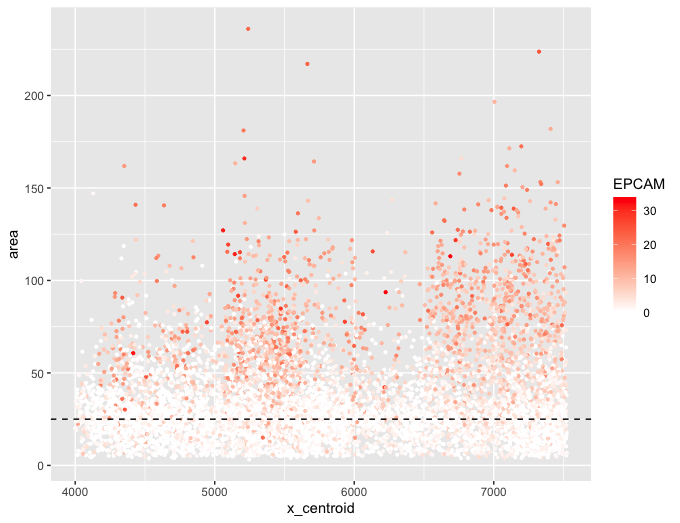
I am visualizing quantitative data that consists of information regarding the area of the cell, and gene expression of EPCAM within each cell. I am also visualizing spatial data that demonstrates the x centroid position of the cells.
What data encodings are you using to visualize these data types?
I used the geometric primitive of points to represent singular cells within the dataset. I encoded the spatial data of x centroid position with the visual channel of position along the x axis, while I encoded the area of each cell with the visual channel of position along the y axis. Lastly, I also used the visual channel of saturation to demonstrate the gene expression of EPCAM within each cell.
What are you trying to make more salient with this data visualization?
With this data visualization, I am attempting to make more salient the relationship between EPCAM expression within the cell and the area of the cell, and how this relationship is independent of the x position of the centroid.
What Gestalt principles or knowledge about perceptiveness of visual encodings are you using to accomplish this?
I used Gestalt’s principle of similarity to demonstrate that cells with higher EPCAM expression are grouped together with a larger area of the cell, I also used Gestalt’s principle of enclosure by adding a dashed line in the plot to demonstrate the distinction between the two separate states where cells with a small area generally have a very low EPCAM expression and cells with a large area generally have a higher EPCAM expression.
1
2
3
4
5
6
7
8
9
data <- read.csv('/Users/ryanchan/Desktop/charmander.csv.gz')
library(ggplot2)

head(data)

ggplot(data = data) +
  geom_point(aes(x=x_centroid, y = area, col = EPCAM), size = 0.75) +
  scale_colour_gradient(low = 'white', high = 'red') +
  geom_hline(yintercept = 25, linetype = 'dashed', color = 'black')
