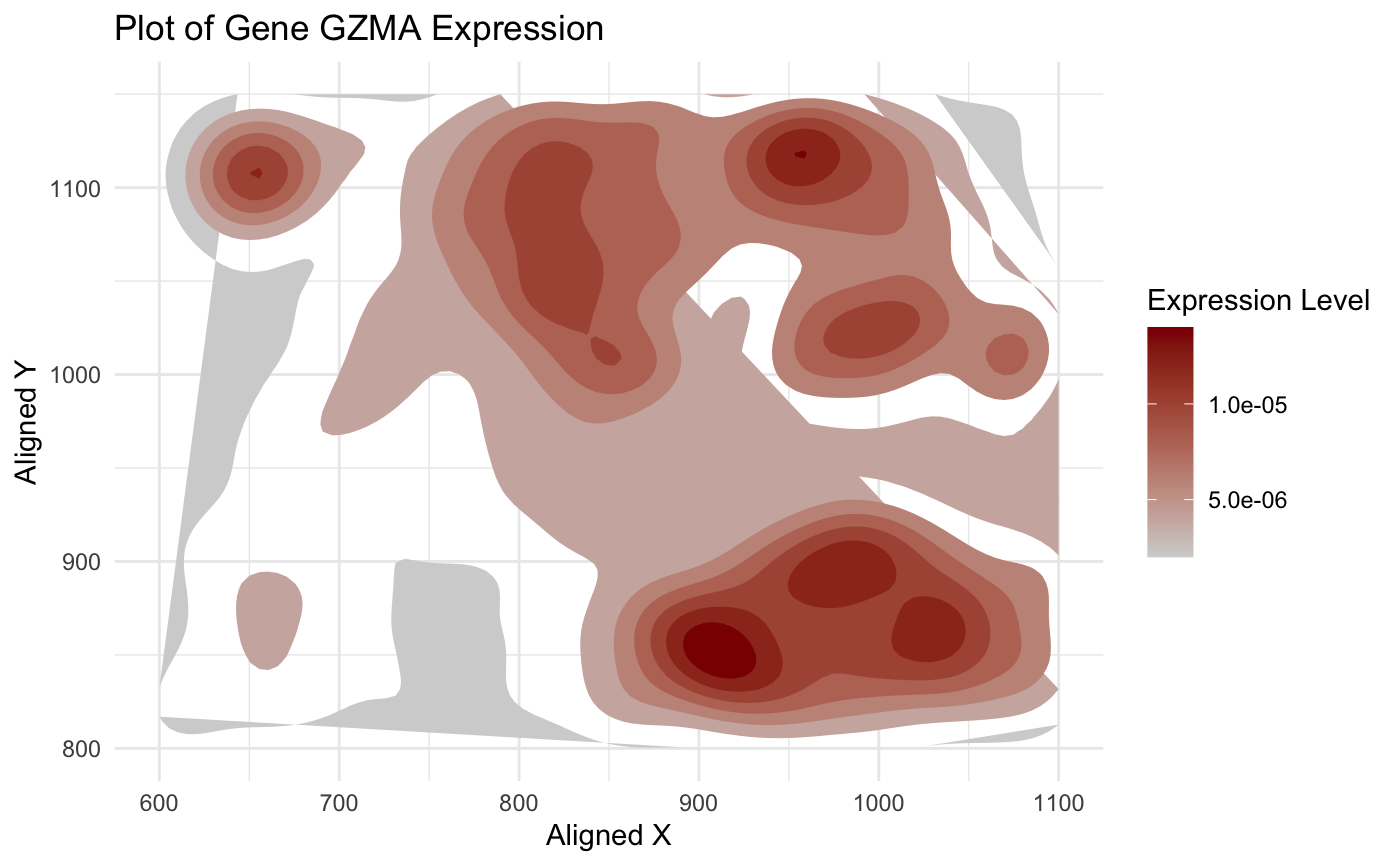
Gene Expression Level of GZMA in coordinate

1. What data types are you visualizing?
I am trying to visualize aligned_x, aligned_y which is spatial data as it provides location information of the cell. And the gene expression level (GZMA) is quantitative data as it has numerical value.
2. What data encodings (geometric primitives and visual channels) are you using to visualize these data types?
For Geometric Primitive: It is area (I used polygons to groups area with similar amount of expression level) And for Visual Channels: They are Position (aligned_x, aligned_y are spatial coordinates) and color (gene expression expressed by color gradient of light grey and red(hue and saturation).
3. What about the data are you trying to make salient through this data visualization?
I used color encoding to make area with high gene expression more salient. And these similar expression are also clustered in specific areas making it more stood out.
4. What Gestalt principles or knowledge about perceptiveness of visual encodings are you using to accomplish this?
According to slide, it is gonna be Similarity, Proximity, and Continuity I will say. Cells with similar gene expression are being grouped together which used the knowledge of Similarity and Proximity. And with areas centered with hotspot (highest expression level) and gradually spread out give a nice, smooth transition of continuity.
5. Code (paste your code in between the ``` symbols)
1
2
3
4
5
6
7
8
9
10
11
12
13
14
15
16
17
18
19
20
21
library(ggplot2)
file <- '/Users/harriethe/GenomicDataVisualization/genomic-data-visualization-2025/data/pikachu.csv.gz'
data <- read.csv(file)
head(data)
dim(data)
# 319-6 = 313 genes
# 17136 cells
ncol(data)
nrow(data)
head(rownames(data))
head(colnames(data),15)
sort(colSums(data[,7:ncol(data)]),decreasing = TRUE)

ggplot(data, aes(x = aligned_x, y = aligned_y, z = GZMA)) +
  stat_density_2d(aes(fill = ..level..), geom = "polygon") +
  scale_fill_gradient(low = "lightgrey", high = "darkred") +
  theme_minimal() +
  labs(title = "Plot of Gene GZMA Expression",
       x = "Aligned X",
       y = "Aligned Y",
       fill = "Expression Level")
(Please do not copy. I did not do a good job on this HW.)
#Reference:
I gave it a quick recap to 10X Visium website: https://www.10xgenomics.com/analysis-guides/integrating-10x-visium-and-chromium-data-with-r
I also give it a quick read at
#Vickovic, S., Eraslan, G., Salmén, F. et al. High-definition spatial transcriptomics for in situ tissue profiling. Nat Methods 16, 987–990 (2019). https://doi.org/10.1038/s41592-019-0548-y