Hw5: Identifying Tissue Samples and Cell Types

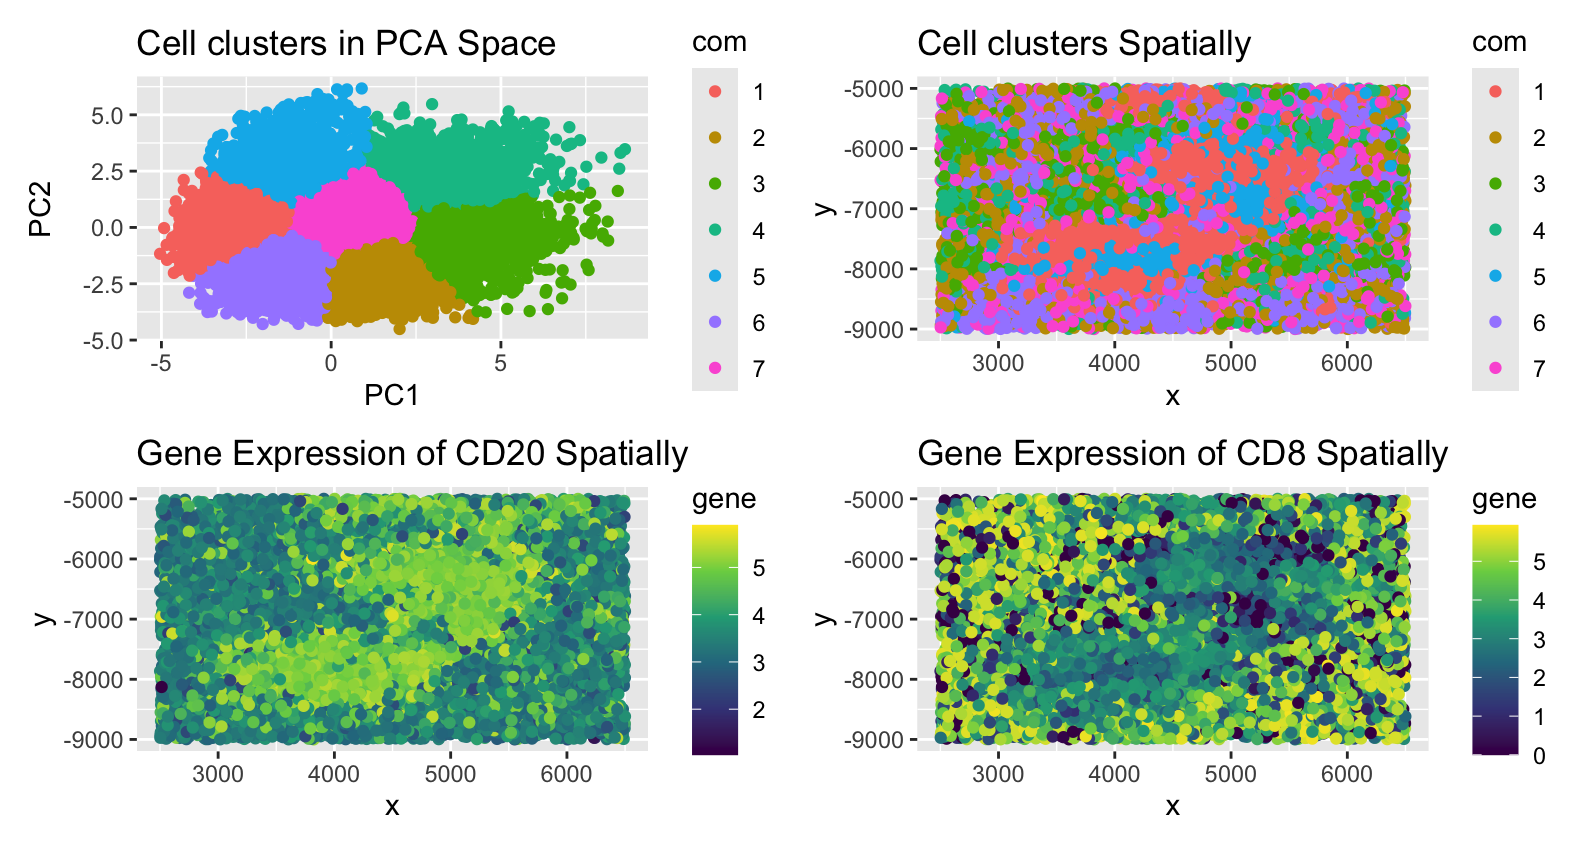
Through my analysis, I concluded that the tissue sample is white pulp. This is because the main genes that are expressed are in the CD family, which are mainly found in lymphatic cells. I identified two cell types to be B cells and endothelial cells. I first performed quality control by normalizing the data. This is important because I want to analyze the gene expression in each cell, not in each spot. If a spot is denser than other spots, it may indicate higher gene expression even though the expression within each cell is constant. Next, I performed dimensionality reduction in the form of PCA. This helped me do k-means clustering because the elbow plot showed a kink in the graph at k=7. From there, I checked which genes were upregulated using a one-sided greater than Wilcox test for cluster 1 and cluster 7. I searched up the genes (commented in the code) that had the lowest p-values and figured out that the cell type in the middle of the sample were B-cells. This is because CD20 is expressed mostly in those cell types and not in the surrounding cells. CD20 is primarily on the surface of B cells. I also checked the other top expressing genes and they all are unregulated in activated B cells. The other cell cluster had upregulated CD8, Lyve1, and vimentin expressions. Although CD8 is only expressed in killer T cells, the other genes are not expressed in T cells but rather endothelial cells. However, endothelial cells can express CD8 if the periphery cells are expressing it, which we can assume is true by looking at the “Cell clusters Spatially” graph. Based on these observations, I conclude that the tissue sample is white pulp, which is found in the spleen and primarily responsible for immune functions.
Sources:
https://www.nature.com/articles/ncomms7771#:~:text=Lymphatic%20endothelial%20cells%20(LECs)%20directly,CD8%20T%2Dcell%20deletional%20tolerance.
https://pmc.ncbi.nlm.nih.gov/articles/
https://www.guidetopharmacology.org/GRAC/ObjectDisplayForward?objectId=2742&familyId=852&familyType=OTHER#:~:text=CD3e%20is%20a%20subunit%20of%20the%20T,CD3%CE%B5%20chains%20(CD3E)%2C%20plus%20the%20TCR%20(
5. Code (paste your code in between the ``` symbols)
1
2
3
4
5
6
7
8
9
10
11
12
13
14
15
16
17
18
19
20
21
22
23
24
25
26
27
28
29
30
31
32
33
34
35
36
37
38
39
40
41
42
43
44
45
46
47
48
49
50
51
52
53
54
55
56
57
58
59
60
61
62
63
64
65
66
67
68
69
70
71
72
73
74
75
76
data <- read.csv('/Users/anishkabhartiya/Desktop/genomic-data-visualization-2025/data/codex_spleen_3.csv.gz', row.names=1)
data[1:5,1:5]

pos <- data[,1:2]
exp <- data[, 4:ncol(data)]
head(pos)
head(exp)

dim(exp)

norm <- log10(exp/rowSums(exp) * 1e6 + 1)
norm[1:5,1:5]

pcs <- prcomp(norm)

elbow <- sapply(2:20, function(k) {
  out <- kmeans(pcs$x[,1:2], centers=k)
  out$tot.withinss
})
plot(2:20, elbow)

## elbow around 7, so choose k as 7

library(ggplot2)

com <- as.factor(kmeans(pcs$x[,1:2], centers=7)$cluster)
df <- data.frame(pcs$x[,1:2], com)
g1 <- ggplot(df, aes(x = PC1, y=PC2, col=com)) + geom_point() +
  ggtitle("Cell clusters in PCA Space")

df <- data.frame(pos, com)
g2 <- ggplot(df, aes(x = x, y=y, col=com)) + geom_point() +
  ggtitle("Cell clusters Spatially")

print(g1 + g2)

ct1 <- names(clusters)[which(clusters == 1)]
ctother <- names(clusters)[which(clusters != 1)]
results <- sapply(colnames(norm), function(i) {
  wilcox.test(norm[ct1, i], norm[ctother, i], alternative = "greater")$p.value
})

names(results) <- colnames(norm)
sort(results[results < 0.05/ncol(norm)])

## CD20 is a protein found on the surface of B cells
## CD3e is a protein subunit of the T-cell receptor (TCR) complex that plays an important role in T-cell development and function

ct7 <- names(clusters)[which(clusters == 7)]
ctother <- names(clusters)[which(clusters != 7)]
results <- sapply(colnames(norm), function(i) {
  wilcox.test(norm[ct7, i], norm[ctother, i], alternative = "greater")$p.value
})

names(results) <- colnames(norm)
sort(results[results < 0.05/ncol(norm)])

## CD8 is a protein on the surface of cytotoxic T cells
## Lyve1 is primarily upregulated on lymphatic endothelial cells
## Vimentin is primarily upregulated in mesenchymal cells, including fibroblasts, endothelial cells

library(patchwork)

sort(colSums(norm))
## found on the surface of certain cells, primarily white blood cells --> https://pmc.ncbi.nlm.nih.gov/articles/PMC9101515/#:~:text=CD15%20(Lewis%20X/Lex),CD15s%20expression%20is%20very%20complex.
df <- data.frame(pos, gene=norm[,'CD20'])
g3 <- ggplot(df, aes(x=x, y=y, col=gene)) + geom_point() +
  scale_color_viridis_c() +
  ggtitle("Gene Expression of CD20 Spatially")

df <- data.frame(pos, gene=norm[,'CD8'])
g4 <- ggplot(df, aes(x=x, y=y, col=gene)) + geom_point() +
  scale_color_viridis_c() +
  ggtitle("Gene Expression of CD8 Spatially")

print(g1 + g2 + g3 + g4)