HW5: Identifying Cell Types in Spleen

Objective
The goal to figure out what tissue structure is represented in the CODEX data. Options include: (1) Artery/Vein, (2) White pulp, (3) Red pulp, (4) Capsule/Trabeculae
Pipeline
We conduct the analysis pipeline outlined as follows:
-
Load and preprocess the data including normalization and transformation.
-
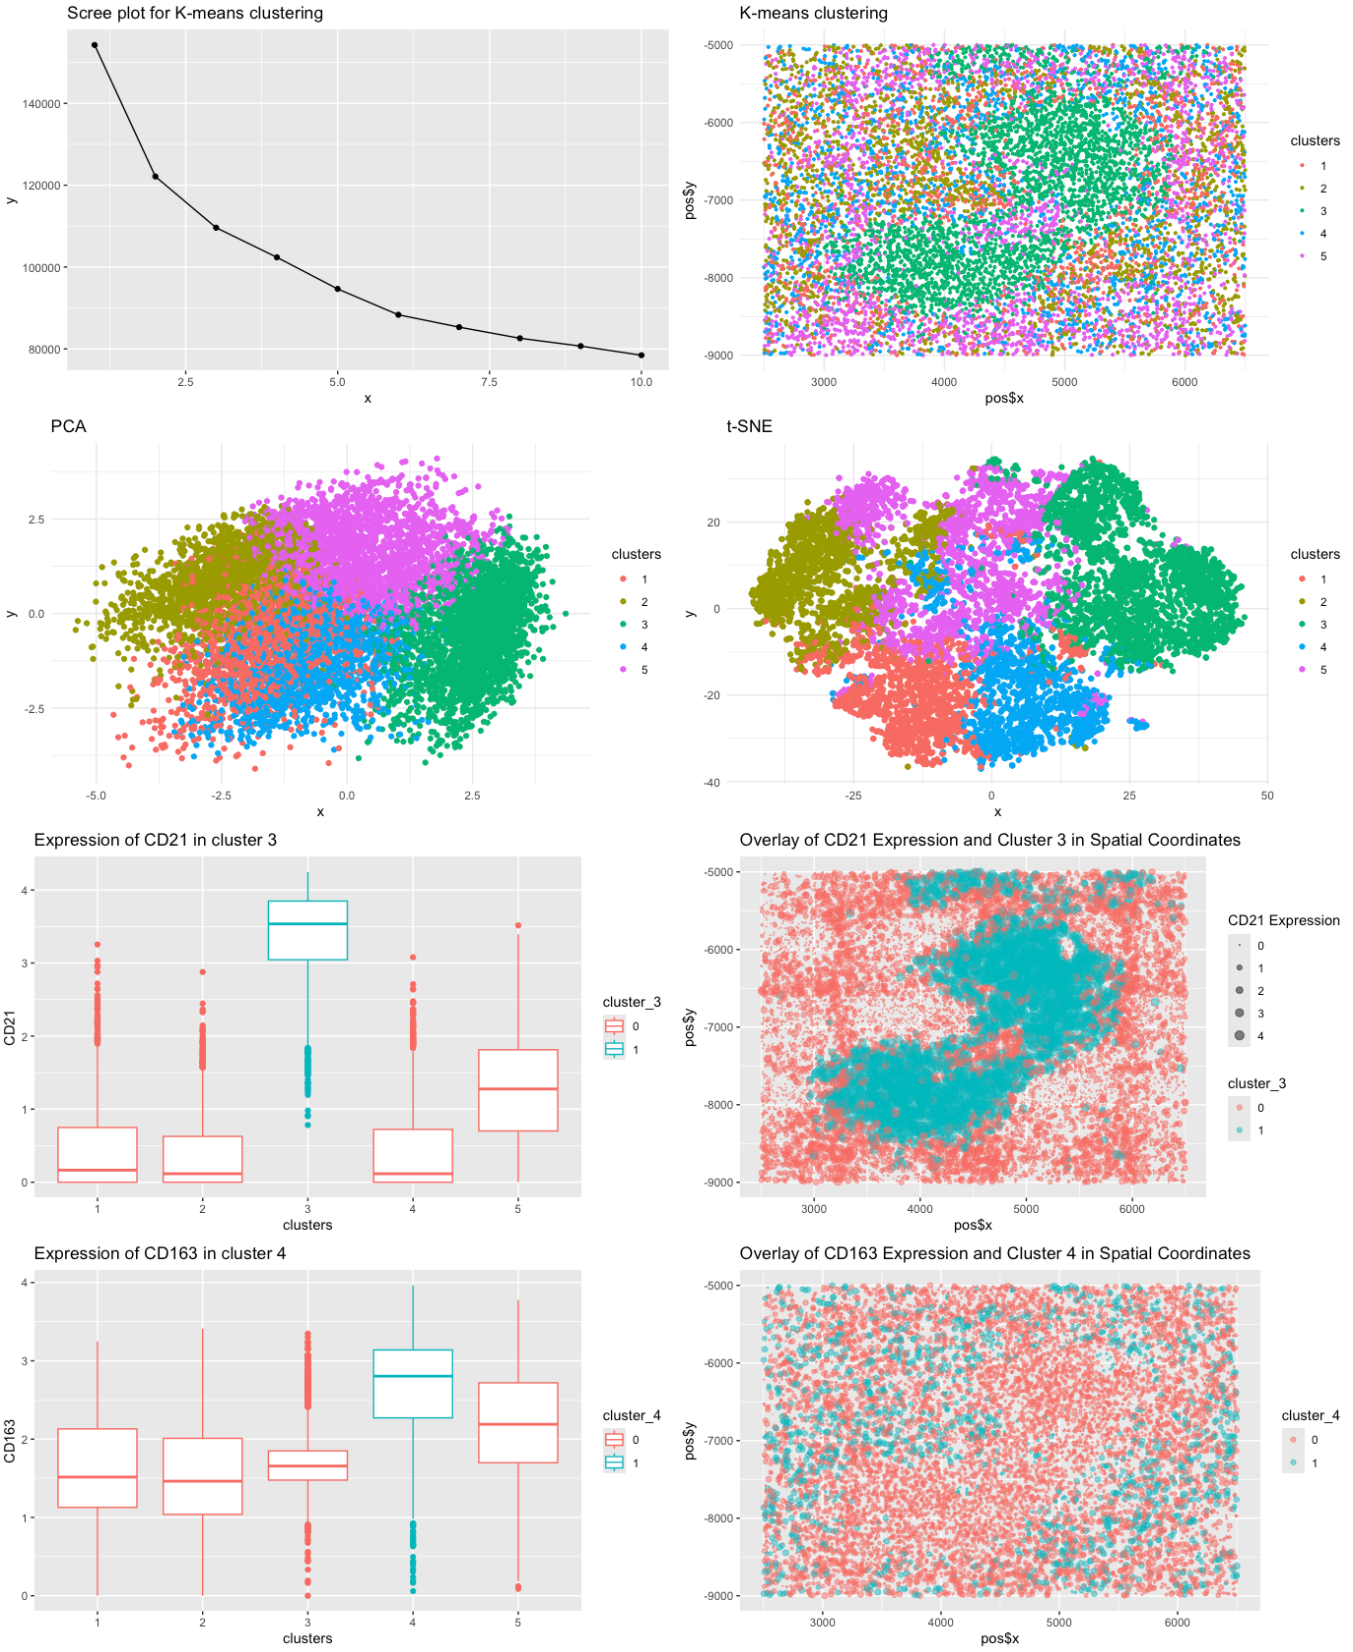
Perform Total-Withiness elbow method to determine the optimal number of clusters and apply kmeans clustering. We decide to use k=5 from the elbow plot as the reasonable number of clusters.
-
Perform PCA and tSNE to reduce the dimensionality of the data and visualize the clusters in the reduced dimensional space as well as in the original physical space. The plot shows a clear and cohesive clustering of the data in the reduced dimensional space both in PCA and tSNE.
-
Calculate the cumulative variance explained by the principal components to determine the number of components to use for further analysis. We decide to use the first 13 components as they explain 90% of the variance. From the loading values of the first 13 components, we infer highly influential genes for each component. We found 26 genes that are used to explain the 90% of the variance in the data.
-
We then visulaize the distribution of each gene found in each cluster, which shows that some gene have high differentiability between clusters. We deterimined that these genes are potential markers for the cell types in the spleen to distinguish the clusters.
-
We then conducted research in the literature to learn about the genes we found as well as the cell types we are trying to identify.
About the cell types in the spleen:
(1) Artery/Vein : These are are primarily structural and functional proteins that support vascular integrity, elasticity, and blood flow regulation. Hece we expect to find Structural Proteins like Collagen, Elastin, Laminin, Fibronectin, etc. (2) White pulp : The white pulp of the spleen is a lymphoid tissue primarily involved in immune responses. It contains B cells, T cells, antigen-presenting cells (APCs), and macrophages, each expressing specific markers. (3) Red pulp : The red pulp of the spleen plays a major role in filtering blood, removing old/damaged red blood cells (RBCs), and supporting innate immune responses. It consists of sinusoidal endothelial cells, macrophages, dendritic cells, and reticular cells. (4) Capsule/Trabecula: A thin, fibrous capsule covers the spleen from which trabeculae arise. Trabeculae are fibrous bands transporting blood vessels to and from the splenic pulp. They are composed of collagen, elastin, and smooth muscle cells.
**Above referenced from (13)
About the Expressive genes in the spleen dataset
The top genes that contribute to the PCs are:
- CD21 : CD21 is produced by B cells and follicular dendritic cells, where it binds cleavage products of the C3 complement protein. CD21 facilitates internalization of immune complexes by B cells to enhance antigen presentation.(1)
- Podoplanin : Podoplanin (PDPN) is a well-conserved, mucin-type transmembrane protein expressed in multiple tissues during ontogeny and in adult animals, including the brain, heart, kidney, lungs, osteoblasts, and lymphoid organs. Podoplanin is a transmembrane receptor glycoprotein that is upregulated on transformed cells, cancer associated fibroblasts and inflammatory macrophages that contribute to cancer progression. In particular, PDPN increases tumor cell clonal capacity, epithelial mesenchymal transition, migration, invasion, metastasis and inflammation. (2)
- ECAD : Epithelial-cadherin (E-cadherin; encoded by CDH1) is a member of the classical cadherins (the others being neural cadherin (N-cadherin) and vascular endothelial cadherin (VE-cadherin)). These single-pass transmembrane glycoproteins are expressed by a variety of tissues and are involved in Ca2+-dependent cell–cell adhesion. (3)
- CD44 : The protein encoded by this gene is a cell-surface glycoprotein involved in cell-cell interactions, cell adhesion and migration. It is a receptor for hyaluronic acid (HA) and can also interact with other ligands, such as osteopontin, collagens, and matrix metalloproteinases (MMPs). This protein participates in a wide variety of cellular functions including lymphocyte activation, recirculation and homing, hematopoiesis, and tumor metastasis. Transcripts for this gene undergo complex alternative splicing that results in many functionally distinct isoforms, however, the full length nature of some of these variants has not been determined. Alternative splicing is the basis for the structural and functional diversity of this protein, and may be related to tumor metastasis. (4)
- CD45RO : CD45 is a tyrosine phosphatase membrane protein expressed abundantly on the surface of a wide range of immune cells, including T lymphocytes [26,27]. In humans, CD45 is expressed in a combination of multiple isoforms generated through alternative splicing of the CD45 pre-mRNA at exons 4, 5, and 6 [26,28,29]. Inclusion and exclusion of these three exons differentially generate CD45 isoforms, such as the high molecular weight CD45RA and the low molecular weight CD45RO. (5)
- FoxP3 : FOXP3 is a member of the forkhead transcription factor family. Unlike other members, it is mainly expressed in a subset of CD4+ T-cells that play a suppressive role in the immune system. A function of FOXP3 is to suppress the function of NFAT and NFkappaB and this leads to suppression ofexpression of many genes including IL-2 and effector T-cell cytokines. FOXP3 acts also as a transcription activator for many genes induding CD2S, Cytotoxic T-Lymphocyte Antigen 4 (CTLA4), glucocorticoid-induced TNF receptorfamily gene (GITR) andfolate receptor 4. FOXP3+ T-cells are made in the thymus and periphery. The FOXP3+ T-cells made in the thymus migrate to secondary lymphoid tissues and suppress antigen priming of lymphocytes. (6)
- CD20 : B-lymphocyte antigen CD20 or CD20 is B lymphocyte cell-surface molecule.It is a 33-37 kDa non-glycosylated protein. CD20 is expressed on the surface of B-cells from the pre-B phase, the expression is lost in terminally differentiated plasma cells. CD20 is used as a therapeutical target of B-cell malignancies and autoimmune diseases. (7)
- HLA.DR : HLA-DRA is one of the HLA class II alpha chain paralogues. This class II molecule is a heterodimer consisting of an alpha and a beta chain, both anchored in the membrane. This molecule is expressed on the surface of various antigen presenting cells such as B lymphocytes, dendritic cells, and monocytes/macrophages, and plays a central role in the immune system and response by presenting peptides derived from extracellular proteins, in particular, pathogen-derived peptides to T cells. (8)
- CD3e : CD3e molecule, epsilon also known as CD3E is a polypeptide which in humans is encoded by the CD3E gene which resides on chromosome 11. (9)
- CollagenIV
- CD8 : CD8 (cluster of differentiation 8) is a transmembrane glycoprotein that serves as a co-receptor for the T-cell receptor (TCR). Along with the TCR, the CD8 co-receptor plays a role in T cell signaling and aiding with cytotoxic T cell-antigen interactions. Like the TCR, CD8 binds to a major histocompatibility complex (MHC) molecule, but is specific for the MHC class I protein. (11)
- Ki67 : Ki-67 is a nuclear protein that is expressed in actively dividing cells. It is a marker of cell proliferation and is used in various diagnostic and prognostic applications. Ki-67 is an excellent marker to determine the growth fraction of a given cell population. The fraction of Ki-67-positive tumor cells (the Ki-67 labeling index) is often correlated with the clinical course of cancer. (12)
- CD163: The protein encoded by this gene is a member of the scavenger receptor cysteine-rich (SRCR) superfamily, and is exclusively expressed in monocytes and macrophages. It functions as an acute phase-regulated receptor involved in the clearance and endocytosis of hemoglobin/haptoglobin complexes by macrophages, and may thereby protect tissues from free hemoglobin-mediated oxidative damage. This protein may also function as an innate immune sensor for bacteria and inducer of local inflammation. (14)
- CD15 : CD15, also known as Lewis X or Le(x), is a glycoprotein and glycolipid cluster found on cell surfaces. It’s a marker for myeloid cells and is involved in cancer, inflammation, and other conditions. (10)
- Vimentin: Vimentin is a type III intermediate filament protein that is expressed in mesenchymal cells. It is involved in the structural integrity of the cell and is important for cell adhesion, migration, and signaling. Vimentin is also a marker of epithelial-to-mesenchymal transition (EMT) and is associated with cancer progression and metastasis. (15)
- Differential Expression tests
Based on the research and the observations, we make the following assumptions:
- CD21 is highly expressed in cluster 3, which is indicative of the White pulp.
- CD163 is highly expressed in cluster 4, which is indicative of the Red pulp.
- CollagenIV is highly expressed in cluster 5, which is indicative of the Artery/Vein.
- Vimentin is highly expressed in cluster 2, which is indicative of the Capsule/Trabecula.
For the sake of this analysis, we focus on CD21 and CD163 as the markers for the White pulp and Red pulp, respectively. We fist conduct Wilcoxon rank sum test to compare the expression of CD21 in each cluster. We find that the expression of CD21 is significantly higher in cluster 3 compared to the other clusters. We then conduct the same test for CD163 and find that the expression of CD163 is significantly higher in cluster 4 compared to the other clusters. We then visualize the expression of CD21 and CD163 in each cluster to confirm the results. The results confirm that the cells in cluster 3 are also highly expressing CD21. They are concentrated in the center of the spleen, which is where the white pulp is located. The cells in cluster 4 are also highly expressing CD163. They are located in the outer region of the spleen, which is where the red pulp is located, further confirming our hypothesis.
References
- Zabel, M. D., & Weis, J. H. (2001). Cell-specific regulation of the CD21 gene. International Immunopharmacology, 1(3), 483-493. https://doi.org/10.1016/S1567-5769(00)00046-1.
- Krishnan H, Rayes J, Miyashita T, Ishii G, Retzbach EP, Sheehan SA, Takemoto A, Chang YW, Yoneda K, Asai J, Jensen L, Chalise L, Natsume A, Goldberg GS. Podoplanin: An emerging cancer biomarker and therapeutic target. Cancer Sci. 2018 May;109(5):1292-1299. doi: 10.1111/cas.13580. PMID: 29575529; PMCID: PMC5980289.
- Gall TMH, Frampton AEGene of the month: E-cadherin (CDH1)Journal of Clinical Pathology 2013;66:928-932.
- National Center for Biotechnology Information (NCBI). (n.d.). CD44 molecule (IN blood group) [Homo sapiens (human)]. Gene ID: 960. Retrieved February 25, 2025, from https://www.ncbi.nlm.nih.gov/gene/960
- Kandel, A., Li, L., Hada, A., & Xiao, Z. (2022). Differential expression of CD45RO and CD45RA in bovine T cells. Cells, 11(11), 1844. https://doi.org/10.3390/cells11111844
- Kim CH. FOXP3 and its role in the immune system. Adv Exp Med Biol. 2009;665:17-29. doi: 10.1007/978-1-4419-1599-3_2. PMID: 20429413.
- Pavlasova G, Mraz M. The regulation and function of CD20: an “enigma” of B-cell biology and targeted therapy. Haematologica. 2020 Jun;105(6):1494-1506. doi: 10.3324/haematol.2019.243543. PMID: 32482755; PMCID: PMC7271567.
- National Center for Biotechnology Information (NCBI). (n.d.). HLA-DRA major histocompatibility complex, class II, DR alpha [Homo sapiens (human)]. Gene ID: 3122. Retrieved February 25, 2025, from https://www.ncbi.nlm.nih.gov/gene/3122
- Clevers HC, Dunlap S, Wileman TE, Terhorst C. Human CD3-epsilon gene contains three miniexons and is transcribed from a non-TATA promoter. Proc Natl Acad Sci U S A. 1988 Nov;85(21):8156-60. doi: 10.1073/pnas.85.21.8156. PMID: 3267235; PMCID: PMC282386.
- Gadhoum SZ, Sackstein R. CD15 expression in human myeloid cell differentiation is regulated by sialidase activity. Nat Chem Biol. 2008 Dec;4(12):751-7. doi: 10.1038/nchembio.116. Epub 2008 Oct 19. PMID: 18953356; PMCID: PMC2597094.
- Gao, G. F., & Jakobsen, B. K. (2000). Molecular interactions of coreceptor CD8 and MHC class I: the molecular basis for functional coordination with the T-cell receptor. Immunology Today, 21(12), 630-636. https://doi.org/10.1016/S0167-5699(00)01774-1.
- Scholzen T, Gerdes J. The Ki-67 protein: from the known and the unknown. J Cell Physiol. 2000 Mar;182(3):311-22. doi: 10.1002/(SICI)1097-4652(200003)182:3<311::AID-JCP1>3.0.CO;2-9. PMID: 10653597.
- Kapila, V., Wehrle, C. J., & Tuma, F. (2023). Physiology, Spleen. In StatPearls. StatPearls Publishing. https://www.ncbi.nlm.nih.gov/books/NBK537307/
- Klein JL, Nguyen TT, Bien-Willner GA, Chen L, Foyil KV, Bartlett NL, Duncavage EJ, Hassan A, Frater JL, Kreisel F. CD163 immunohistochemistry is superior to CD68 in predicting outcome in classical Hodgkin lymphoma. Am J Clin Pathol. 2014 Mar;141(3):381-7. doi: 10.1309/AJCP61TLMXLSLJYS. PMID: 24515766.
- Arrindell J, Desnues B. Vimentin: from a cytoskeletal protein to a critical modulator of immune response and a target for infection. Front Immunol. 2023 Jul 5;14:1224352. doi: 10.3389/fimmu.2023.1224352. PMID: 37475865; PMCID: PMC10354447.
1
2
3
4
5
6
7
8
9
10
11
12
13
14
15
16
17
18
19
20
21
22
23
24
25
26
27
28
29
30
31
32
33
34
35
36
37
38
39
40
41
42
43
44
45
46
47
48
49
50
51
52
53
54
55
56
57
58
59
60
61
62
63
64
65
66
67
68
69
70
71
72
73
74
75
76
77
78
79
80
81
82
83
84
85
86
87
88
89
90
91
92
93
94
95
96
97
98
99
100
101
102
103
104
105
106
107
108
109
110
111
112
113
114
115
116
117
118
119
120
121
122
123
124
125
126
127
128
129
130
131
132
133
134
135
136
137
138
139
140
141
142
143
144
145
146
147
148
149
150
151
152
153
154
155
156
157
158
159
160
161
162
163
164
165
166
167
168
169
170
171
172
173
174
175
176
177
178
179
180
181
182
183
184
185
186
187
188
189
190
191
192
193
194
195
196
197
198
199
200
201
202
203
204
205
206
library(gridExtra)
library(ggplot2)
library(stats)
library(reshape2)
library(patchwork)
library(glue)
library(rlang)
library(Rtsne)
library(MASS)
library(ggpubr)
library(tidyverse)
library(ggridges)
library(viridis)
library(cowplot)
set.seed(42)

# Change this to your local directory where the data is stored
dir <-"./genomic-data-visualization-2025/data"
data <- read.csv(paste0(dir, "codex_spleen_3.csv.gz"))
head(data)
pos <- data[, 2:4]
exp <- data[, 5:ncol(data)]
# normalize the data and log transform
norm <- log10(exp/rowSums(exp)*mean(rowSums(exp)) + 1)
log(exp/data$area + 1)

# do elbow plot to determine the number of clusters
total_withiness <- c()
for (i in 1:10) {
  kmeans_res <- kmeans(norm, centers = i)
  total_withiness[i] <- kmeans_res$tot.withinss
}
g0 <- ggplot(data.frame(x = 1:10, y = total_withiness), aes(x = x, y = y)) +
  geom_line() +
  geom_point() +
  labs(title = "Scree plot for K-means clustering")
g0

# PCA
pcs <- prcomp(norm)
# t-SNE
set.seed(12)
tsne <- Rtsne(norm, 2)

# kmeans clustering
k <- 5
set.seed(12)
kmeans_res <- kmeans(norm, centers = k)
clusters_kmeans <- as.factor(kmeans_res$cluster)

clusters <- clusters_kmeans

# plot in space
g1 <- ggplot(norm, aes(x = pos$x, y = pos$y, color = clusters)) +
  geom_point(size=.75) +
  theme_minimal() +
  labs(title = "K-means clustering")
g1
# plot PCA
g2 <- ggplot(data.frame(x = pcs$x[, 1], y = pcs$x[, 2], cluster = clusters), aes(x = x, y = y, color = clusters)) +
  geom_point() +
  theme_minimal() +
  labs(title = "PCA")
g2
# plot t-SNE
g3 <- ggplot(data.frame(x = tsne$Y[, 1], y = tsne$Y[, 2], cluster = clusters), aes(x = x, y = y, color = clusters)) +
  geom_point() +
  theme_minimal() +
  labs(title = "t-SNE")
g3

# plot in 3D with PCA
library(plotly)

df <- data.frame(x = pcs$x[, 1], y = pcs$x[, 2], z = pcs$x[, 3], cluster = clusters)
g4 <- plot_ly(df, x = ~x, y = ~y, z = ~z, color = ~as.factor(cluster), type = "scatter3d", mode = "markers", size = 1) %>%
  layout(scene = list(
    xaxis = list(title = "PC1"),
    yaxis = list(title = "PC2"),
    zaxis = list(title = "PC3")
  ))
g4
# analyze the PCA loadings
var_explained <- pcs$sdev^2 / sum(pcs$sdev^2)
# print the cumulative variance explained by the first 6 PCs
g5 <- ggplot(data.frame(x = 1:length(pcs$sdev), y = cumsum(var_explained[1:length(pcs$sdev)])), aes(x = x, y = y)) +
  geom_line() +
  geom_point() +
  xlab("PC") +
  ylab("Cumulative variance explained") +
  # add xticks
  scale_x_continuous(breaks = seq(1, length(pcs$sdev), 1)) +
  labs(title = "Cumulative variance explained by the PCs")
g5
# grab the top 10 genes that contribute to PC1, PC2, and PC3
top_k <- 13
top_genes <- sapply(1:top_k, function(i) {colnames(norm)[order(abs(pcs$rotation[,i]), decreasing = TRUE)][1:10]})
# get the unique top genes in all PCs
top_gene_set <- unique(c(top_genes))
data.frame(top_gene_set)

# do this for top 10 genes
k <- length(top_gene_set)
print(k)
for (i in 1:k) {
  gene <- top_gene_set[i]
  norm_top <- norm[, top_gene_set[i]]
  # plot the ridgeline plot for the top 10 genes in each PC
  df <- data.frame( norm_top, clusters)
  df_melt <- melt(df)
  df_melt
  # plot histogram of the gene of interest for each cluster in one plot
  p <-ggplot(df_melt, aes(x=clusters, y=value, fill=clusters)) +
      geom_violin(alpha=0.6, position = 'identity') +
      # geom_boxplot(width=0.1, alpha=0.6, position = 'identity') +
    # add scatter plot
      # geom_jitter(width=0.01, alpha=0.2, c=clusters, stroke=0) +
      labs(fill="") +
    ggtitle(glue("Violin plot of {gene} expression in each cluster"))
  print(p)
}

# test on CD21
# * Ho: the cluster 1 and 3 are no different from the rest in the expression of CD21
# * Ha: the cluster 1 and 3 are different from the rest in the expression of CD21
# get the expression of CD21 in cluster 1 and 3
cd21_cluster_3 <- norm[clusters == 3, "CD21"]
# get the expression of CD21 in the rest of the clusters
cd21_rest <- norm[!(clusters %in% c(3)), "CD21"]
# perform the wilcox test
wilcox.test(cd21_cluster_3, cd21_rest)

# plot the expression of CD21 in cluster 3 in highlighted color and the rest of the clusters in gray
df <- data.frame(norm, clusters)
# create a one-hot encoding for the cluster 3
df$cluster_3 <- as.factor(ifelse(df$clusters == 3, 1, 0))
# add x-y coordinates to the data frame
df <- cbind(df, pos)
# plot the expression of CD21 in cluster 3 in highlighted color and the rest of the clusters in gray
g6.0 <- ggplot(df, aes(x = clusters, y = CD21, color = cluster_3)) +
  geom_boxplot() +
  labs(title = "Expression of CD21 in cluster 3")
g6.0
# plot in space coordinates in grayscale
g6 <- ggplot(df, aes(x = pos$x, y = pos$y, color = CD21)) +
  geom_point(size=.75, alpha=.5) +
  labs(title = "Expression of CD21 in spatial coordinates")
g6
g6.1 <- ggplot(df, aes(x = pos$x, y = pos$y, color = cluster_3)) +
  geom_point(size=.75, alpha=.5) +
  scale_color_grey(start = 1, end = 0) +
  labs(title = "Cluster 3 in spatial coordinates")
g6.1
g6_combined <- ggplot(df, aes(x = pos$x, y = pos$y)) +
  geom_point(aes(color = cluster_3, size = CD21), alpha = .5, ) +
  scale_fill_manual(values = c("red", "blue")) +
  scale_size_continuous(name = "CD21 Expression", range = c(0.01, 3)) +
  labs(title = "Overlay of CD21 Expression and Cluster 3 in Spatial Coordinates")

g6_combined

## test on CD163
# * Ho: the cluster 4 is no different from the rest in the expression of CD163
# * Ha: the cluster 4 different from the rest in the expression of CD163
# get the expression of CD8 in cluster 4
cd163_cluster_4 <- norm[clusters == 4, "CD163"]
# get the expression of CD8 in the rest of the clusters
cd163_rest <- norm[!(clusters %in% c(4)), "CD163"]
# perform the wilcox test
wilcox.test(cd163_cluster_4, cd163_rest)

# plot the expression of CD163 in cluster 4 in highlighted color and the rest of the clusters in gray
df <- data.frame(norm, clusters)
# create a one-hot encoding for the cluster 3
df$cluster_4 <- as.factor(ifelse(df$clusters == 4, 1, 0))
# add x-y coordinates to the data frame
df <- cbind(df, pos)
# plot the expression of CD21 in cluster 3 in highlighted color and the rest of the clusters in gray
g7.0 <-ggplot(df, aes(x = clusters, y = CD163, color = cluster_4)) +
  geom_boxplot() +
  labs(title = "Expression of CD163 in cluster 4")
g7.0
# plot in space coordinates in grayscale
g7 <- ggplot(df, aes(x = pos$x, y = pos$y, color = CD163)) +
  geom_point(size=.5, alpha=.5) +
  scale_color_viridis() +
  labs(title = "Expression of CD163 in spatial coordinates")
g7
g7.1 <- ggplot(df, aes(x = pos$x, y = pos$y, color = cluster_4)) +
  geom_point(size=.5, alpha=.5) +
  scale_color_grey(start = 1, end = 0) +
  labs(title = "Cluster 4 in spatial coordinates")
g7.1
g7_combined <- ggplot(df, aes(x = pos$x, y = pos$y)) +
  geom_point(aes(color = cluster_4), size = log2(df$CD163), alpha = .5, ) +
  scale_fill_manual(values = c("red", "blue")) +
  scale_size_continuous(name = "CD21 Expression", range = c(0.01, 3)) +
  guides(size = guide_legend("CD21 Expression",
                             override.aes = list(size = as.numeric(c(.5, .01, 3))))) +
  labs(title = "Overlay of CD163 Expression and Cluster 4 in Spatial Coordinates")

g7_combined

# Create a panel for publication
panel <- cowplot::plot_grid(g0, g1, g2, g3, g6.0, g6_combined, g7.0, g7_combined, nrow = 4)
panel