EC1

Description:
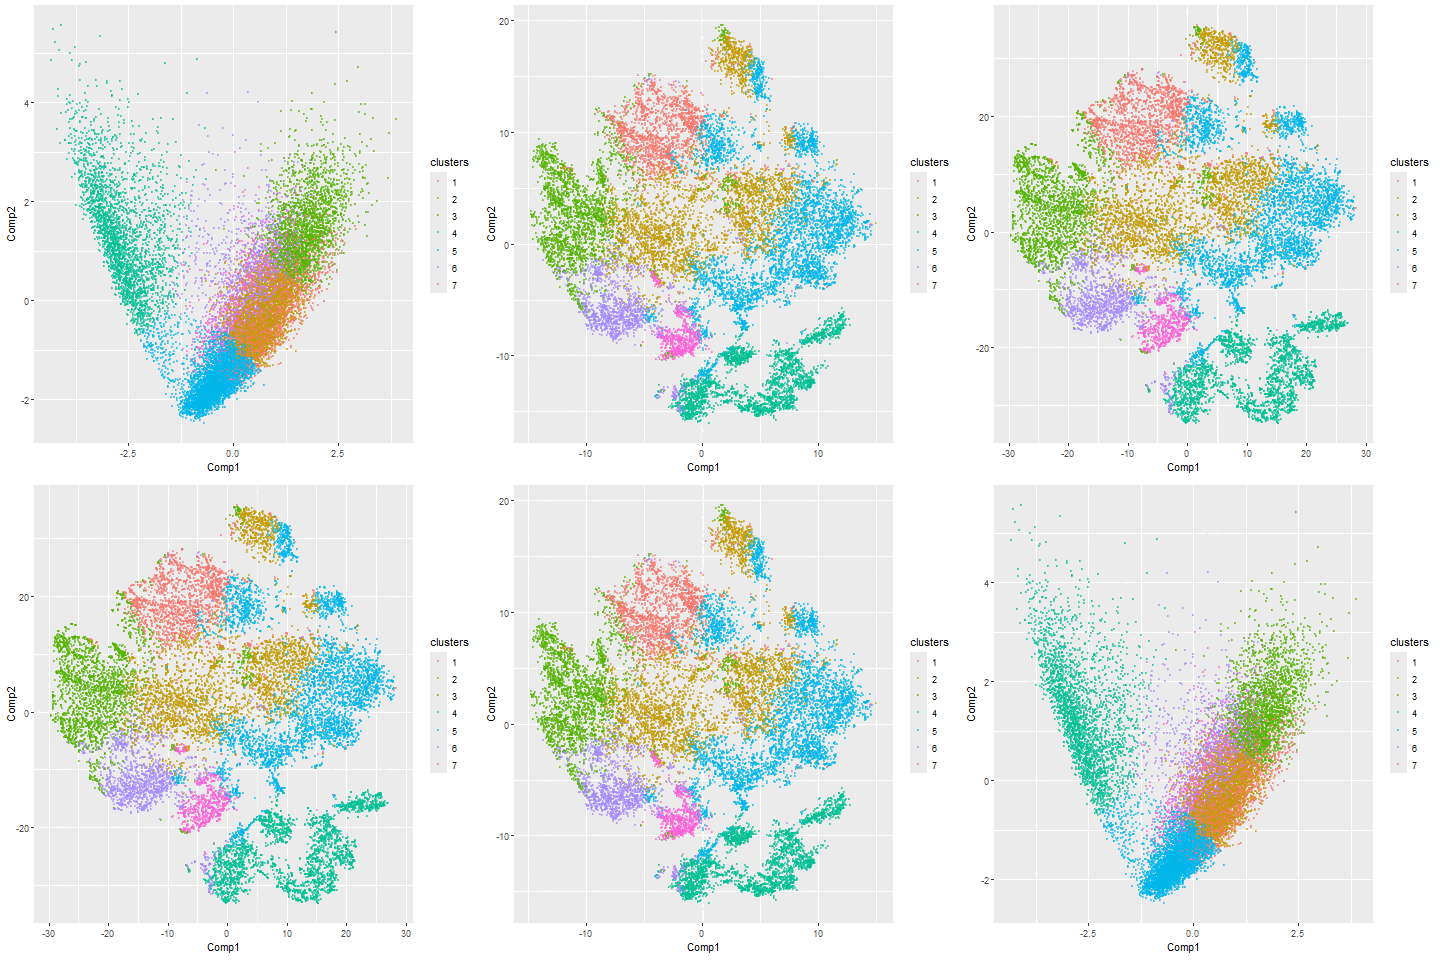
In my visualization, I am to make salient the difference in linear vs nonlinear dimensionality reduction techniques by visualizing the first two components of each in 2D space. Specifically, the techniques I used were PCA (first plot) and t-SNE (Second plot). The data was clustered first, then reduced in dimension. The corresponding data clusters are shown in the reduced component space. In t-SNE the spatial clusters seem overlaid on top of each other, but the points within the clusters themselves are quite close to each other. In PCA, the clusters are most localized to specific regions within the 2D representation of the components, but the points within the clusters themselves are not as close together. These visualization results make sense, as t-SNE primarily focuses on preserving relationships within clusters themselves.
Code:
1
2
3
4
5
6
7
8
9
10
11
12
13
14
15
16
17
18
19
20
21
22
23
24
25
26
27
28
29
30
31
32
33
34
35
36
37
38
39
40
41
42
43
44
45
46
47
48
library(ggplot2)
library(patchwork)
file <- 'C:\\Hopkins School Stuff\\GenomicDataVis\\data\\pikachu.csv.gz'
data <- read.csv(file)
data[1:5,1:10]
pos <- data[, 5:6]
rownames(pos) <- data$cell_id
head(pos)
gexp <- data[, 7:ncol(data)]
rownames(gexp) <- data$barcode
head(gexp)
head(pos)

loggexp <- log10(gexp + 1)

com <-kmeans(loggexp, centers=7)
clusters <- com$cluster
clusters <- as.factor(clusters)
names(clusters) <-rownames(gexp)
head(clusters)

pcs <-prcomp(loggexp)
#make individual plots
library(ggplot2)
df1<- data.frame(pcs$x[,1:2], clusters)
colnames(df1) <-c('Comp1','Comp2','clusters')
ggplot(df1, aes(x=Comp1, y=Comp2, col=clusters)) +geom_point()

df2 <-data.frame(pos, clusters)
colnames(df2) <- c('x','y','clusters')
ggplot(df2, aes(x=x, y=y, col=clusters)) +geom_point(size=.01, alpha=.5)


emb <- Rtsne::Rtsne(loggexp)
df_tsne <- data.frame(emb$Y, clusters)
colnames(df_tsne) <- c('Comp1','Comp2','clusters')
ggplot(df_tsne, aes(x = Comp1, y=Comp2, col=clusters)) + geom_point()
df<- rbind(
  cbind(df1, order=1),
  cbind(df_tsne, order=2)
)
head(df)
p<-ggplot(df, aes(x=Comp1, y=Comp2, col=clusters)) +geom_point(size=.01, alpha=.5)
library(gganimate)
anim <- p + transition_states(order) + view_follow()
animate(anim, height=300, width=300)
