Comparison of PCA and t-SNE Methods

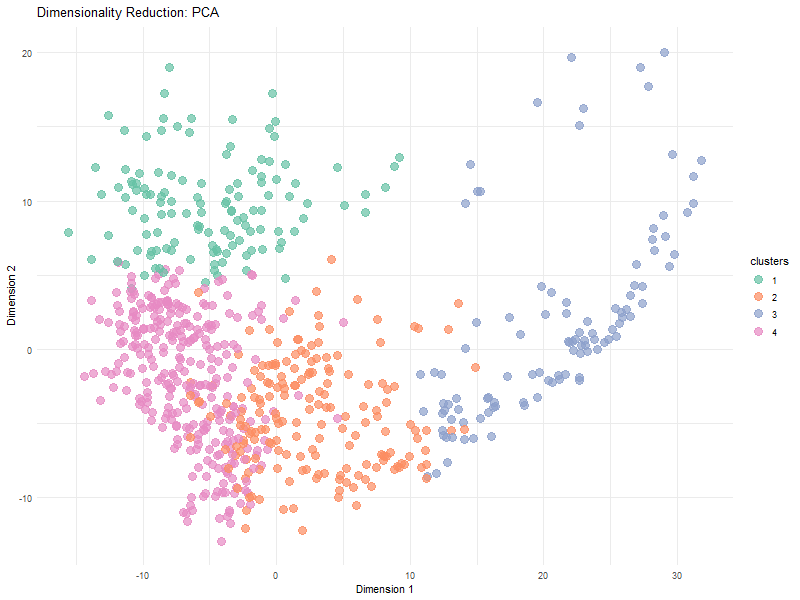
Visualization Summary In this visualization, I analyzed the differences between linear and nonlinear dimensionality reduction to visualized cells in the eevee dataset. The animation transitions between Principal Component Analysis and t-SNE representations, highlighting differences in cluster separation and the preservation of overall relationships. Specifically, t-SNE showed more distinct cluster separation due to its focus on local structure, while PCA was better representative of global relationships. Since t-SNE minimizes distortions in distances between nighboring data points, it preserves local relationships. However, since the distribution of t-SNE clusters is random, it is expected that we see visual differences in the plot between PCA and t-SNE.
Here, t-SNE and PCA data are being represented as points (based on the first two axes of each dimensionality reduction method). Different color hues were used to represent each cluster to make it easier to visualize the positions of the clusters, and the points in each cluster, as the animation goes between dimensionality reduction methods. The idea K for K means clustering was computed in via total withiness in a previous HW and found to be 4.
Code (paste your code in between the ``` symbols)
1
2
3
4
5
6
7
8
9
10
11
12
13
14
15
16
17
18
19
20
21
22
23
24
25
26
27
28
29
30
31
32
33
34
35
36
37
38
39
40
41
42
43
44
45
46
47
48
49
50
51
52
53
54
55
56
57
58
59
60
61
62
63
64
65
66
67
68
69
70
71
72
73
74
75
76
77
78
79
80
81
82
83
84
85
86
87
88
89
90
91
library(ggplot2)
library(dplyr)
library(tidyr)
library(RColorBrewer)
library(patchwork)
library(Rtsne)
library(gganimate)
library(scales)

file <- 'eevee.csv.gz'
data <- read.csv(file)
data[1:5,1:10]

# Load data and extract top 1000 most highly expressed genes
pos <- data[, 5:6]
rownames(pos) <- data$cell_id
gexp <- data[, 7:ncol(data)]
rownames(gexp) <- data$barcode
topgenes <- names(sort(colSums(gexp), decreasing=TRUE)[1:1000])
gene_data <- gexp[,topgenes]

gene_norm <- log10(gene_data * 10000 / rowSums(gene_data) + 1)

# K Means Clustering
com <- kmeans(gene_norm, centers=6)
clusters <- com$cluster
clusters <- as.factor(clusters)
names(clusters) <- rownames(gene_norm)
head(clusters)

pca_result <- prcomp(gene_norm, scale. = TRUE)
summary(pca_result)

df <- data.frame(pca_result$x, clusters)
p1 <- ggplot(df, aes(x = PC1, y = PC2, col = clusters)) +
  geom_point() +
  labs(title = "PCA of Eevee Clusters") +
  theme(
    panel.background = element_rect(fill = "white"),
    panel.grid.major = element_line(color = "lightgray"),
    panel.grid.minor = element_line(color = "lightgray")
  )


print(p1)

# PCA
df_pca <- data.frame(pca_result$x[,1:2], clusters, method="PCA")
colnames(df_pca)[1:2] <- c("Dim1", "Dim2")

# t-SNE
set.seed(42)
tsne_result <- Rtsne(gene_norm, perplexity=30, check_duplicates=FALSE)
df_tsne <- data.frame(tsne_result$Y, clusters, method="t-SNE")
colnames(df_tsne)[1:2] <- c("Dim1", "Dim2")

# Rescale t-SNE to match PCA range
df_tsne_scaled <- df_tsne %>%
  mutate(Dim1 = rescale(Dim1, to = range(df_pca$Dim1)),
         Dim2 = rescale(Dim2, to = range(df_pca$Dim2)))

# Combine datasets
df_combined <- rbind(df_pca, df_tsne_scaled)

# Animated Plot
anim <- ggplot(df_combined, aes(x = Dim1, y = Dim2, color = clusters)) +
  geom_point(size = 4, alpha = 1) +
  theme_minimal() +
  labs(title = 'Dimensionality Reduction: {closest_state}',
       x = 'Dimension 1',
       y = 'Dimension 2') +
  scale_color_brewer(palette = "Set2") +
  transition_states(method,
                    transition_length = 3,
                    state_length = 2) +
  theme(legend.position = "right")

anim <- anim + shadow_mark(past = TRUE, future = FALSE, alpha = 0.3)

anim <- anim + transition_states(method, transition_length = 4, state_length = 3) +
  ease_aes('cubic-in-out')

# Generate/save animation
anim_gif <- animate(anim,
                height = 600,
                width = 800,
                nframes = 150,
                fps = 30,
                renderer = gifski_renderer())

anim_save("ec1_sraghav9.gif", anim_gif)