1
2
3
4
5
6
7
8
9
10
11
12
13
14
15
16
17
18
19
20
21
22
23
24
25
26
27
28
29
30
31
32
33
34
35
36
37
38
39
40
41
42
43
44
| library(ggplot2)
library(stats) # for kmeans
library(reshape2) # for melt
library(Rtsne) # for tSNE
library(gganimate) # for animation
set.seed(42)
# Change this to your local directory where the data is stored
dir <-"./genomic-data-visualization-2025/"
pikachu_file <- "data/pikachu.csv.gz"
data_P <- read.csv(paste0(dir, pikachu_file))
# Picachu data
gexp_P <- data_P[, 7:ncol(data_P)]
# log transform the gexp data
log_gexp_P <- log2(gexp_P+1)
pos_P <- data_P[, 5:6]
# PCA
pca_P <- prcomp(log_gexp_P, scale=TRUE)
# tSNE
# emb_P <- Rtsne(log_gexp_P, dims=3, pca = TRUE, perplexity=30, verbose=FALSE)
# rename colums of the tSNE data
colnames(emb_P$Y) <- c("tSNE1", "tSNE2", "tSNE3")
# kmeans clustering
# do kmeans clustering on the log transformed data
k=7
kmeans_orig_P <- kmeans(log_gexp_P, centers=k)
clusters_P <- as.factor(kmeans_orig_P$cluster)
# add the x-y coordinates to the data frame
# df_P <- cbind(data_P[, 1:6], log_gexp_P, pca_P$x[, 1:3], emb_P$Y, clusters_P)
# head(df_P)
df_1 <- data.frame(x = pos_P$aligned_x, y = pos_P$aligned_y, cluster = clusters_P)
df_2 <- data.frame(x = pca_P$x[,1], y = pca_P$x[,2], cluster = clusters_P)
df_3 <- data.frame(x = emb_P$Y[,1], y = emb_P$Y[,2], cluster = clusters_P)
df <- rbind(cbind(df_1, order=1), cbind(df_2, order = 2), cbind(df_3, order = 3))
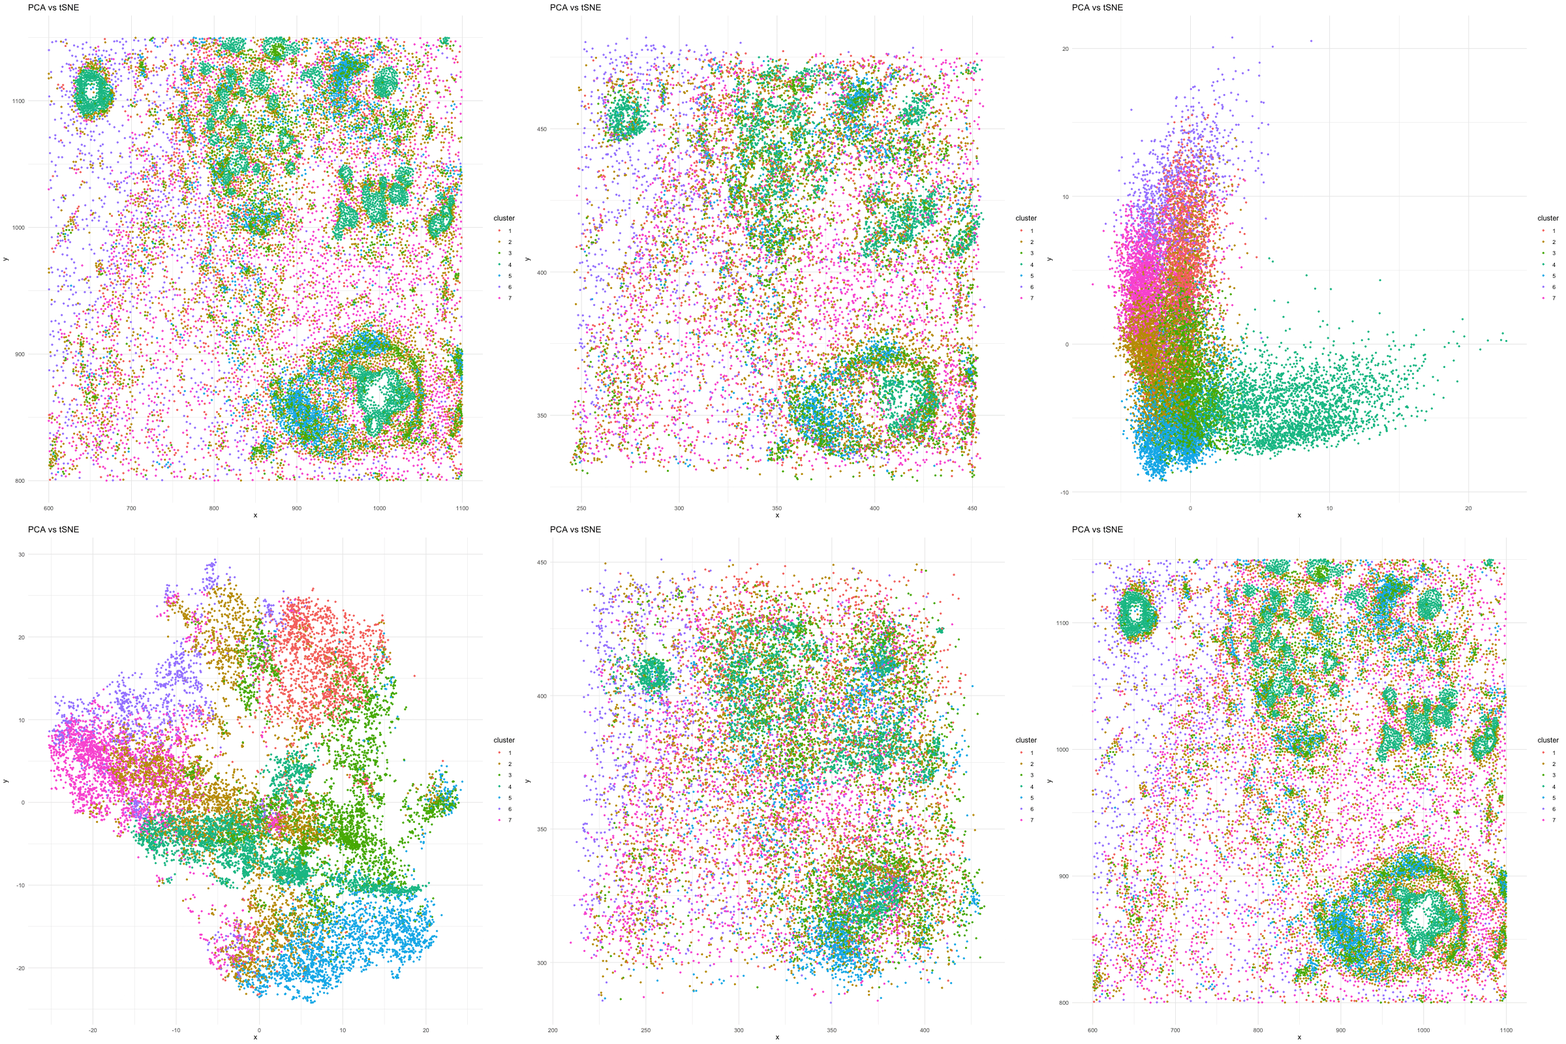
p <- ggplot(df, aes(x = x, y = y, color = cluster)) + geom_point(size=.75) # + facet_wrap(~order) + theme_minimal()
anim <- p + transition_states(order) + view_follow() + enter_fade() + exit_fade() + labs(title = 'PCA vs tSNE') + theme_minimal()
gif <- animate(anim, height = 800, width = 800)
gif
|

