HW5: Identifying Cell Types and Tissue Structures in CODEX data

1. Figure Description.
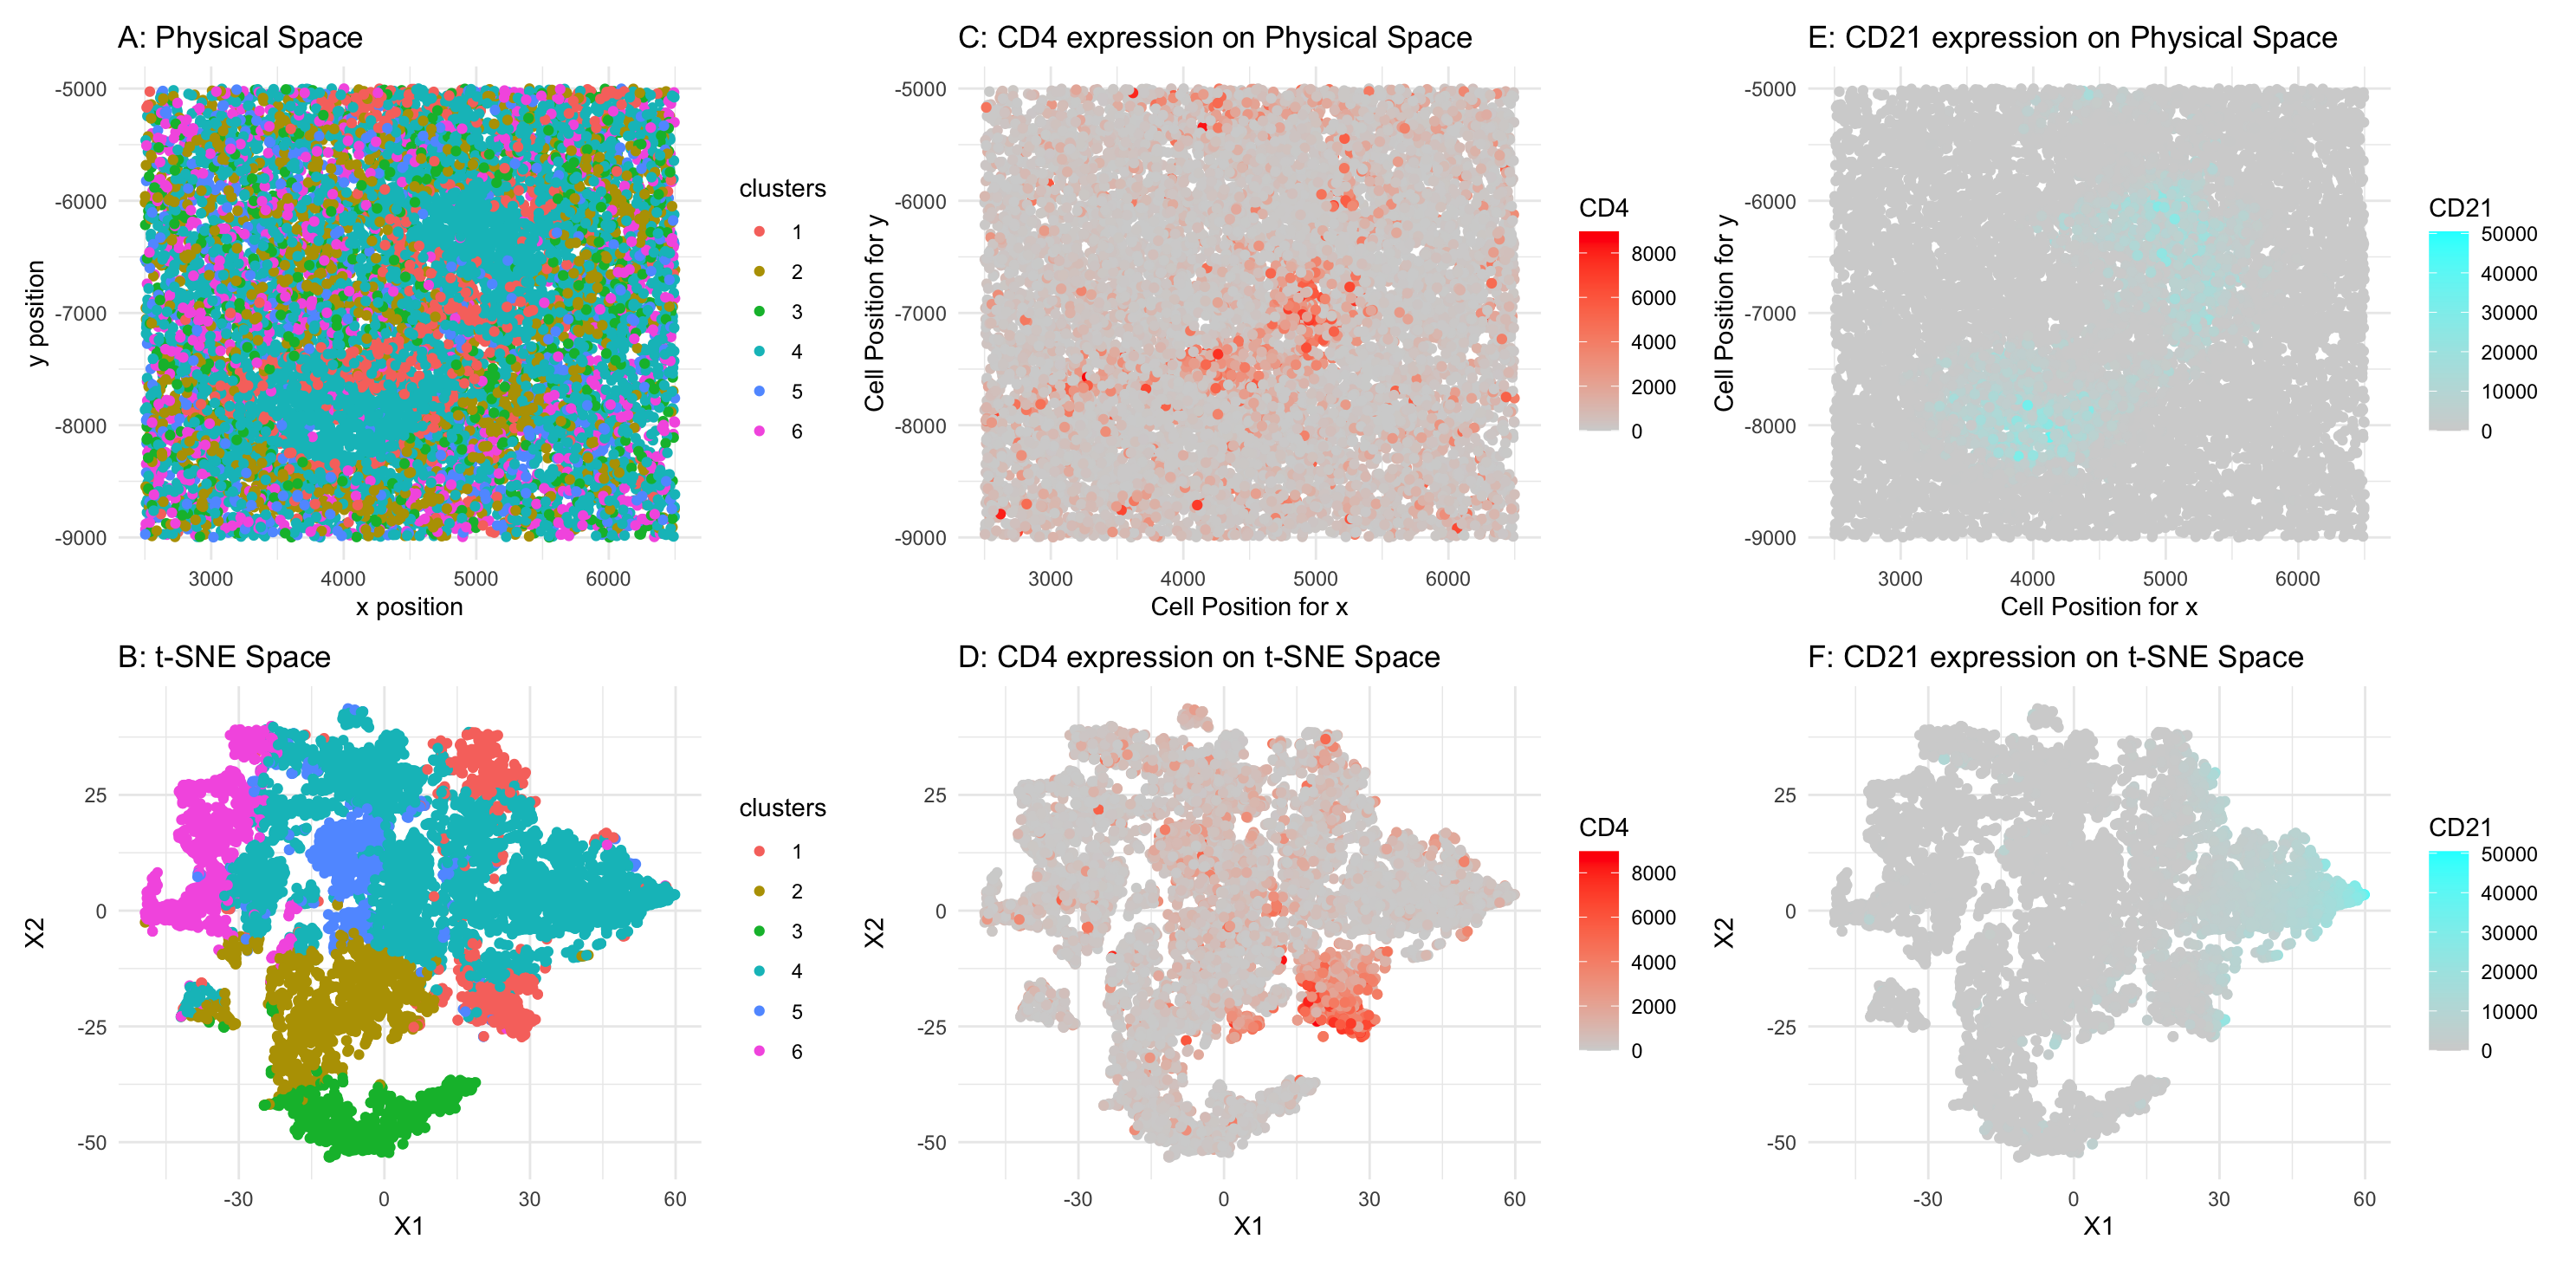
Figure A: 6 clusters in physical space. The axes represent x and y position. Figure B: 6 clusters in t-SNE space. The axes represent X1 and X2. Figure C: CD4 expression on physical space. The axes represent x and y position. Figure D: CD2 expression on t-SNE space. The axes represent X1 and X2. Figure E: CD21 expression on physical space. The axes represent x and y position. Figure F: CD21 expression on t-SNE space. The axes represent X1 and X2.
2. Tissue Structure Identification.
I believe the tissue presented in the CODEX dataset is white pulp. Observing the physical space, the K-means clustering reveals a clear pattern: Cluster 4 forms two dense cell regions, while Cluster 1 surrounds Cluster 4.
To further investigate, I performed differential gene expression analysis. The results for Cluster 4 show that many upregulated genes (CD21, CD20, CD1c, CD35, HLA-DR, CD44, CD11c, CD34) are primarily expressed in B cells. Additionally, in the spatial layout, CD21 is highlighted in blue around the Cluster 1 region. Based on these findings, Cluster 4 is likely composed of B cells.
For Cluster 1, which forms a surrounding layer around Cluster 4, differential gene expression analysis reveals upregulated markers such as SMActin, CD4, CD45, PanCK, CD3e, CD45RO, CD35, CD20, CD44, CD5, HLA-DR, Podoplanin, Collagen IV, CD21, CD11c, ECAD, and CD1c. Some of these markers are associated with B cells, while others correspond to T cells and epithelial cells. Given the close proximity of Clusters 1 and 4, it is possible that some B cell markers from Cluster 4 are also detected in Cluster 1. However, Cluster 1 exhibits strong T cell markers, suggesting that it is primarily composed of T cells
Based on prior research, white pulp in the spleen consists of:
1
2
3
1.	A germinal center, primarily made up of B cells.

2.	Periarteriolar lymphoid sheaths (PALS), which are rich in T cells.
This aligns well with the clustering results:
1
2
3
•	Cluster 4 forms a dense center of B cells.

•	Cluster 1, composed of T cells and some B cells, surrounds this center.
Thus, this tissue should be white pulp.
3. Citation.
https://pubmed.ncbi.nlm.nih.gov/28283679/#:~:text=Introduction%3A%20CD52%20(Campath%2D1,and%20dendritic%20cells%20(DCs). https://clinicalinfo.hiv.gov/en/glossary/cd4-t-lymphocyte#:~:text=A%20type%20of%20lymphocyte.,cells)%2C%20to%20fight%20infection. https://www.sciencedirect.com/science/article/abs/pii/S1567576900000461#:~:text=The%20Complement%20Receptor%20Type%202,of%20the%20C3%20complement%20protein. https://medlineplus.gov/lab-tests/cd4-lymphocyte-count/ https://pmc.ncbi.nlm.nih.gov/articles/PMC1828535/
4. Code
1
2
3
4
5
6
7
8
9
10
11
12
13
14
15
16
17
18
19
20
21
22
23
24
25
26
27
28
29
30
31
32
33
34
35
36
37
38
39
40
41
42
43
44
45
46
47
48
49
50
51
52
53
54
55
56
57
58
59
60
61
62
63
64
65
66
67
68
69
70
71
72
73
74
75
76
77
78
79
80
81
82
83
84
85
86
87
88
89
90
91
92
93
94
95
96
97
98
99
100
101
102
103
104
105
106
107
108
109
110
111
112
113
114
115
116
117
118
119
120
121
122
123
124
125
126
127
128
129
130
131
132
133
134
135
136
137
138
139
140
141
142
143
144
145
146
147
148
149
150
151
152
153
154
155
156
157
158
159
160
161
162
163
164
165
166
167
168
169
170
171
172
173
174
175
176
177
178
library(ggplot2)
library(patchwork)

file <- "~/Desktop/data visualization/codex_spleen_3.csv.gz"
data <- read.csv(file)
data[1:5,1:10]
dim(data)


pos <- data[, 2:3]
rownames(pos) <- data$X
gexp <- data[, 5:ncol(data)]
rownames(gexp) <- data$X
head(gexp)
head(pos)

# normalization
norm <- gexp/log10(data$area+1) * 3
norm[1:5,1:5]


## kmeans
ks = 1:25
totw <- sapply(ks, function(k) {
  print(k)
  com <- kmeans(norm, centers=k)
  return(com$tot.withinss)
})
g1 <- plot(ks, totw)

com <- kmeans(norm, centers=6)
clusters <- com$cluster
clusters <- as.factor(clusters)
names(clusters) <- rownames(norm)
head(clusters)

df <- data.frame(pos, clusters)
g1 <- ggplot(df, aes(x=x, y=y, col=clusters)) + geom_point() +
  labs(title = "A: Physical Space", x = "x position", y = "y position")+ theme_minimal()

ggplot(df, aes(x=x, y=y, col=clusters)) + geom_point() +
  labs(title = "A: Physical Space", x = "x position", y = "y position") + theme_minimal()

# PCA
pcs <- prcomp(norm)
df <- data.frame(pcs$x,clusters)
ggplot(df, aes(x=PC1, y=PC2, col= clusters)) + geom_point()

# t-SNE
emb <- Rtsne::Rtsne(norm)
df <- data.frame(emb$Y, clusters)
ggplot(df, aes(x = X1, y=X2, col=clusters)) + geom_point() +
  labs(title = "B: t-SNE Space") + theme_minimal()
g2 <- ggplot(df, aes(x = X1, y=X2, col=clusters)) + geom_point() +
  labs(title = "B: t-SNE Space") + theme_minimal()

g1 + g2

# Cluster 4 unregulated: CD21, CD20, CD1c, CD35, HLA.DR, CD44, CD11c, CD34
# CD21: B cells, DCs
# CD20: B cells
# CD1c: B cells, DCs, monocytes
# HLA.DR: B cells, DCs, macrophages
# CD35:  B cells, DC
# CD34: hematopoietic cells
# CD11c: DC, immune cells
# CD44: immune cells, epithelial cells
cellsOfInterest <- names(clusters)[clusters == 4]
otherCells <- names(clusters)[clusters != 4]

results <- sapply(1:ncol(norm), function(i) {
  genetest <- norm[,i]
  names(genetest) <- rownames(norm)
  out <- t.test(genetest[cellsOfInterest], genetest[otherCells], alternative = 'greater')
  out$p.value
})

names(results) <- colnames(norm)
results <- sort(results, decreasing = FALSE)
results


df <- data.frame(emb$Y, clusters, gene = norm[, 'CD21'])
g5<- ggplot(df, aes(x=X1, y=X2, col=gene)) + labs(title = "F: CD21 expression on t-SNE Space", col = "CD21") +
  scale_color_gradient(low = 'lightgrey', high = 'cyan') + geom_point() + theme_minimal()

df <- data.frame(pos, gene = norm[, 'CD21'])
g6 <- ggplot(df, aes(x = x, y = y, col = gene)) +
  labs(title = "E: CD21 expression on Physical Space ",
       x = "Cell Position for x",
       y = "Cell Position for y",
       col = "CD21") + scale_color_gradient(low = 'lightgrey', high = 'cyan') +
  geom_point() + theme_minimal()


# Cluster 1 unregulated: SMActin, CD4, CD45, PanCK, CD3e, CD45RO, CD35, CD20, CD44, CD5
# HLA.DR, Podoplanin, CollagenIV, CD21, CD11c, ECAD, CD1c
# SMActin: smooth muscle cells
# CD4: T cells
# CD45: hema cells
# PanCK: epithelial cells
# CD3e: T cell
# CD45RO: memory T cell
# CD35, 20: B cell
# Podoplanin: epidermis and dermis cells
cellsOfInterest <- names(clusters)[clusters == 1]
otherCells <- names(clusters)[clusters != 1]

results <- sapply(1:ncol(norm), function(i) {
  genetest <- norm[,i]
  names(genetest) <- rownames(norm)
  out <- t.test(genetest[cellsOfInterest], genetest[otherCells], alternative = 'greater')
  out$p.value
})

names(results) <- colnames(norm)
results <- sort(results, decreasing = FALSE)
results

df <- data.frame(emb$Y, clusters, gene = norm[, 'CD4'])
g3 <- ggplot(df, aes(x=X1, y=X2, col=gene)) + labs(title = "D: CD4 expression on t-SNE Space", col = "CD4") +
  scale_color_gradient(low = 'lightgrey', high = 'red') + geom_point() + theme_minimal()
ggplot(df, aes(x=X1, y=X2, col=gene)) + labs(title = "D: CD4 expression on t-SNE Space", col = "CD4") +
  scale_color_gradient(low = 'lightgrey', high = 'red') + geom_point() + theme_minimal()


df <- data.frame(pos, gene = norm[, 'CD4'])
g4 <- ggplot(df, aes(x = x, y = y, col = gene)) +
  labs(title = "C: CD4 expression on Physical Space ",
       x = "Cell Position for x",
       y = "Cell Position for y",
       col = "CD4") + scale_color_gradient(low = 'lightgrey', high = 'red') +
  geom_point() + theme_minimal()
ggplot(df, aes(x = x, y = y, col = gene)) +
  labs(title = "C: CD4 expression on Physical Space ",
       x = "Cell Position for x",
       y = "Cell Position for y",
       col = "CD4") + scale_color_gradient(low = 'lightgrey', high = 'red') +
  geom_point() + theme_minimal()

g1 + g4 + g6 + g2 + g3 + g5

# Cluster 2 unregulated: CD15, Ki67, CD163
# CD163: macrophage
# Ki67: dividing cells
# CD15: myeloid cells
cellsOfInterest <- names(clusters)[clusters == 2]
otherCells <- names(clusters)[clusters != 2]

results <- sapply(1:ncol(norm), function(i) {
  genetest <- norm[,i]
  names(genetest) <- rownames(norm)
  out <- t.test(genetest[cellsOfInterest], genetest[otherCells], alternative = 'greater')
  out$p.value
})

names(results) <- colnames(norm)
results <- sort(results, decreasing = FALSE)
results

#
cellsOfInterest <- names(clusters)[clusters == 3]
otherCells <- names(clusters)[clusters != 3]

results <- sapply(1:ncol(norm), function(i) {
  genetest <- norm[,i]
  names(genetest) <- rownames(norm)
  out <- t.test(genetest[cellsOfInterest], genetest[otherCells], alternative = 'greater')
  out$p.value
})

names(results) <- colnames(norm)
results <- sort(results, decreasing = FALSE)
results