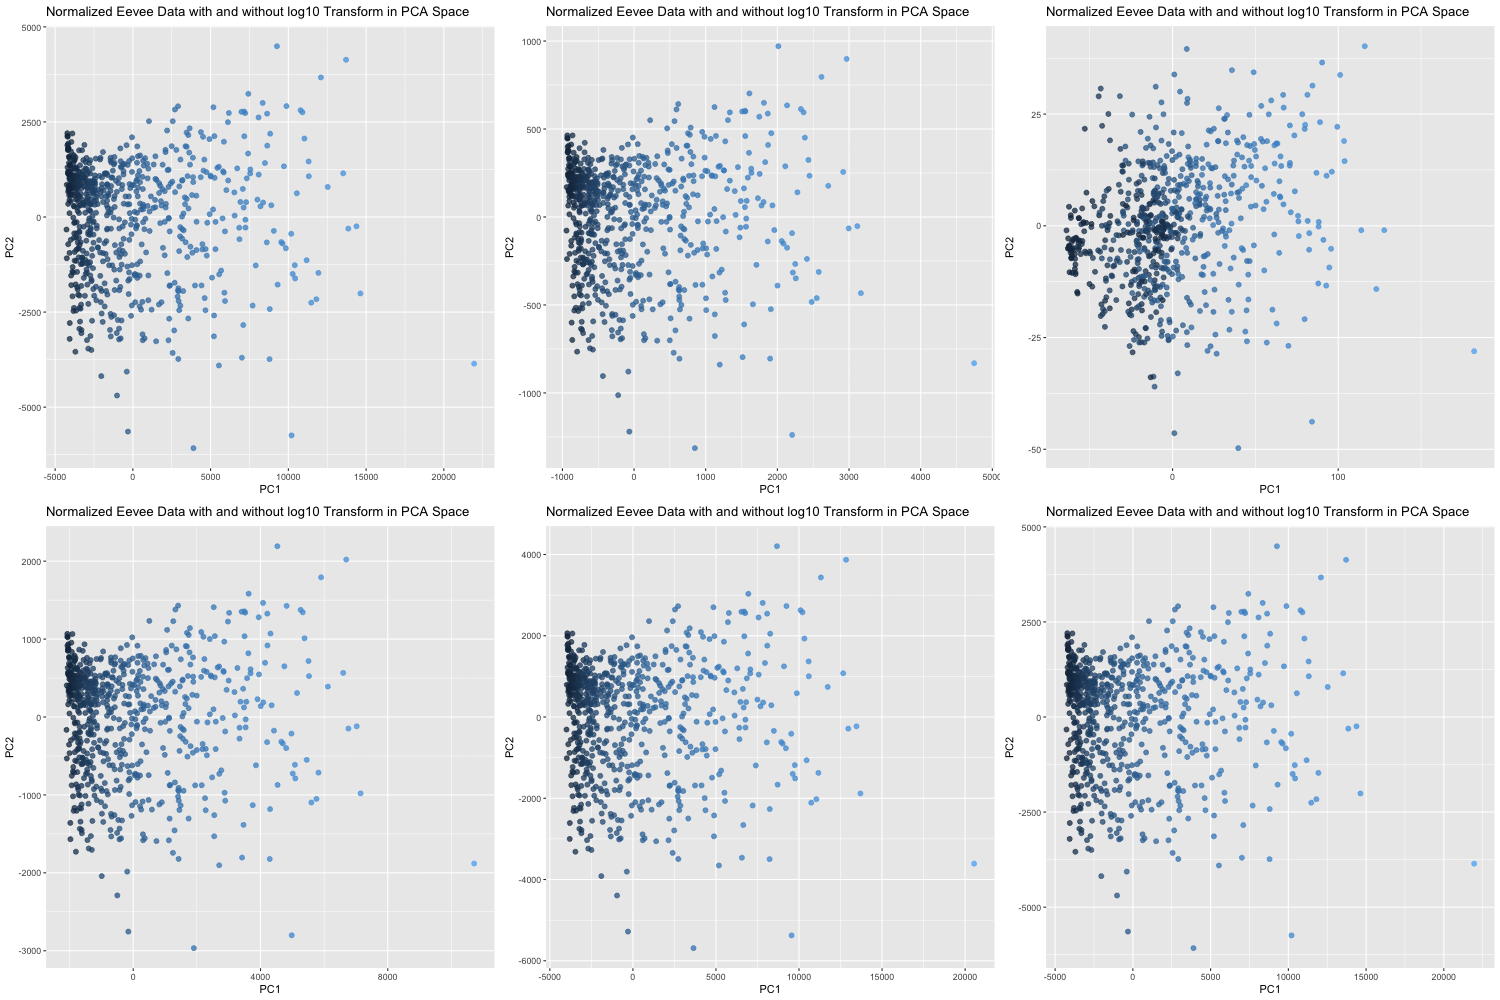
Normalized Eevee Data in PCA Space with and without Log10 Transformation

This animated visualization makes salient the answer to ‘What happens if I do or not log10 transform the normalized gene expression data prior to dimensionality reduction?’. The beginning of the animation shows the normalized data without log10 transform in PCA reduced dimensional space, and the end shows the normalized data with log10 transform in the PCA space. The color of each data point is determined by their PC1 value in the first visualization (without log10 transform), so that it is easy to follow each point’s movement between the two charts and visualize how the spread of data changes between the two. This animation shows that the use of log10 transform on the normalized data is likely benefitial because it spreads out the data in the first two PCs, which agrees with our understanding that using log10 transform is more biologically relevant since we are looking for fold changes in gene expression more than numerical ones.
1
2
3
4
5
6
7
8
9
10
11
12
13
14
15
16
17
18
19
20
21
22
23
24
25
26
27
28
29
30
31
32
33
34
35
36
37
38
39
40
41
install.packages('gganimate')
install.packages('gifski')

file <- '/Users/alexgorham/Desktop/genomic-data-visualization-2025/data/eevee.csv.gz'
data <- read.csv(file)
data[1:5,1:5]

pos <- data[,3:4]
rownames(pos) <-data$barcode
gexp <- data[,5:ncol(data)]
rownames(gexp) <- data$barcode

norm <- (gexp/rowSums(gexp))*100000
lognorm <- log10(norm+1)

pcs <- prcomp(norm)
pcs_log <- prcomp(lognorm)

library(ggplot2)
initial_pc1 <- log10(pcs$x[,1]+5000) #to spread out the color of the points

df1 <- data.frame(pcs$x[,1:2], initial_pc1)
colnames(df1) <- c('PC1', 'PC2', 'index')
ggplot(df1, aes(x = PC1, y = PC2, col = index)) + geom_point(size = 1)

df2 <- data.frame(pcs_log$x[,1:2], initial_pc1)
colnames(df2) <- c('PC1', 'PC2', 'index')
ggplot(df2, aes(x = PC1, y = PC2, col = index)) + geom_point(size = 1)

df <- rbind(
  cbind(df1, order = 1),
  cbind(df2, order = 2)
)
head(df)
p <- ggplot(df, aes(x = PC1, y = PC2, col = index)) + geom_point(size = 2, alpha = 0.75) +
  theme(legend.position = "none") + labs(title = 'Normalized Eevee Data with and without log10 Transform in PCA Space')

library(gganimate)
anim <- p + transition_states(order) + view_follow() + ease_aes('cubic-out')
animated <- animate(anim, renderer = gifski_renderer(), height = 500, width = 500)
anim_save("agorham3.gif", animation = animated)
