HW1 Submission

1. What data types are you visualizing?
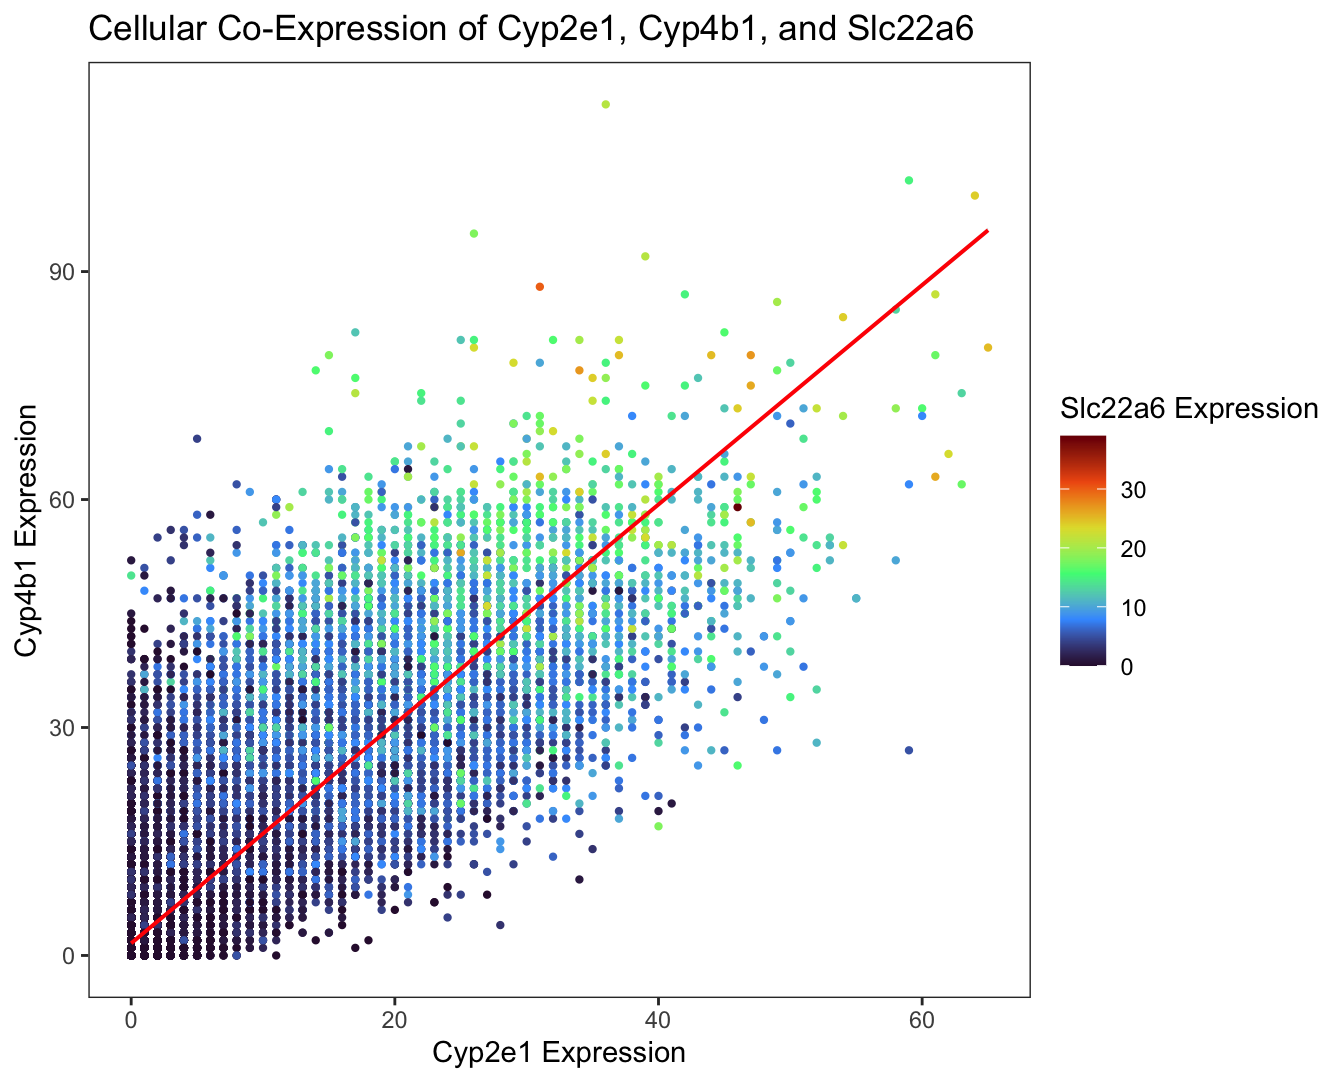
I am visualizing quantitative data of the gene expression counts of the Cyp2e1, Cyp4b1, and Slc22a6 genes for each cell.
2. What data encodings (geometric primitives and visual channels) are you using to visualize these data types?
I am using the geometric primitive of points to plot each cell. I am using the geometric primitive of a line to represent the linear regression between the expression counts of the Cyp2e1 and Cyp4b1 genes. I am using the visual channel of position along the x-axis to encode the expression count of the Cyp2e1 gene. I am using the visual channel of position along the y-axis to encode the expression count of the Cyp4b1 gene. I am using the visual channel of hue, going through the turbo color palette from magenta to red, to encode the expression count of the Slc22a6 gene. I am using the visual channel of angle for the line of best fit to encode the positive linear relationship between the expression counts of the Cyp2e1 and Cyp4b1 genes.
3. What about the data are you trying to make salient through this data visualization?
I am trying to make salient the positive linear relationship between Cyp2e1 and Cyp4b1 gene expression for each cell through this data visualization. Additionally, I am trying to make salient the positive relationship between the expression of the aforementioned two genes and Slc22a6 in each cell. Therefore, cells with increased Cyp2e1 and Cyp4b1 expression tend to have greater Slc22a6 expression, and vice versa, demonstrating the co-expression of these three genes.
4. What Gestalt principles or knowledge about perceptiveness of visual encodings are you using to accomplish this?
I am using the Gestalt principle of continuity, where related elements tend to be perceived as continuous lines. By plotting a continuous line of best fit, I make salient the trend of positive linearity between Cyp2e1 and Cyp4b1 gene expression among the cells. Also, I am using the Gestalt principle of similarity, where items alike in their visual channels, specifically hue in this instance, tend to be perceived as being in a related group. By implementing a color scale where similar gene expression counts correspond to similar hues, I make salient the cells with increased and decreased Slc22a6 gene expression. Moreover, I am using the Gestalt principle of proximity, where items that are near each other tend to be perceived as being a related group. By plotting points representing each cell, I make salient the dense clusters of cells that have similar gene co-expressions, along with the sparse dispersions of cells that have unique gene co-expressions.
5. Code (paste your code in between the ``` symbols)
1
2
3
4
5
6
7
8
9
10
11
12
13
14
15
16
17
18
19
20
21
22
library(ggplot2)
data <- read.csv('~/Documents/genomic-data-visualization-2026/data/Xenium-IRI-ShamR_matrix.csv.gz')

# Preliminary investigation of the data was conducted using Dr. Fan's code from Lecture 1 and prompts to AI, such as
# "Given a data frame 'data' from Xenium where the first column is cell number (cell 1, cell 2, cell 3, ...), the second and
# third columns are spatial positional information (x, y), and the fourth column and beyond are quantitative data of each
# gene's expression across a population of cells, create a function that figures out the top 5 combination of two genes with
# the highest coefficient of determination values of co-expression in the same cell."
# These explorations led to the determination of the Cyp2e1, Cyp4b1, and Slc22a6 genes as candidates for representation;
# from that point onward, I conceived and designed the data visualization myself.

ggplot(data, aes(x = Cyp2e1, y = Cyp4b1, color = Slc22a6)) +
  geom_point(size = 0.8) +
  geom_smooth(method = "lm", color = "red", size = 0.7) +
  scale_color_viridis_c(option = "turbo") +
  labs(
    title = paste("Cellular Co-Expression of Cyp2e1, Cyp4b1, and Slc22a6"),
    x = paste("Cyp2e1 Expression"),
    y = paste("Cyp4b1 Expression"),
    color = paste("Slc22a6 Expression")
  ) +
  theme_test()