Spatial Expression of Cyp4b1 in Kidney

1. What data types are you visualizing?
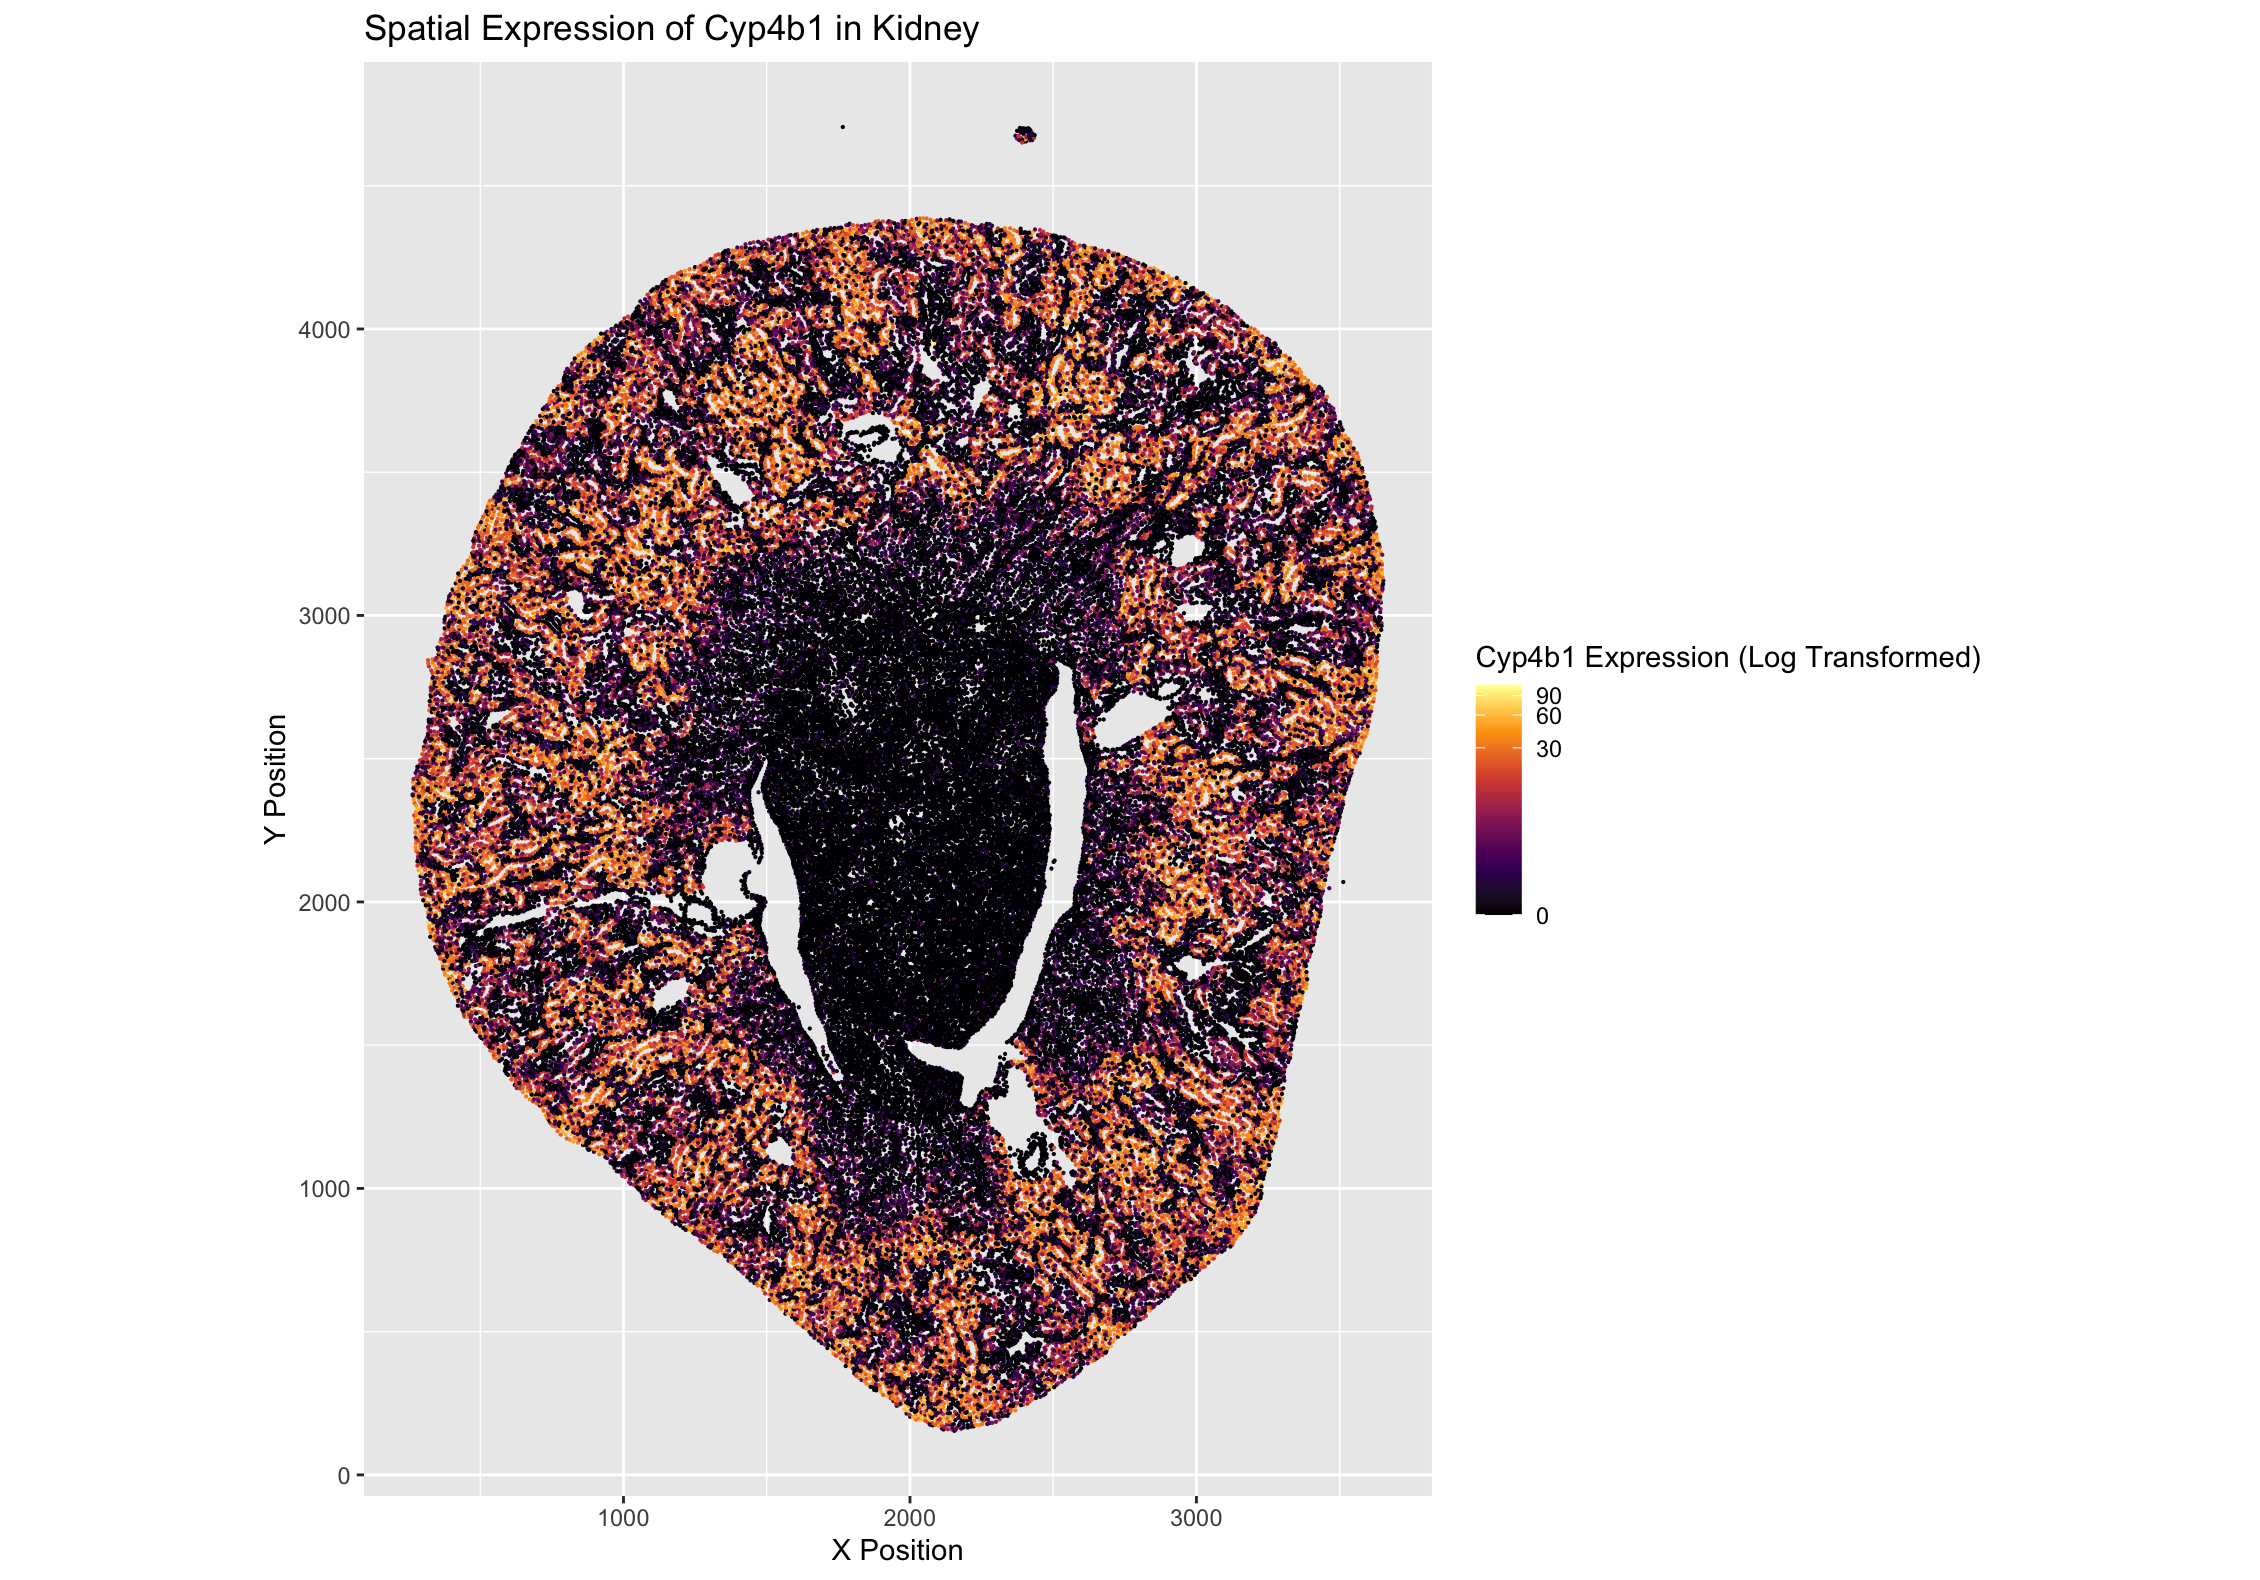
I am visualizing quantitative data in terms of the gene expression levels of Cyp4b1 in each cell across the kidney sample and spatial data of their respective x and y positions.
2. What data encodings (geometric primitives and visual channels) are you using to visualize these data types?
I am using points as a geometric primitive to represent each cell in the tissue. I am using the visual channel of color, more specifically hue, to represent the relative expression level of Cyp4b1 in each cell. Additionally, the visual channel of position communicates the location of each cell along the x and y axes.
3. What about the data are you trying to make salient through this data visualization?
Through this visualization, I am trying to make salient the spatial relationship of Cyp4b1 expression across the cells in this kidney tissue sample, allowing the viewer to easily perceive areas of high and low Cyp4b1 expression.
4. What Gestalt principles or knowledge about perceptiveness of visual encodings are you using to accomplish this?
I am utilizing the Gestalt principle of similarity to convey the different expression levels of Cyp4b1 across the tissue, as cells with similar colors have similar expression levels. Also, the spatial nature of the data itself allows for my visualization to highlight the Gestalt principle of proximity, as cell clusters with similar expression levels allow spatial patterns in the kidney to be easily revealed.
5. Code (paste your code in between the ``` symbols)
1
2
3
4
5
6
7
8
9
10
11
12
13
14
15
16
17
18
19
20
21
22
23
24
25
26
27
28
29
# set working directory
setwd("/Users/gracexu/genomic-data-visualization-2026")

# load libraries
library(ggplot2)

# load in Visium (single-cell) data
data <- read.csv("/Users/gracexu/genomic-data-visualization-2026/data/Xenium-IRI-ShamR_matrix.csv")
dim(data)
head(data)

pos <- data[,c('x','y')] #position data
rownames(pos) <- data[,1]
gexp <- data[, 4:ncol(data)] #gene expression data
rownames(gexp) <- data[,1]
dim(gexp)

# data visualization
ggplot(data, aes(x = x, y = y, color = Cyp4b1)) +
  geom_point(size = 0.75, stroke = 0) +
  coord_fixed() +
  scale_color_viridis_c(
    option = "inferno", #chose this color pack for the most contrast
    trans = "log1p" #log transformed to better show gene expression spatial pattern
  ) +
  labs(title = "Spatial Expression of Cyp4b1 in Kidney",
       x = "X Position",
       y = "Y Position",
       color = "Cyp4b1 Expression (Log Transformed)")
(Please do not copy. I did not do a good job on this HW.)