HW1

1. What data types are you visualizing?
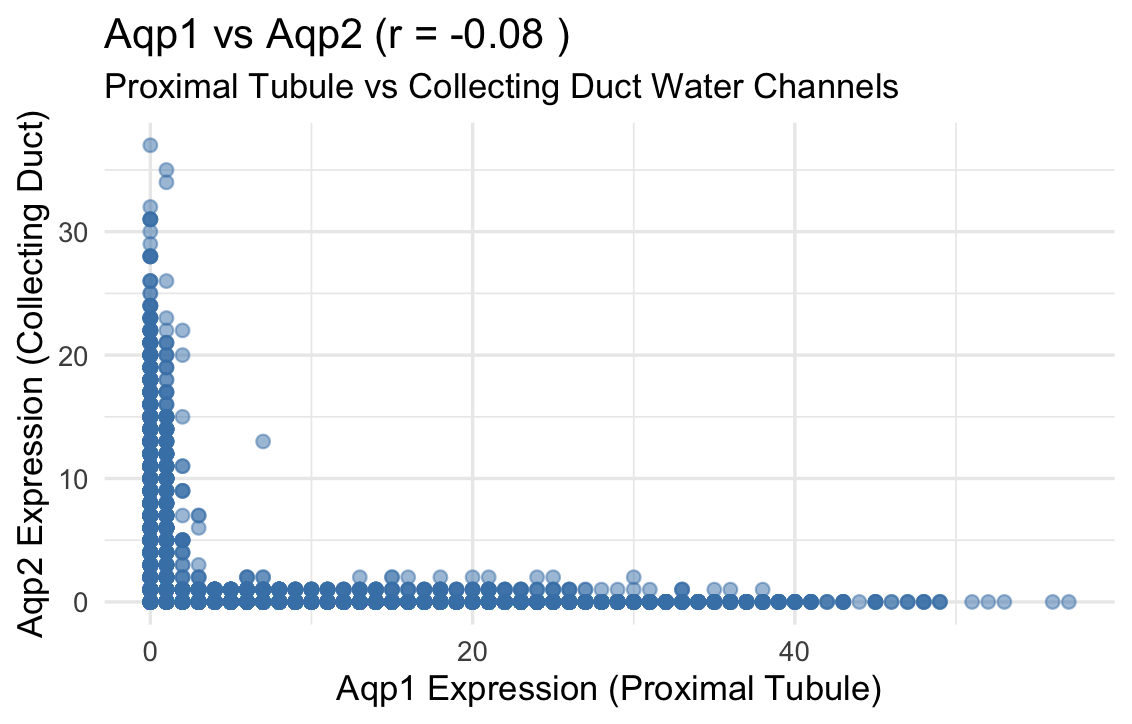
I am visualizing quantitative data representing the expression levels of two genes, Aqp1 and Aqp2, for individual cells. Categorical data is the 2 genes Aqp1 and Aqp2.
2. What data encodings (geometric primitives and visual channels) are you using to visualize these data types?
The geometric primitive used in this visualization is points, where each point represents one cell. The visual channels used are position, with horizontal position encoding Aqp1 expression and vertical position encoding Aqp2 expression. Transparency is also used as a visual channel to reduce overplotting and improve readability.
3. What about the data are you trying to make salient through this data visualization?
I tried to visualize the relationship between Aqp1 and Aqp2 expression. In particular, it is clear that there is very little correlation between the two genes, as shown by the scattered distribution of points and the low correlation value. They do not co-exist in the same space because one is found in the proximal tubule and the other in the collecting duct.
4. What Gestalt principles or knowledge about perceptiveness of visual encodings are you using to accomplish this?
The visualization applies the Gestalt principle of similarity, since all points share the same shape and color and are perceived as belonging to the same group. It also uses the principle of proximity, as points that are close together form visible clusters representing cells with similar expression levels. In addition, position on a common scale is used, which is one of the most accurate visual encodings for quantitative data and helps viewers compare expression values efficiently.
5. Code
1
2
3
4
5
6
7
8
9
10
11
12
13
14
15
16
17
18
19
20
21
22
23
24
25
26
27
28
29
30
31
32
33
34
35
36
37
38
39
40
41
42
43
44
45
46
47
48
49
50
51
52
53
54
55
56
57
58
59
60
61
62
63
64
65
66
67
68
69
70
71
72
73
74
75
76
#Xenium-IRI-ShamR_matrix.csv.gz

data <- read.csv("~/Desktop/Xenium-IRI-ShamR_matrix.csv.gz")

dim(data)
class(data)
head(data)
data[1:5, 1:5]
pos <- data[,c('x','y')]
rownames(pos) <- data[,1]
head(pos)
gexp <- data[, 4:ncol(data)]
rownames(gexp) <- data[,1]
gexp[1:5,1:5]

install.packages('ggplot2')
library(ggplot2)


##help from CHATGPT:
# This script analyzes gene expression data stored in a data frame
# called `gene_data` with columns `Aqp1` and `Aqp2`.
#
# Please generate R code using ggplot2 that does ONLY the following:
#
# 1. Compute and print the mean and median for Aqp1 and Aqp2.
# 2. Compute and print the Pearson correlation coefficient
#    between Aqp1 and Aqp2.
# 3. Create a scatter plot of Aqp1 vs Aqp2 with:
#    - points
#    -minimal theme
#    - The correlation value
#    - Proper plot title and x-axis and y-axis labels
#
# Make sure the code is runnable, clearly commented,
# and easy to modify for other gene pairs.


#Extract the two genes of interest
Aqp1 <- data$Aqp1
Aqp2 <- data$Aqp2
x <- data$x
y <- data$y

# Create data frame
gene_data <- data.frame(
  x = x,
  y = y,
  Aqp1 = Aqp1,
  Aqp2 = Aqp2
)

# ============================================================================
# 1. BASIC STATISTICS
# ============================================================================
cat("\n=== SUMMARY STATISTICS ===\n")
cat("\nAqp1 - Mean:", mean(Aqp1), "| Median:", median(Aqp1), "\n")
cat("Aqp2 - Mean:", mean(Aqp2), "| Median:", median(Aqp2), "\n")

# Correlation
cor_value <- cor(Aqp1, Aqp2)
cat("\nCorrelation:", round(cor_value, 3), "\n")

# ============================================================================
# 2. SCATTER PLOT
# ============================================================================
ggplot(gene_data, aes(x = Aqp1, y = Aqp2)) +
  geom_point(alpha = 0.5, color = "steelblue", size = 2) +
  labs(
    title = paste("Aqp1 vs Aqp2 (r =", round(cor_value, 3), ")"),
    subtitle = "Proximal Tubule vs Collecting Duct Water Channels",
    x = "Aqp1 Expression (Proximal Tubule)",
    y = "Aqp2 Expression (Collecting Duct)"
  ) +
  theme_minimal(base_size = 14)