Spatial Gene Expression Patterns of Umod and Cyp4b1 (Xenium Dataset)

1. What data types are you visualizing?
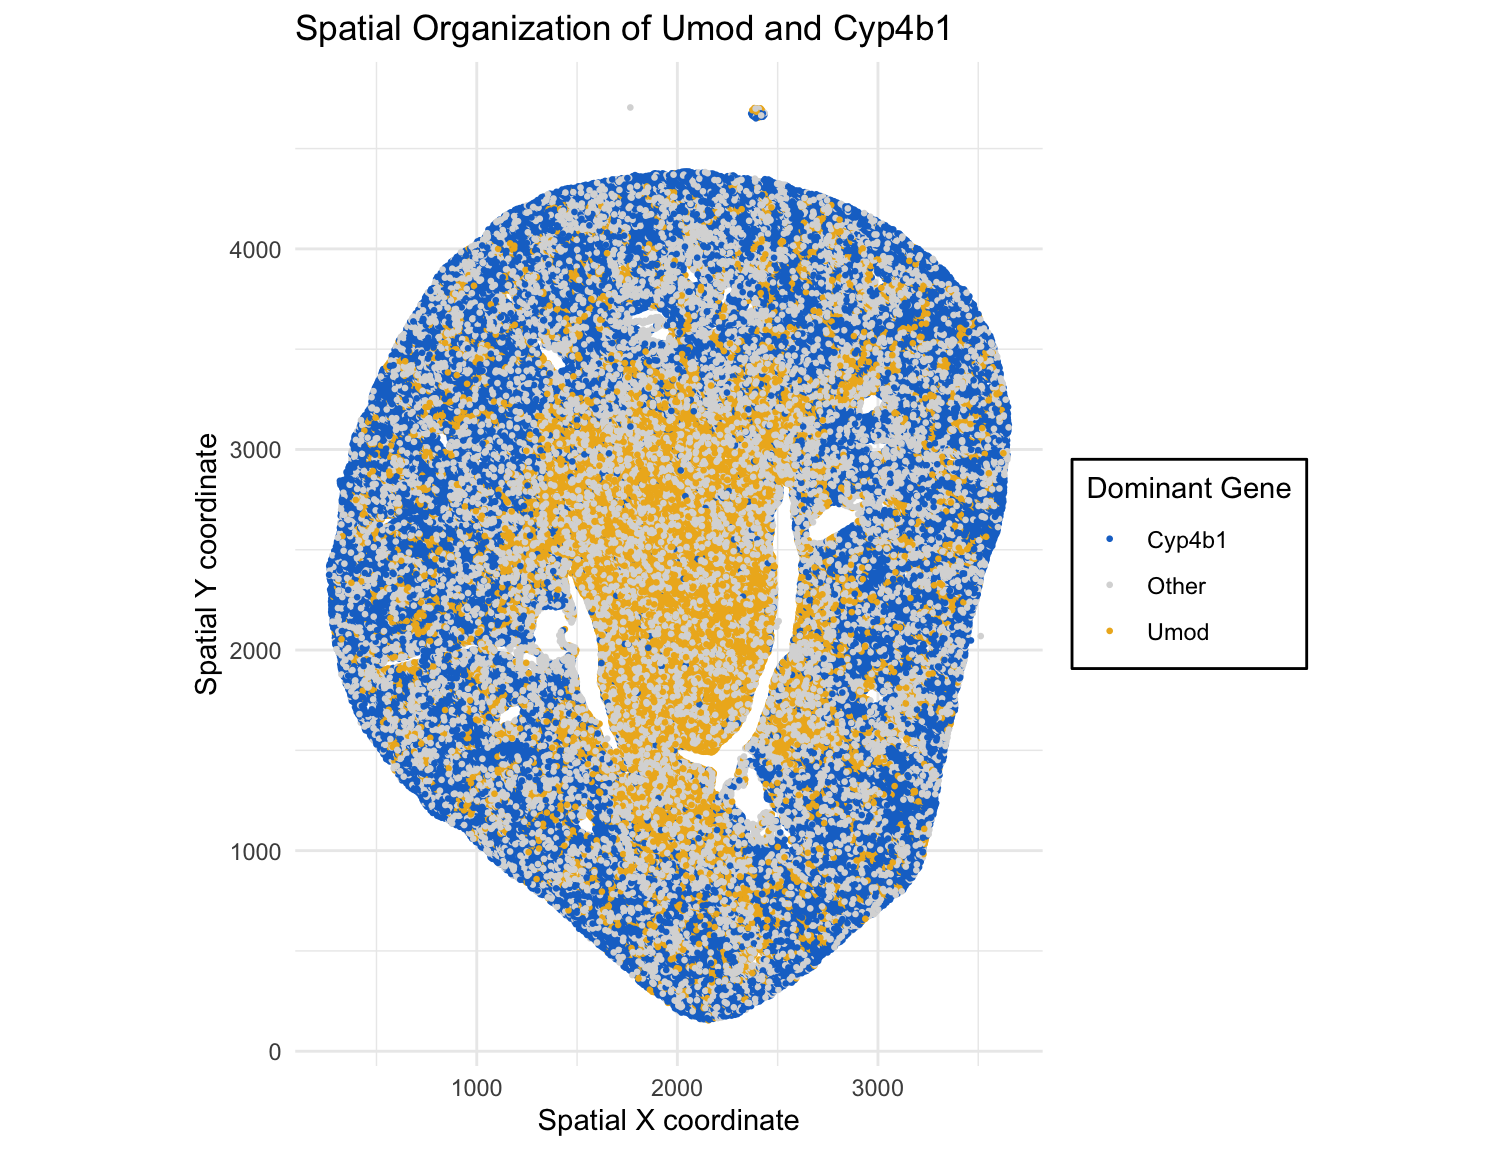
I’m visualizing both quantitative and categorical data. The original dataset contains quantitative data (the x and y coordinates) for each spot in the tissue, as well as quantitative gene expression counts that represent how many RNA transcripts of each gene were detected at each location. From these quantitative gene expression values, I made a categorical variable indicating which of two genes (Umod or Cyp4b1) was more highly expressed at each spot, or neither if both were absent. This categorical variable is what I then visualized, along with the quantitative position variables.
2. What data encodings (geometric primitives and visual channels) are you using to visualize these data types?
I’m using the geometric primitive of points to represent each spatial location. For each point, the position along the x and y axis indicates the spatial x and y coordinates of that spot. I encoded a categorical variable of dominant gene using color, with a different hue used to encode different genes. I used blue if there was a higher Cyp4b1 gene expression count than Umod, orange if the Umod expression was higher than Cyp4b1, or grey if neither of those genes were present in that specific spot.
3. What about the data are you trying to make salient through this data visualization?
I’m trying to make it salient that there is some spatial separation of gene expression. Since I encoded whether Umod or Cyp4b1 was more highly expressed in each spot using color, the plot can show that there are places in the tissue where one gene dominates compared to the other. This makes it easy to see that Umod expression seems to be higher in the center of the tissue sample, but Cyp4b1 expression is higher in the outer sections.
4. What Gestalt principles or knowledge about perceptiveness of visual encodings are you using to accomplish this?
I used the Gestalt principle of similarity because all spots where Umod expression is higher have the same color (orange), all spots where Cyp4b1 expression is higher are the same color (blue) and all spots with neither of those genes present are also the same color (grey). This causes spots with similar gene expression patterns to be perceived as groups. I also used the Gestalt principle of enclosure by placing a box around the legend to distinguish the points within the legend from the points that were a part of the tissue sample.
5. Code (paste your code in between the ``` symbols)
1
2
3
4
5
6
7
8
9
10
11
12
13
14
15
16
17
18
19
20
21
22
23
24
25
26
27
28
29
library(ggplot2)
data <- read.csv("~/Desktop/Xenium-IRI-ShamR_matrix.csv.gz")

genes2 <- c("Umod", "Cyp4b1")
mat2 <- as.matrix(data[, genes2])

max_val  <- apply(mat2, 1, max)
max_gene <- apply(mat2, 1, function(v) genes2[which.max(v)])

data$dominant2 <- ifelse(max_val > 0, max_gene, "Other")

ggplot(data, aes(x, y, color = dominant2)) +
  geom_point(size = 0.5) +
  coord_fixed() +
  theme_minimal() +
  scale_color_manual(values = c(
    Umod = "goldenrod2",
    Cyp4b1 = "dodgerblue3",
    Other = "grey85"
  )) +
  theme(
    legend.background = element_rect(color = "black", fill = "white")
  ) +
  labs(
    title = "Spatial Organization of Umod and Cyp4b1",
    x = "Spatial X coordinate",
    y = "Spatial Y coordinate",
    color = "Dominant Gene"
  )