HW1

1. What data types are you visualizing?
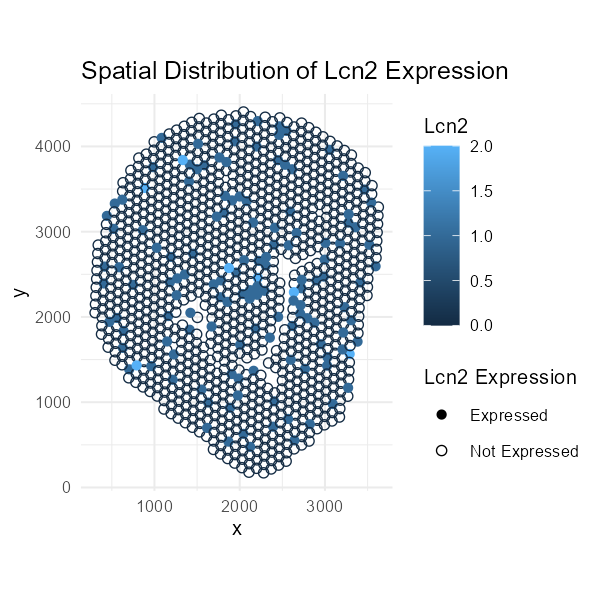
This visualization comprises categorical data for the gene marker and quantitative data for the expression values.
2. What data encodings (geometric primitives and visual channels) are you using to visualize these data types?
I am using the point geometric primitive, as well as, color(saturation), x-position, y-position, shape to highlight the expression of the biomarker across the tissue.
3. What about the data are you trying to make salient through this data visualization?
I am plotting the expression of the ‘Lcn2’ gene, a marker for kidney injury, and I am highlighting the particular spots where the expression of ‘Lcn2’ was observed.
4. What Gestalt principles or knowledge about perceptiveness of visual encodings are you using to accomplish this?
I am using the Gestalt principle of similarity.
5. Code
1
2
3
4
5
6
7
8
9
10
11
12
13
14
15
16
17
18
19
20
21
# set working directory and read in data
setwd("C:/Users/John-Paul/Documents/Doctoral_Doctor/PhD/LEARN/Gene_Data_Viz/genomic-data-visualization-2026")
data <- read.csv(gzfile("data/Visium-IRI-ShamR_matrix.csv.gz"))

# check for specific genes (markers of kidney injury)
"Lcn2" %in% colnames(data)
"Havcr1" %in% colnames(data)

# visualize spatial positions of kidney injury markers
df <- data.frame(x= data$x, y=data$y, Lcn2 = data$Lcn2, Havcr1 = data$Havcr1)
head(df)
library(ggplot2)
df$Lcn2_expressed <- ifelse(df$Lcn2 > 0, "Expressed", "Not Expressed")
ggplot(df, aes(x = x, y = y, color = Lcn2, shape = Lcn2_expressed)) +
  geom_point(size = 2) +
  scale_shape_manual(values = c("Expressed" = 16, "Not Expressed" = 1)) +
  labs(shape = "Lcn2 Expression", title = "Spatial Distribution of Lcn2 Expression") +
  coord_fixed() +
  theme_minimal() +
  theme(legend.text = element_text(size = 14), legend.title = element_text(size = 16))
(AI prompts: I initially had the code: ggplot(df, aes(x=x, y=y, col=Lcn2)) + geom_point() + scale_color_viridis_c() but used generative AI prompts to enhance the visibility of the differential expression.)