Spatial Expression of Avpr2, Inmt, and Rnf24

1. What data types are you visualizing?
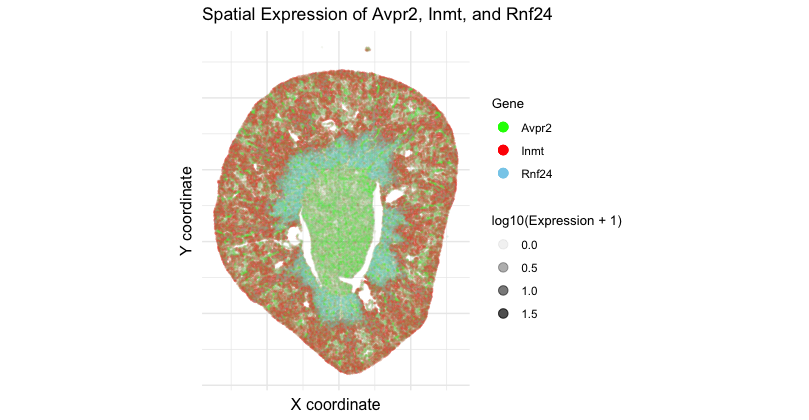
I am visualizing 3 data types. First, categorical data of 3 genes: Avpr2, Inmt, and Rnf24. Second, spatial data regarding the x and y centroid positions of each cell. Lastly, quantitative data of the expression count of Avpr2, Inmt, and Rnf2 genes for each cell.
2. What data encodings (geometric primitives and visual channels) are you using to visualize these data types?
I am using the geometric primitive of points to represent each cell. The visual channel of color represents the categorical data of each gene with Avpr2 being green, Inmt being red, and Rnf24 being blue. Spatial data is encoded by x and y position. To encode quantitative data of gene expression, lightness/saturation is used. While not optimal for quantitative data, saturation took precedence over other channels such as size and area which are redundant in a spatial plot with so many points, and position, which is already being used to encode spatial data.
3. What about the data are you trying to make salient through this data visualization?
My data visualization seeks to make more salient the specific, regional localization of 3 genes of interest in areas of the kidney coronal section. I was interested in assessing distinct spatial patterns of 3 genes that are typically found in different areas of the kidney. The data visualization makes salient the expression of Avpr2 in the inner medulla and collecting ducts, Inmt in the cortex, and Rnf24 in the outer medulla, forming a dark outer ring.
4. What Gestalt principles or knowledge about perceptiveness of visual encodings are you using to accomplish this?
The Gestalt principle of similarity groups similar colors together, helping perceive them as part of one gene group and allowing distinction between gene-specific domains. Proximity of the points further establish perception of data as from the same anatomical region. The size of the points allows tissue structure to still be visible. Increasing opacity as gene expression increases allows us to sense denser regions (such as the darker red ring) or overlapping expression (thin purple outline where the blue from the outer medulla mixes with the red from the cortex).
5. Code (paste your code in between the ``` symbols)
1
2
3
4
5
6
7
8
9
10
11
12
13
14
15
16
17
18
19
20
21
22
23
24
25
26
27
28
29
30
31
32
33
34
35
36
37
38
data <- read.csv('~/Desktop/GDV/Xenium-IRI-ShamR_matrix.csv.gz')
gexp <- data[,4:ncol(data)]

library(ggplot2)

# Creating Data frame with genes of interest
df <- data.frame(x = data$x, y = data$y,
  Inmt = log10(gexp[, "Inmt"] + 1), #log10 transformation applied to gene expression
  Rnf24 = log10(gexp[, "Rnf24"] + 1),
  Avpr2 = log10(gexp[, "Avpr2"] + 1)
)
# visualizing spatial co-localization and overlap of genes of interest
ggplot() +
  geom_point(data = df, aes(x=x, y=y, alpha = Inmt, color = "Inmt"), size = 0.15) +
  geom_point(data = df, aes(x=x, y=y, alpha = Rnf24, color ="Rnf24"),size = 0.15) +
  geom_point(data = df,aes(x=x, y=y, alpha = Avpr2, color = "Avpr2"),size = 0.15) +
  scale_alpha(range = c(0.02, 0.4), name = "log10(Expression + 1)") +
  scale_color_manual(
    name = "Gene",
    values = c("Inmt" = "red", "Rnf24" = "skyblue", "Avpr2" = "green")) +
  coord_fixed() +
  labs(
    title = "Spatial Expression of Avpr2, Inmt, and Rnf24",
    x = "X coordinate",
    y = "Y coordinate") +
  theme_minimal() +
  theme(axis.text = element_blank(), axis.ticks = element_blank(),
        axis.title = element_text(size = 12), legend.title = element_text(size = 10)) +
  guides(color = guide_legend(override.aes = list(size = 3)),  alpha = guide_legend(override.aes = list(size = 3)))

#References:
#https://ggplot2.tidyverse.org/reference/index.html
# Genes of interest chosen with help of Wu, H., Dixon, E.E., Xuanyuan, Q. et al.
# High resolution spatial profiling of kidney injury and repair using RNA hybridization-based in situ sequencing.
# Nat Commun 15, 1396 (2024). https://doi.org/10.1038/s41467-024-45752-8
#AI prompts used:
# how do I add a legend for Genes?
# how do I resize legends dots larger?