Animation of Non-Linear Dimensionality Reduction (tSNE) on Varied number of PCs

4. If I perform non-linear dimensionality reduction on PCs, what happens when I vary how many PCs I use? Write a brief description of your figure so we know what you are visualizing.
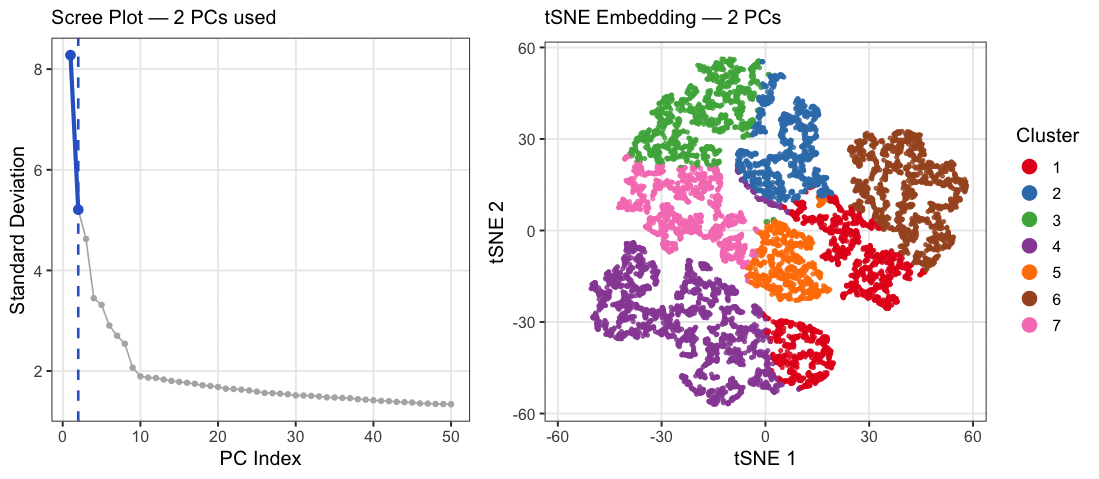
This animation explores how the number of principal components (PCs) affects the structure of a t-SNE embedding of gene expression data from the Xenium spatial transcriptomics kidney dataset. PC counts of 2, 5, 10, 15, 20, 30, and 50 were chosen to span a range from well below to well above the scree plot elbow at ~10, capturing the full arc of how embedding quality changes. Each frame shows two panels: a scree plot on the left highlighting how many PCs are being used, and a t-SNE plot on the right showing how cells group in 2D space when that many PCs are fed into t-SNE. Cells are colored by k-means cluster (k=7, determined by elbow analysis) on a random subsample of 10,000 cells. At very few PCs (2-5), large white spaces appear between and within clusters, suggesting that cells labeled as the same cluster may not actually be transcriptionally similar, as the embedding is capturing too little variance to meaningfully group cells together. Around 10 PCs, distinct cell populations emerge as tight, well-separated islands with clear boundaries between them, consistent with where the scree plot elbow falls. Beyond 20-30 PCs, the embedding visibly degrades as clusters begin bleeding into each other and overlapping, with cells from different populations mixing together in the same regions of the plot. This cluster-on-cluster overlap at high PC counts shows that including too many PCs introduces noise that distorts the t-SNE’s ability to separate biologically distinct populations. A random subsample of 10,000 cells was used out of the full 85,880 cells in the dataset because t-SNE was run 7 times, once per PC count, and running it on the full dataset would have been computationally prohibitive. 10,000 cells was chosen as a reasonable tradeoff that still captures the diversity of cell populations while keeping runtime manageable. The number of clusters was set to k=7 based on elbow analysis performed in a prior analysis of this dataset. PC counts were capped at 50 since the scree plot shows standard deviation effectively plateauing well before that point, making higher PC counts unlikely to add meaningful biological signal.
##Code
1
2
3
4
5
6
7
8
9
10
11
12
13
14
15
16
17
18
19
20
21
22
23
24
25
26
27
28
29
30
31
32
33
34
35
36
37
38
39
40
41
42
43
44
45
46
47
48
49
50
51
52
53
54
55
56
57
58
59
60
61
62
63
64
65
66
67
68
69
70
71
72
73
74
75
76
77
78
79
80
81
82
83
84
85
86
87
88
89
90
91
92
93
94
95
96
97
98
99
100
101
102
103
104
105
106
107
108
109
110
111
112
113
114
115
116
117
118
119
120
121
122
123
124
125
126
127
128
129
130
131
132
133
134
135
136
137
138
139
140
141
142
143
144
145
146
147
148
149
150
151
152
153
154
155
156
157
158
159
160
library(ggplot2)
library(Rtsne)
library(gganimate)
library(magick)
library(dplyr)

#Load data
data <- read.csv('~/Desktop/GDV/Xenium-IRI-ShamR_matrix.csv')
pos  <- data[, c('x', 'y')]
rownames(pos) <- data[, 1]
gexp <- data[, 4:ncol(data)]
rownames(gexp) <- data[, 1]

#Normalize & log-transform
totgexp <- rowSums(gexp)
totgexp[totgexp == 0] <- 1
mat <- log10(gexp / totgexp * 1e6 + 1)

#PCA
set.seed(42)
pcs <- prcomp(mat, center = TRUE, scale = FALSE)

#Scree data (first 50 PCs)
sdev_df <- data.frame(
  PC   = 1:50,
  sdev = pcs$sdev[1:50]
)

#PC counts to animate over
pc_steps <- c(2, 5, 10, 15, 20, 30, 50)

# AI prompt: I want to animate a scree plot over pc_steps <- c(2,5,10,15,20,30,50).
# Can you build a long-format dataframe that repeats the scree data for each step
# and includes a column indicating whether each PC index is included in that step?
df_sdev <- do.call(rbind, lapply(pc_steps, function(npcs) {
  data.frame(sdev_df, npcs = npcs, included = sdev_df$PC <= npcs)
}))
df_sdev$npcs_f <- factor(df_sdev$npcs, levels = pc_steps)

#Subsample to 10,000 cells (85,880 total: full run would take hours)
set.seed(42)
N       <- nrow(pcs$x)
sub_idx <- if (N > 10000) sample(N, 10000) else seq_len(N)
pcs_sub <- pcs$x[sub_idx, ]

#Run tSNE + kmeans for each PC count
#AI prompt: For each value in pc_steps, I want to run tSNE on the first npcs
#columns of pcs$x and also run kmeans with k=7 on the same PC subset. Can you
#build a long-format dataframe with tSNE coordinates, cluster labels, and npcs
#as a column so I can animate over it with gganimate?
set.seed(42)
df_emb <- do.call(rbind, lapply(pc_steps, function(npcs) {
  message("Running tSNE with ", npcs, " PCs ...")
  ts <- Rtsne::Rtsne(pcs_sub[, 1:npcs, drop = FALSE],
                     dims             = 2,
                     perplexity       = 30,
                     pca              = FALSE,
                     verbose          = FALSE,
                     check_duplicates = FALSE)
  km <- kmeans(pcs_sub[, 1:npcs, drop = FALSE], centers = 7, nstart = 50, iter.max = 50)
  data.frame(
    tSNE1   = ts$Y[, 1],
    tSNE2   = ts$Y[, 2],
    cluster = as.factor(km$cluster),
    npcs    = npcs
  )
}))
df_emb$npcs_f <- factor(df_emb$npcs, levels = pc_steps)

#Shared theme
base_theme <- theme_bw(base_size = 13) +
  theme(
    legend.position  = "bottom",
    plot.title       = element_text(face = "bold", size = 13),
    panel.grid.minor = element_blank()
  )

#Left panel: Clean scree plot
#AI prompt: How do I make a ggplot scree plot that animates through each value
#in pc_steps, showing a grey baseline for all 50 PCs and a blue highlighted
#line and points only for the included PCs, plus a vertical dashed line at
#the cutoff that moves each frame?
p_scree <- ggplot(df_sdev, aes(x = PC)) +
  geom_line(aes(y = sdev), color = "grey70", linewidth = 0.5) +
  geom_point(aes(y = sdev), color = "grey70", size = 1.2) +
  geom_line(
    data = df_sdev %>% filter(included),
    aes(y = sdev),
    color = "#3366CC", linewidth = 1.3
  ) +
  geom_point(
    data = df_sdev %>% filter(included),
    aes(y = sdev),
    color = "#3366CC", size = 2.5
  ) +
  geom_vline(
    data = df_sdev %>% distinct(npcs),
    aes(xintercept = npcs),
    color = "#3366CC", linetype = "dashed", linewidth = 0.8
  ) +
  labs(
    title = "Scree Plot — {closest_state} PCs used",
    x = "PC Index",
    y = "Standard Deviation"
  ) +
  base_theme +
  theme(legend.position = "none") +
  transition_states(npcs, transition_length = 2, state_length = 5) +
  ease_aes("cubic-in-out")

#Right panel: tSNE colored by kmeans cluster (k=7)
cluster_pal <- c("#E41A1C","#377EB8","#4DAF4A","#984EA3",
                 "#FF7F00","#A65628","#F781BF")

p_tsne <- ggplot(df_emb, aes(x = tSNE1, y = tSNE2, color = cluster)) +
  geom_point(size = 0.8, alpha = 0.8) +
  scale_color_manual(values = cluster_pal, name = "Cluster") +
  labs(
    title = "tSNE Embedding — {closest_state} PCs",
    x = "tSNE 1",
    y = "tSNE 2"
  ) +
  base_theme +
  theme(legend.position = "right") +
  guides(color = guide_legend(ncol = 1,
                              override.aes = list(size = 4, alpha = 1))) +
  transition_states(npcs, transition_length = 2, state_length = 5) +
  enter_fade() + exit_fade() +
  ease_aes("cubic-in-out")

#Render & stitch side-by-side
#AI prompt: I have two gganimate animations rendered with magick_renderer().
#How do I combine them into a single GIF with the scree plot on the left and
#the tSNE on the right, stitching corresponding frames together side by side?
nframes <- 140
fps     <- 10

gif_scree <- animate(p_scree, fps = fps, nframes = nframes,
                     width = 480, height = 480, res = 110,
                     renderer = magick_renderer())

gif_tsne  <- animate(p_tsne, fps = fps, nframes = nframes,
                     width = 620, height = 480, res = 110,
                     renderer = magick_renderer())

combined <- image_append(c(gif_scree[1], gif_tsne[1]))
for (i in 2:nframes) {
  combined <- c(combined, image_append(c(gif_scree[i], gif_tsne[i])))
}

# Display and save
combined
image_write(combined, path = "~/Desktop/GDV/sakshi_hw_ec1.gif")

# References:
# gganimate documentation: https://gganimate.com/
# Rtsne package: https://github.com/jkrijthe/Rtsne
# magick: https://docs.ropensci.org/magick/
# k=7 clusters determined by elbow method in prior HW3 analysis
# AI assistance used and prompts mentioned above