How the Number of PCs Influences t-SNE Embeddings in Visium Data

If I perform non-linear dimensionality reduction on PCs, what happens when I vary how many PCs should I use?
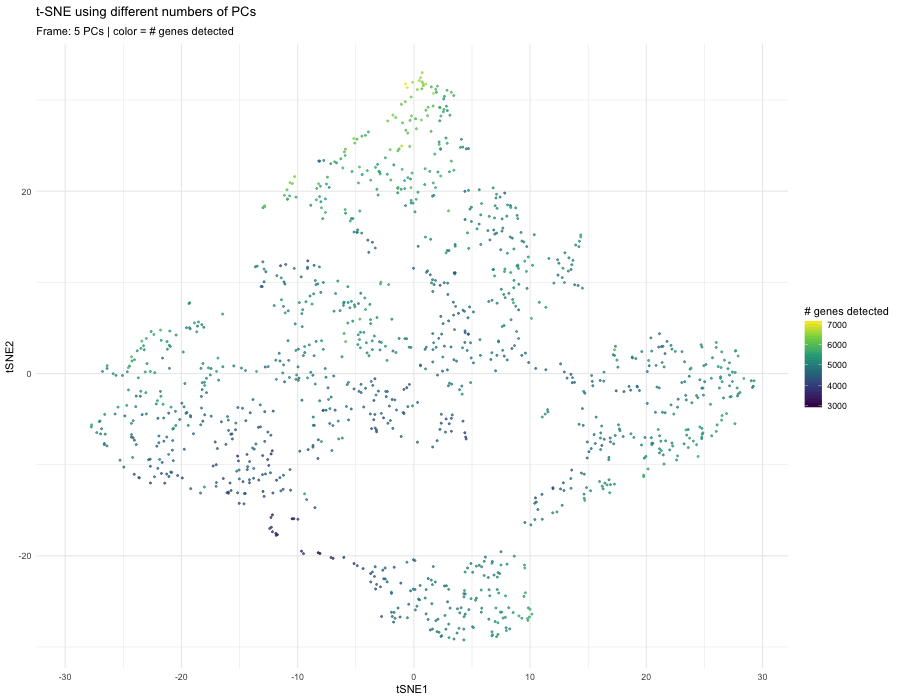
When performing nonlinear dimensionality reduction (t-SNE) on principal components, the number of PCs used as input directly affects the neighborhood relationships that t-SNE preserves in 2D. With only 5 PCs, the embedding appears smoother and more compressed. The structure is dominated by the strongest global sources of variation, which often include sequencing depth or gene detection differences. In this frame, the color gradient (genes detected) aligns strongly with the embedding, suggesting that technical variation is influencing the structure.
When increasing to 10 PCs, more biological variation is incorporated. Substructures begin to separate more clearly, and the embedding shows improved local organization. The color gradient becomes less uniform, suggesting that the embedding is less dominated by technical effects and more reflective of biological heterogeneity.
At 20 PCs, the embedding shows the most balanced structure. There is clearer separation of regions without excessive fragmentation. This typically represents a good compromise: enough PCs to capture meaningful biological variation while still filtering out higher-order noise. The distribution of gene detection appears more mixed within regions, indicating that the embedding is not primarily driven by technical variation.
At 40 PCs, the embedding changes again, and additional separation or branch-like structures may appear. Including too many PCs can introduce noise from lower-variance components. Because t-SNE is sensitive to distance relationships, noisy PCs can distort neighborhood structure and create artificial separations or elongations in the embedding.
The animation demonstrates that using too few PCs oversimplifies the data and emphasizes dominant global signals, using a moderate number of PCs (around 10–20) captures biologically meaningful structure, and using too many PCs can introduce noise and alter the geometry of the embedding.Therefore, the number of PCs used before nonlinear dimensionality reduction significantly influences the final 2D visualization, and selecting an appropriate number is important to balance biological signal and noise.
Links used: https://gganimate.com/
AI Disclosure: AI was used for debugging the code below
5. Code
1
2
3
4
5
6
7
8
9
10
11
12
13
14
15
16
17
18
19
20
21
22
23
24
25
26
27
28
29
30
31
32
33
34
35
36
37
38
39
40
41
42
43
44
45
46
47
48
49
50
51
52
53
54
55
56
57
58
59
60
61

library(tidyverse)
library(Rtsne)
library(gganimate)
library(gifski)

# load
df <- read.csv(gzfile("~/Desktop/Visium-IRI-ShamR_matrix.csv.gz"), check.names = FALSE)
if ("Unnamed: 0" %in% names(df)) names(df)[names(df) == "Unnamed: 0"] <- "id"
if (names(df)[1] == "") names(df)[1] <- "id"

meta <- df %>% select(id, x, y)
expr <- df %>% select(-id, -x, -y) %>% as.matrix()
mode(expr) <- "numeric"

lib_size <- rowSums(expr)
n_detected <- rowSums(expr > 0)

expr_norm <- log1p(t(t(expr) / lib_size * 1e4))

gene_vars <- apply(expr_norm, 2, var)
top_genes <- names(sort(gene_vars, decreasing = TRUE))[1:2000]
expr_hvg <- expr_norm[, top_genes, drop = FALSE]

pca <- prcomp(expr_hvg, scale. = TRUE)

pcs_to_try <- c(5, 10, 20, 40)

run_tsne <- function(n_pc) {
  pc_mat <- pca$x[, 1:n_pc, drop = FALSE]
  set.seed(1)
  ts <- Rtsne(pc_mat, dims = 2, perplexity = 30, verbose = FALSE, max_iter = 800, check_duplicates = FALSE)
  tibble(
    id = meta$id,
    tSNE1 = ts$Y[,1],
    tSNE2 = ts$Y[,2],
    n_pc = factor(n_pc, levels = pcs_to_try),
    n_detected = n_detected
  )
}

tsne_all <- purrr::map_dfr(pcs_to_try, run_tsne)

p <- ggplot(tsne_all, aes(tSNE1, tSNE2, color = n_detected)) +
  geom_point(size = 0.6, alpha = 0.7) +
  scale_color_viridis_c() +
  theme_minimal() +
  labs(
    title = "t-SNE using different numbers of PCs",
    subtitle = "Frame: {closest_state} PCs | color = # genes detected",
    x = "tSNE1", y = "tSNE2", color = "# genes detected"
  ) +
  transition_states(n_pc, transition_length = 2, state_length = 1) +
  ease_aes("cubic-in-out")

animate(p, nframes = 120, fps = 12, width = 900, height = 700,
        renderer = gifski_renderer("visium_tsne_vary_pcs.gif"))

#Prompts to ChatGPT:
# How do I open my gif?
# What does Error: file ‘/var/folders/f9/f4_9ch4n69zf8wqfgxsmlzzh0000gn/T//RtmpPI576s/downloaded_packages/sf_1.1-0.tgz’ is not a macOS binary package In addition: Warning messages: 1: In .rs.downloadFile(url = c("https://cran.rstudio.com/bin/macosx/big-sur-arm64/contrib/4.5/s2_1.1.9.tgz", : URL 'https://cran.rstudio.com/bin/macosx/big-sur-arm64/contrib/4.5/sf_1.1-0.tgz': Timeout of 60 seconds was reached 2: In .rs.downloadFile(url = c("https://cran.rstudio.com/bin/macosx/big-sur-arm64/contrib/4.5/s2_1.1.9.tgz", : some files were not downloaded 3: 'tar' returned non-zero exit code 1 mean?