HW1

1. What data types are you visualizing?
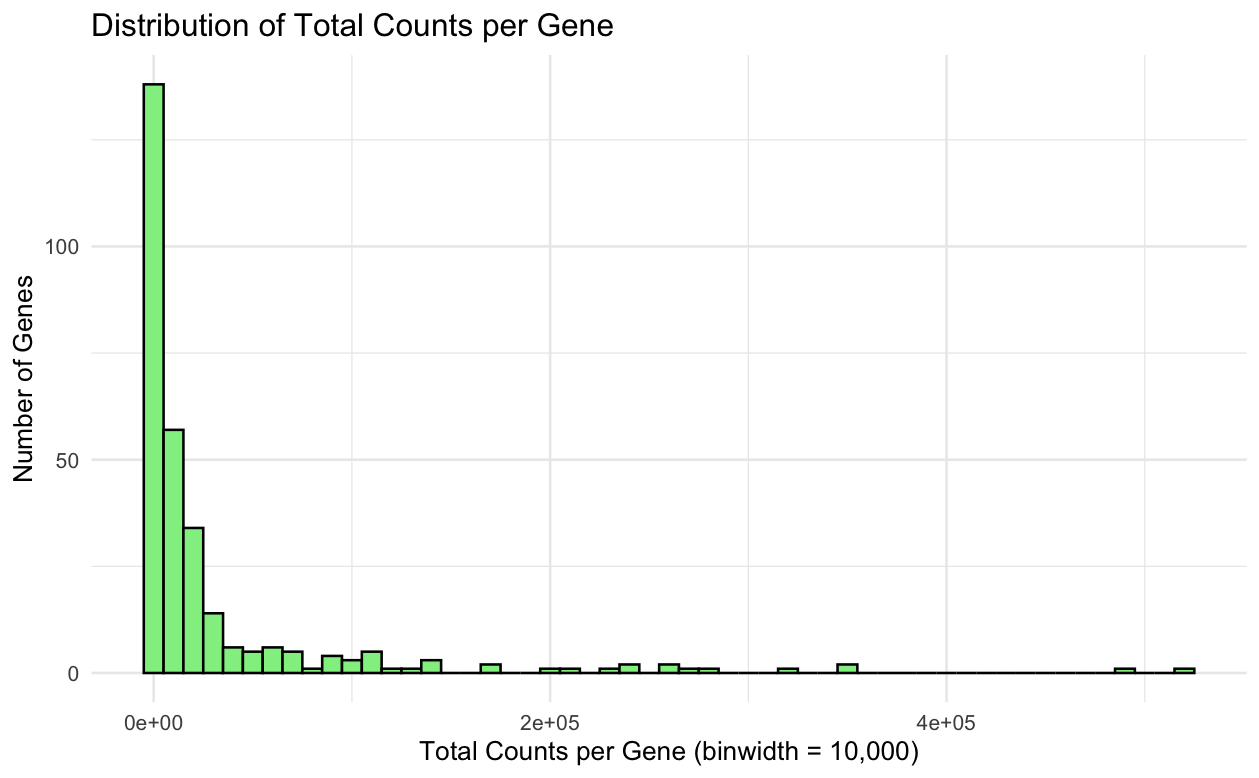
I’m plotting the quantitative data of the expression count of genes for each cell.
2. What data encodings (geometric primitives and visual channels) are you using to visualize these data types?
I’m using lines and their sizes to represent the quantitative information of the expression count for each cell.
3. What about the data are you trying to make salient through this data visualization?
I tried to visualize the frequency of the expression count for each cell.
4. What Gestalt principles or knowledge about perceptiveness of visual encodings are you using to accomplish this?
Similarity
5. Code
1
2
3
4
5
6
7
8
9
10
11
12
13
14
15
16
17
18
19
20
21
# load libraries
library(dplyr)
library(ggplot2)

# load data
data <- read_csv("Xenium-IRI-ShamR_matrix.csv.gz")

# saparate metadata from counts
metadata <- data %>% select(1:3)
counts <- data %>% select(-c(1:3))

# calculate the total counts per gene
col_sums  <- data.frame(gene = colnames(counts), total_counts = colSums(counts))

# plot the distribution of total counts per gene
ggplot(col_sums, aes(x = total_counts)) +
  geom_histogram(binwidth = 10000, fill = "lightgreen", color = "black") +
  labs(title = "Distribution of Total Counts per Gene",
       x = "Total Counts per Gene (binwidth = 10,000)",
       y = "Number of Genes") +
  theme_minimal()
(Please do not copy. I did not do a good job on this HW.)