HW1

1. What about the data would you like to make salient through this data visualization?
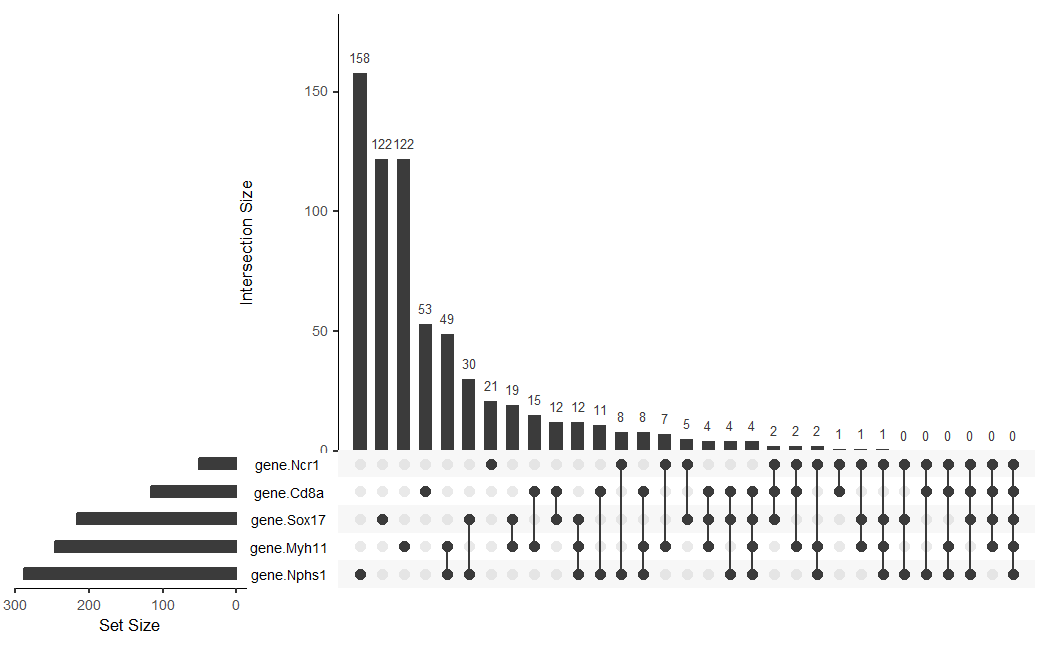
Since I am working with Visium 10x geneomics data, every row is a spatial spot that is $55 \mu m$, which might contain multiple cell types (since cells are around $10 \mu m$ in diameter). My data visiual aims to make more salient the spatial variance and co-localization of different cell types in tissue spots. Specifically, I wanted to enhance saliency of the number of spots that contain single vs. multiple cell type markers, the most common cell type combinations, and whether certain cell types spatially segregated or intermixed.
2. What are the data types represented?
The data type represented are:
- Categorical: gene/cell type identity (Ncr1, Cd8a, Sox17, Nphs1, Myh11) and set membership (binary presence/absence of gene in spot)
- Quantative: intersection sizes (how many spots have each combination) and set sizes (total number of spots expressing each gene)
- Ordinal data: ranking by frequency
3. What data encodings (geometric primitives and visual channels) are you choosing to visualize these data types?
The geometric primitives used are:
- Points: Points were used to represent the gene in the intersection matrix.
- Lines: Lines connected dots to show which sets are combined in each intersection.
- Area: Area of the bars show the set size (horizonal bars) and the intersection count (vertical bars).
The visual channels are:
- Position
- X-position was used to distinguish different intersections (categorical).
- Y-position (gene.Ncr1, etc.) was used to distinguish different gene sets (categorical).
- Y-position of vertical bar tops showed the quantitative values of the intersection size.
- X-position of the horizontal bars ends showed the quantitative values of the set size.
- Color: The color of the dots showed if a gene was in set or not (black for inside set, white for not inside set).
4. What Gestalt principles and/or knowledge about perceptiveness of visual encodings are you using to accomplish this?
The Gestalt principle of similarity was used to if a gene is in set or not. If a gene was in a set, they had the same black color, and if they are not in a set, then they had the same white color. Continuity was used for the vertical lines connecting filled dots, which created a flow that unified the connected dots.
UpSet uses the fact that humans judge position/length more accurately than area (for a Venn Diagram) on the perception chart. By using bar height rather than overlapping circles, the quantitative comparisons are less cognitively demanding.
5. Code
library(UpSetR)
library(ggplot2)

#I seach on google for "reading gz files in r" and used the copilot result
con <- gzfile("C:/users/lilli/Downloads/Visium-IRI-ShamR_matrix.csv.gz", "rt")
data <- read.table(con, header = TRUE, sep = ",")
close(con)

#gene expression data
gexp <- data[, 4:ncol(data)]
#rownames are the spots
rownames(gexp) <- data[,1]
#positions of the data
pos <- data[, c('x', 'y')]

#I used the paper below to get genes from certain cell types, specifically from Figure 2.
#I tried to get genes are only found in that specific cell type (ex. Cd8a is only really found in CD8 cells)
#Balzer, M. S., Rohacs, T., & Susztak, K. (2022). How Many Cell Types Are in the Kidney and What Do They Do?. Annual review of physiology, 84, 507–531. https://doi.org/10.1146/annurev-physiol-052521-121841
'Ncr1' %in% colnames(gexp) #gene for NK cell
'Cd8a' %in% colnames(gexp) #gene for CD8 cells
'Sox17' %in% colnames(gexp) #endothelial cells
'Nphs1' %in% colnames(gexp) #podocytes
'Myh11' %in% colnames(gexp) #smooth muscle cells

#isolating the genes I want
cell_type_gene_list <- c('Ncr1', 'Cd8a', 'Sox17', 'Nphs1', 'Myh11')
df <- data.frame(pos, gene=gexp[, cell_type_gene_list])


#I convert to binary since we only need to know if the spot contains the gene
for (gene in names(df[,3:ncol(df)])) {
  df[[gene]]<-as.numeric(df[[gene]] > 0)}


#Following the demo of Lex & Gehlenborg: https://www.rdocumentation.org/packages/UpSetR/versions/1.4.0
upset(df, sets = names(df[,3:ncol(df)]),
order.by = "freq", empty.intersections = 'on')