HW1

1. What data types are you visualizing?
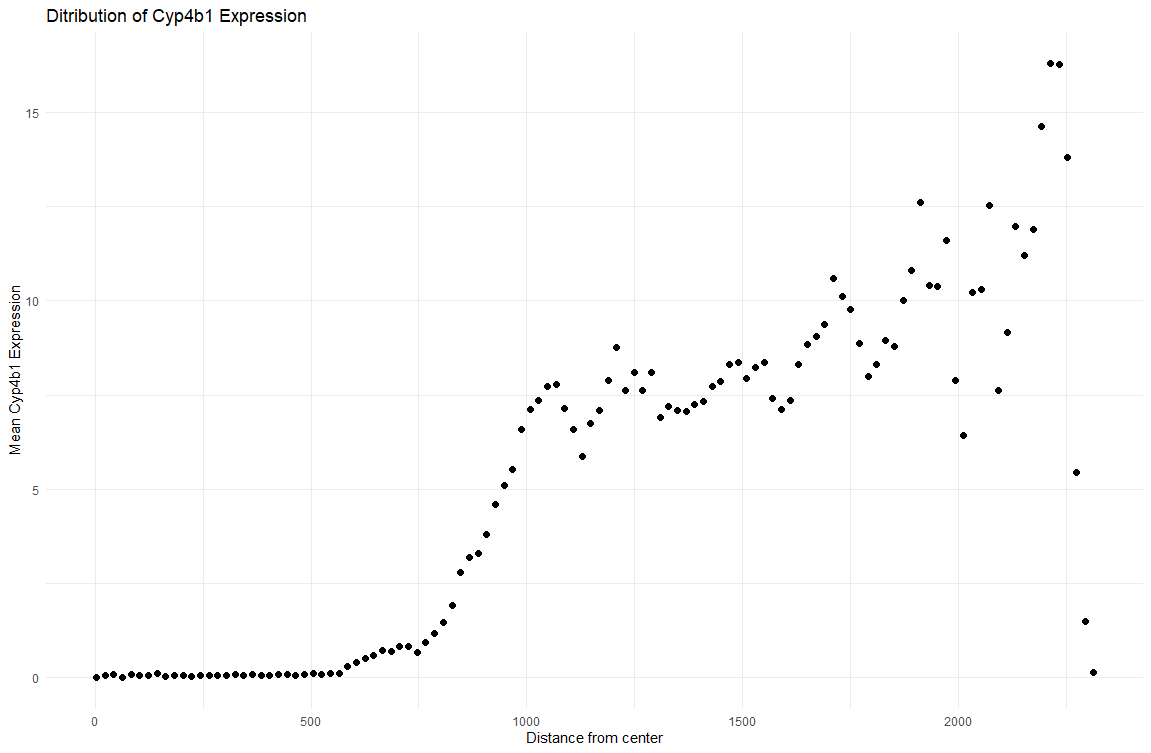
I am plotting quantitative data of the average gene expression and the distance of the cells to the center of the structure.
2. What data encodings (geometric primitives and visual channels) are you using to visualize these data types?
I’m using points and their positions with the y axis to represent the expression count for each cell and x axis for their position with respect to the center of the structure.
3. What about the data are you trying to make salient through this data visualization?
I am trying to show how the expression of Cyp4b1 is localized to the medulla of the mouse kidney. Because the kidney is roughly radially symmetric, I want to show that its expression is very low near the center and increases rapidly around 1000 units from the center and continues to increase until the edge of the structure. I do this by plotting a relationship between the position of the cells and its expression of Cyp4b1.
4. What Gestalt principles or knowledge about perceptiveness of visual encodings are you using to accomplish this?
Continuity
5. Code
1
2
3
4
5
6
7
8
9
10
11
12
13
14
15
16
17
18
19
20
21
22
23
24
25
26
27
library(ggplot2)
data <- read.csv("data/Xenium-IRI-ShamR_matrix.csv.gz")
dim(data) #80k cells, 302 genes

pos <- data[, c('x', 'y')]
rownames(pos) <- data[,1]

gexp <- data[, 4:ncol(data)]
rownames(gexp) <- data[,1]

avg_pos <- colMeans(pos)
pos$dist <- sqrt((pos$x-avg_pos[1])^2 + (pos$y - avg_pos[2])^2)
pos$exp <- gexp[, "Cyp4b1"]

ggplot(pos) +
  stat_summary_bin(
    aes(x = dist, y = exp),
    fun = mean,
    bins = round(max(pos$dist) / 20),
    geom = "point",
    size = 2
  ) +
  labs(title = "Ditribution of Cyp4b1 Expression",
       x = "Distance from center",
       y = "Mean Cyp4b1 Expression"
       ) +
  theme_minimal()