A descriptive title

1. What about the data would you like to make salient?
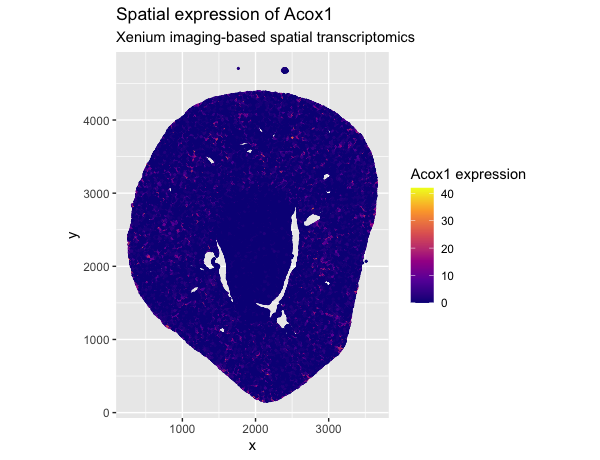
I would like to make salient the spatial expression pattern of the gene Acox1 across individual cells in the tissue.
2. What are the data types represented?
The data include quantitative gene expression data (Acox1 expression counts), spatial quantitative data representing the x- and y-coordinate positions of individual cells, and categorical data where each observation corresponds to a distinct segmented cell.
3. What data encodings (geometric primitives and visual channels) are you using to visualize these data types?
Each cell is represented using a point geometric primitive. The x- and y-position of each point encodes the spatial location of the cell within the tissue. The color visual channel (color intensity) encodes quantitative Acox1 gene expression levels for each cell.
4. What Gestalt principles or knowledge about perceptiveness of visual encodings are you using to accomplish this?
This visualization leverages the Gestalt principle of similarity, as cells with similar Acox1 expression levels are perceived as related through similar color intensity. It also leverages continuity, since smooth spatial gradients in color guide the viewer’s eye across the tissue and make spatial expression patterns salient.
5. Code (paste your code in between the ``` symbols)
1
2
3
4
5
6
7
8
9
10
11
12
13
14
15
16
17
18
file <- "Xenium-IRI-ShamR_matrix.csv.gz"
data <- read.csv(file, stringsAsFactors = FALSE)
dim(data)
colnames(data)[1:10]
head(data)
gene_of_interest <- "Acox1"
# Generate spatial gene expression plot
ggplot(data, aes(x = x, y = y, color = .data[[gene_of_interest]])) +
  geom_point(size = 0.4) +
  scale_color_viridis_c(
    option = "plasma",
    name = paste(gene_of_interest, "expression")
  ) +
  coord_equal() +
  labs(
    title = paste("Spatial expression of", gene_of_interest),
    subtitle = "Xenium imaging-based spatial transcriptomics"
  )