Spatial Visualization of Gene Expression Across Tissue

1. What data types are you visualizing?
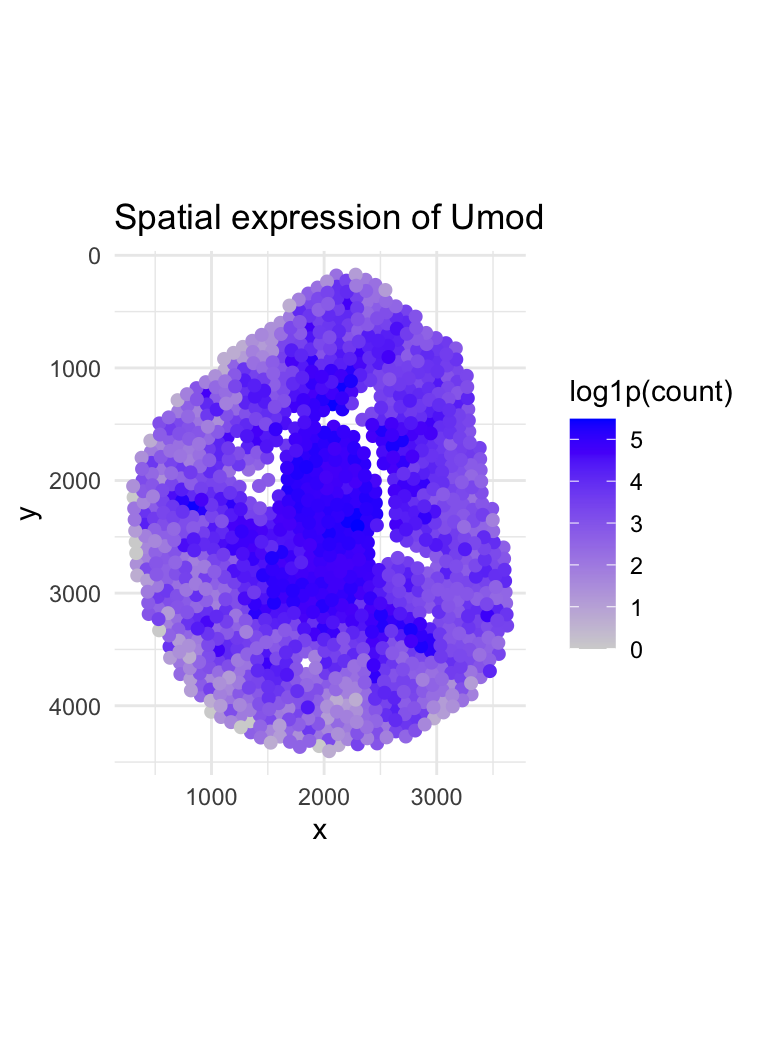
I would like to make salient the spatial distribution of gene expression within the sham tissue, emphasizing how expression of biologically relevant genes varies across different regions of the sample. Making spatial patterns in expression salient helps reveal tissue heterogeneity and localized expression domains that would not be apparent from non-spatial summaries, allowing the viewer to intuitively connect molecular data with physical tissue structure.
2. What data encodings (geometric primitives and visual channels) are you using to visualize these data types?
This data set includes quantitative discrete data in the form of gene expression counts per spatial spot, quantitative continuous data representing the x-y spatial coordinates of each spot, and categorical data such as spot IDs and gene names that function as identifiers.
3. What about the data are you trying to make salient through this data visualization?
The visualization uses points as geometric primitives, with their positions determined by the quantitative x and y spatial coordinates of each spot. Color hue is used as a visual channel to encode quantitative gene expression values, allowing higher and lower expression levels to be visually distinguished across the tissue. This combination of spatial position and color hue supports a direct interpretation of spatial patterns in gene expression.
4. What Gestalt principles or knowledge about perceptiveness of visual encodings are you using to accomplish this?
This visualization uses the Gestalt principle of proximity so that nearby spatial spots are naturally seen as related, making regional gene expression patterns easier to identify. Spatial position is used as the main visual encoding, allowing viewers to accurately understand spatial relationships. Gene expression levels are shown using color hue with a sequential color scale, which makes it easy to compare higher and lower expression values without overwhelming the viewer.
5. Code (paste your code in between the ``` symbols)
1
2
3
4
5
6
7
8
9
10
11
12
13
14
15
16
17
18
19
20
21
22
23
24
25
26
27
28
29
30
31
32
33
34
35
# --- Load packages ---
#install.packages("ggplot2")
library(ggplot2)

# --- Read file (.csv.gz) ---
file <- "Visium-IRI-ShamR_matrix (2).csv.gz"
df <- read.csv(gzfile(file), check.names = FALSE)

# --- Choose a gene to visualize ---
gene <- "Umod"

# --- Prepare data for plotting ---
plot_df <- data.frame(
  x = df$x,
  y = df$y,
  expr = log1p(df[[gene]])
)

# --- Plot: spots as points, position = (x,y), color hue = expression ---
ggplot(plot_df, aes(x = x, y = y, color = expr)) +
  geom_point(size = 1.8) +
  scale_y_reverse() +
  coord_fixed() +
  scale_color_gradient(
    name = "log1p(count)",
    low = "lightgrey",
    high = "blue"
  ) +
  labs(
    title = paste("Spatial expression of", gene),
    x = "x",
    y = "y"
  ) +
  theme_minimal()
Attribution to external resources reference: ChatGPT helped with coding provided above AI provided this prompt:
plot_data <- data.frame(
x = data$x,
y = data$y,
expression = log1p(data[[gene_name]])
##)