plotCorrelationGeneExp
plotCorrelationGeneExp.RdFunction to calculate Pearson's correlation between rows from one SpatialExperiment dataset. To replace the analytical p-value which results in a high false positive rate for autocorrelated spatial patterns, it calculates empirical p-values from empirical null distributions generated from permuting the data and then smoothing to maintain the original degree of autocorrelation
Arguments
- speList
listList of two SpatialExperiment objects with matched spatial locations. The first element corresponds to the first SpatialExperiment (`X`), and the second to the second SpatialExperiment (`Y`).- spatialCorrelation
dataframe: the output from running `spatialCorrelationGeneExp` function on `speList`- geneName
character: A character string specifiying the name of gene (row) in both a SpatialExperiments in `speList`- assayName
characterorintegerA character string or numeric specifying the assay in the SpatialExperiment to use. Default isNULL. If no value is supplied forassayName, then the first assay is used as a default
Value
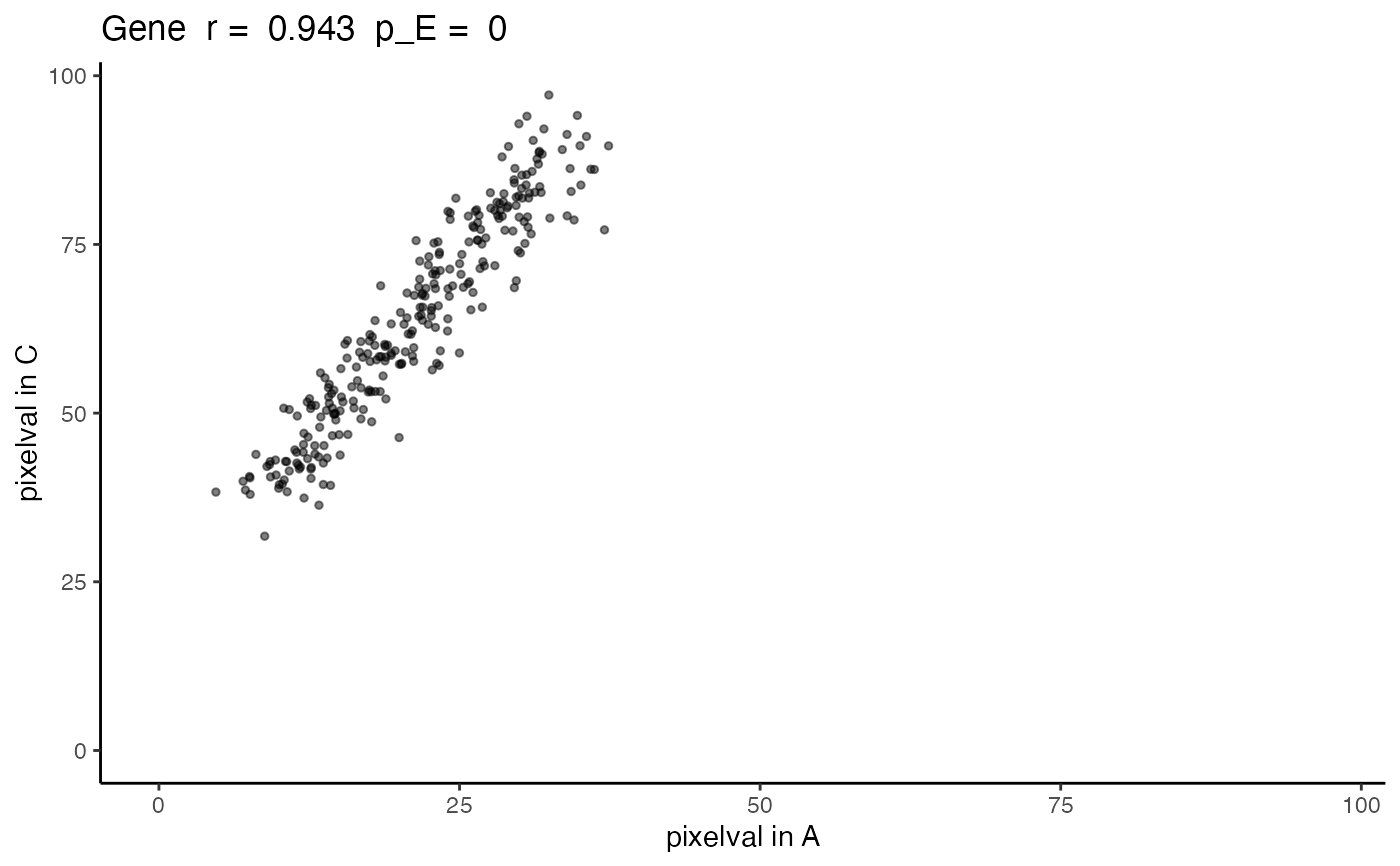
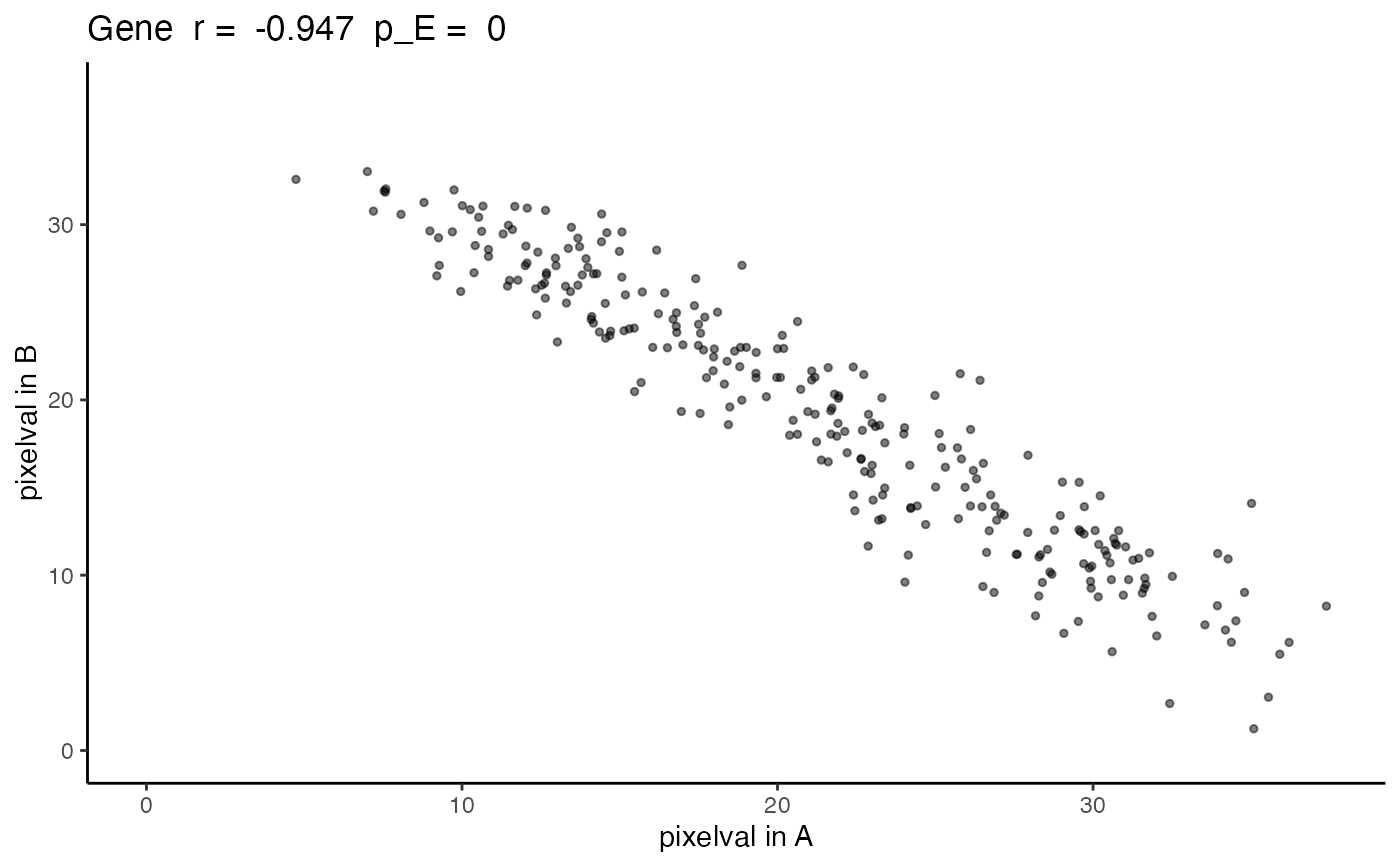
The output is returned as a ggplot grob. A scatterplot with the values of the gene in the first SpatialExperiment, i.e `SummarizedExperiment::assay(speList[[1]], assayName)[geneName, ]`, on the x-axis and values of the gene in the second SpatialExperiment on the y-axis. The title includes the gene name, the correlation coefficient, and the empirical p-value as the greater of `spatialCorrelation$pValuePermuteX`and `spatialCorrelation$pValuePermuteY`.
Examples
data(speKidney)

##### Rasterize to get pixels at matched spatial locations #####
rastKidney <- SEraster::rasterizeGeneExpression(speKidney,
               assay_name = 'counts', resolution = 0.2, fun = "mean",
               BPPARAM = BiocParallel::MulticoreParam(), square = FALSE)

##### Use STcompare to calculate Pearson's correlation coefficient #####
rastGexpListAB <- list(A = rastKidney$A, B = rastKidney$B)
rastGexpListAC <- list(A = rastKidney$A, C = rastKidney$C)

negCorrelation <- spatialCorrelationGeneExp(rastGexpListAB)
#> 1: Gene
posCorrelation <- spatialCorrelationGeneExp(rastGexpListAC)
#> 1: Gene

negCorrelation
#>      correlationCoef   pValueNaive pValuePermuteX pValuePermuteY
#> Gene      -0.9472813 5.652003e-136              0              0
#>      deltaStarMedianX deltaStarMedianY   deltaStarX   deltaStarY
#> Gene              0.2              0.2 0.2, 0.2.... 0.2, 0.2....
#>      nullCorrelationsX nullCorrelationsY
#> Gene      -0.16074....      -0.08458....
posCorrelation
#>      correlationCoef   pValueNaive pValuePermuteX pValuePermuteY
#> Gene       0.9431531 1.409195e-133              0              0
#>      deltaStarMedianX deltaStarMedianY   deltaStarX   deltaStarY
#> Gene              0.2              0.2 0.2, 0.4.... 0.2, 0.2....
#>      nullCorrelationsX nullCorrelationsY
#> Gene      -0.00632....      0.052321....

expAB <- plotCorrelationGeneExp(rastGexpListAB, negCorrelation, "Gene")
expAC <- plotCorrelationGeneExp(rastGexpListAC, posCorrelation, "Gene")

expAB
#> Ignoring unknown labels:
#> • fill : "Data"

expAC
#> Ignoring unknown labels:
#> • fill : "Data"
expAC
#> Ignoring unknown labels:
#> • fill : "Data"