Generates and saves comprehensive visualization plots for specified genes.
savePlots.RdThis function creates a multi-panel plot for each gene showing spatial expression patterns, pixel classifications, and correlation analysis. Each gene generates a four-panel figure that is saved as a PDF file.
Arguments
- geneNames
Character vector. Names of genes to visualize and save.
- spatialSimilarity
A list. Results from `spatialSimilarity()` containing similarity tables and analysis parameters.
- rastGexp
A list of two SpatialExperiment objects. Rasterized gene expression data from the spatial experiments being compared.
- assayName
A character string or numeric specifying the assay in the Spatial Experiment to use. Default is
NULL. If no value is supplied forassayName, then the first assay is used as a default- filePath
Character. Directory path where PDF files will be saved.
Value
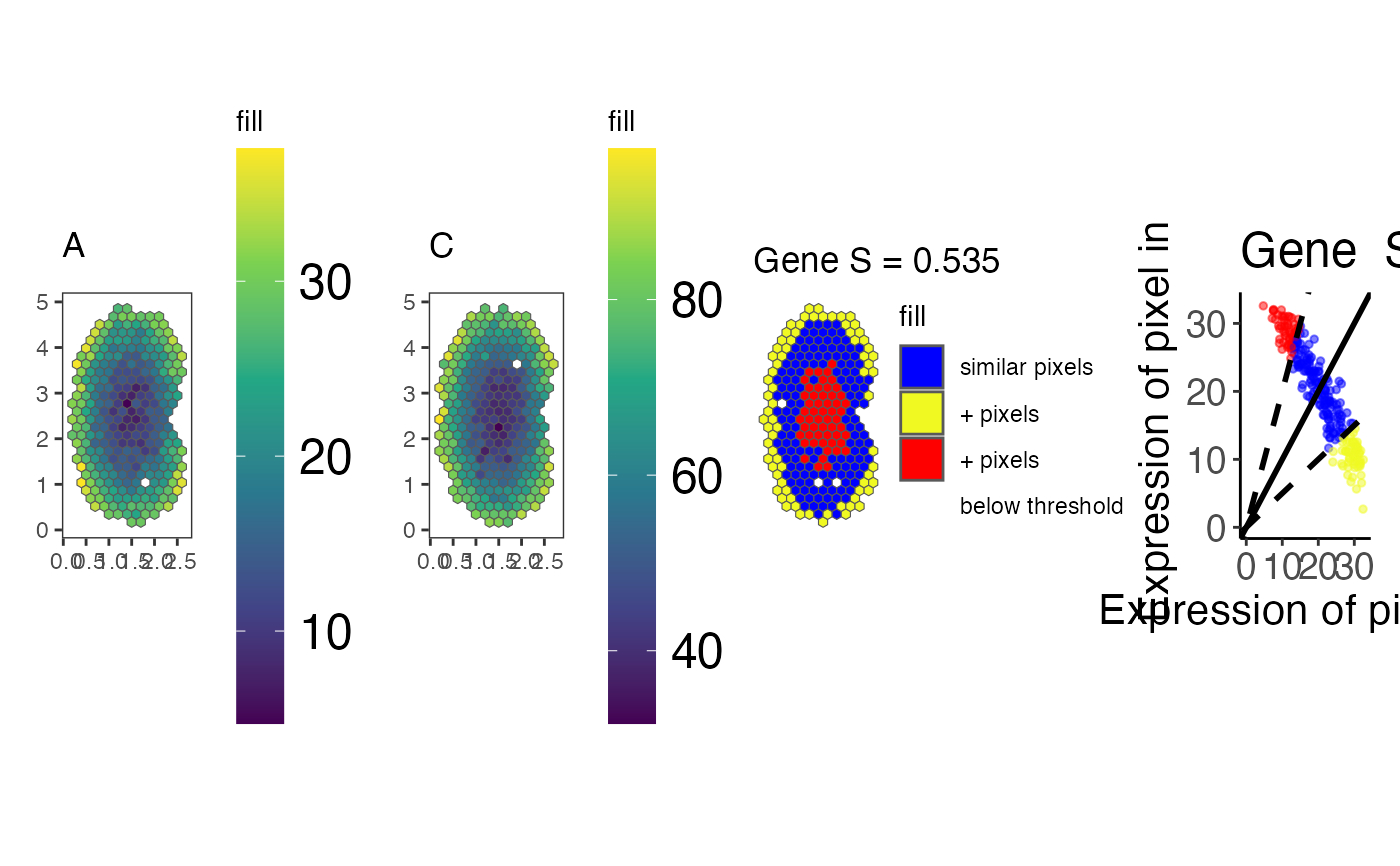
A list containing the arranged plot objects for each gene, with gene names as list element names. Each plot object is a four-panel arrangement showing:
Panel 1:Spatial expression plot for the first experiment.
Panel 2:Spatial expression plot for the second experiment.
Panel 3:Pixel classification plot showing similarity categories.
Panel 4:Linear regression scatter plot comparing expression between experiments.
Details
The function saves each gene's visualization as a PDF file named "gene_name.pdf" in the specified directory. Plot dimensions are set to 17 inches wide by 5 inches tall at 300 DPI resolution.
Examples
data(speKidney)
#' ##### Rasterize to get pixels at matched spatial locations #####
rastKidney <- SEraster::rasterizeGeneExpression(speKidney,
                assay_name = 'counts', resolution = 0.2, fun = "mean",
                BPPARAM = BiocParallel::MulticoreParam(), square = FALSE)
s <- spatialSimilarity(list(rastKidney$A, rastKidney$B))
plts <- savePlots("Gene", s, rastKidney)
#> Coordinate system already present.
#> ℹ Adding new coordinate system, which will replace the existing one.
#> Coordinate system already present.
#> ℹ Adding new coordinate system, which will replace the existing one.
#> Coordinate system already present.
#> ℹ Adding new coordinate system, which will replace the existing one.
plts
#> $Gene
#> Warning: Removed 15 rows containing missing values or values outside the scale range
#> (`geom_point()`).

#>
#>