Visualization of Spatial Distribution of Mature Oligodendrocyte with Marker Genes

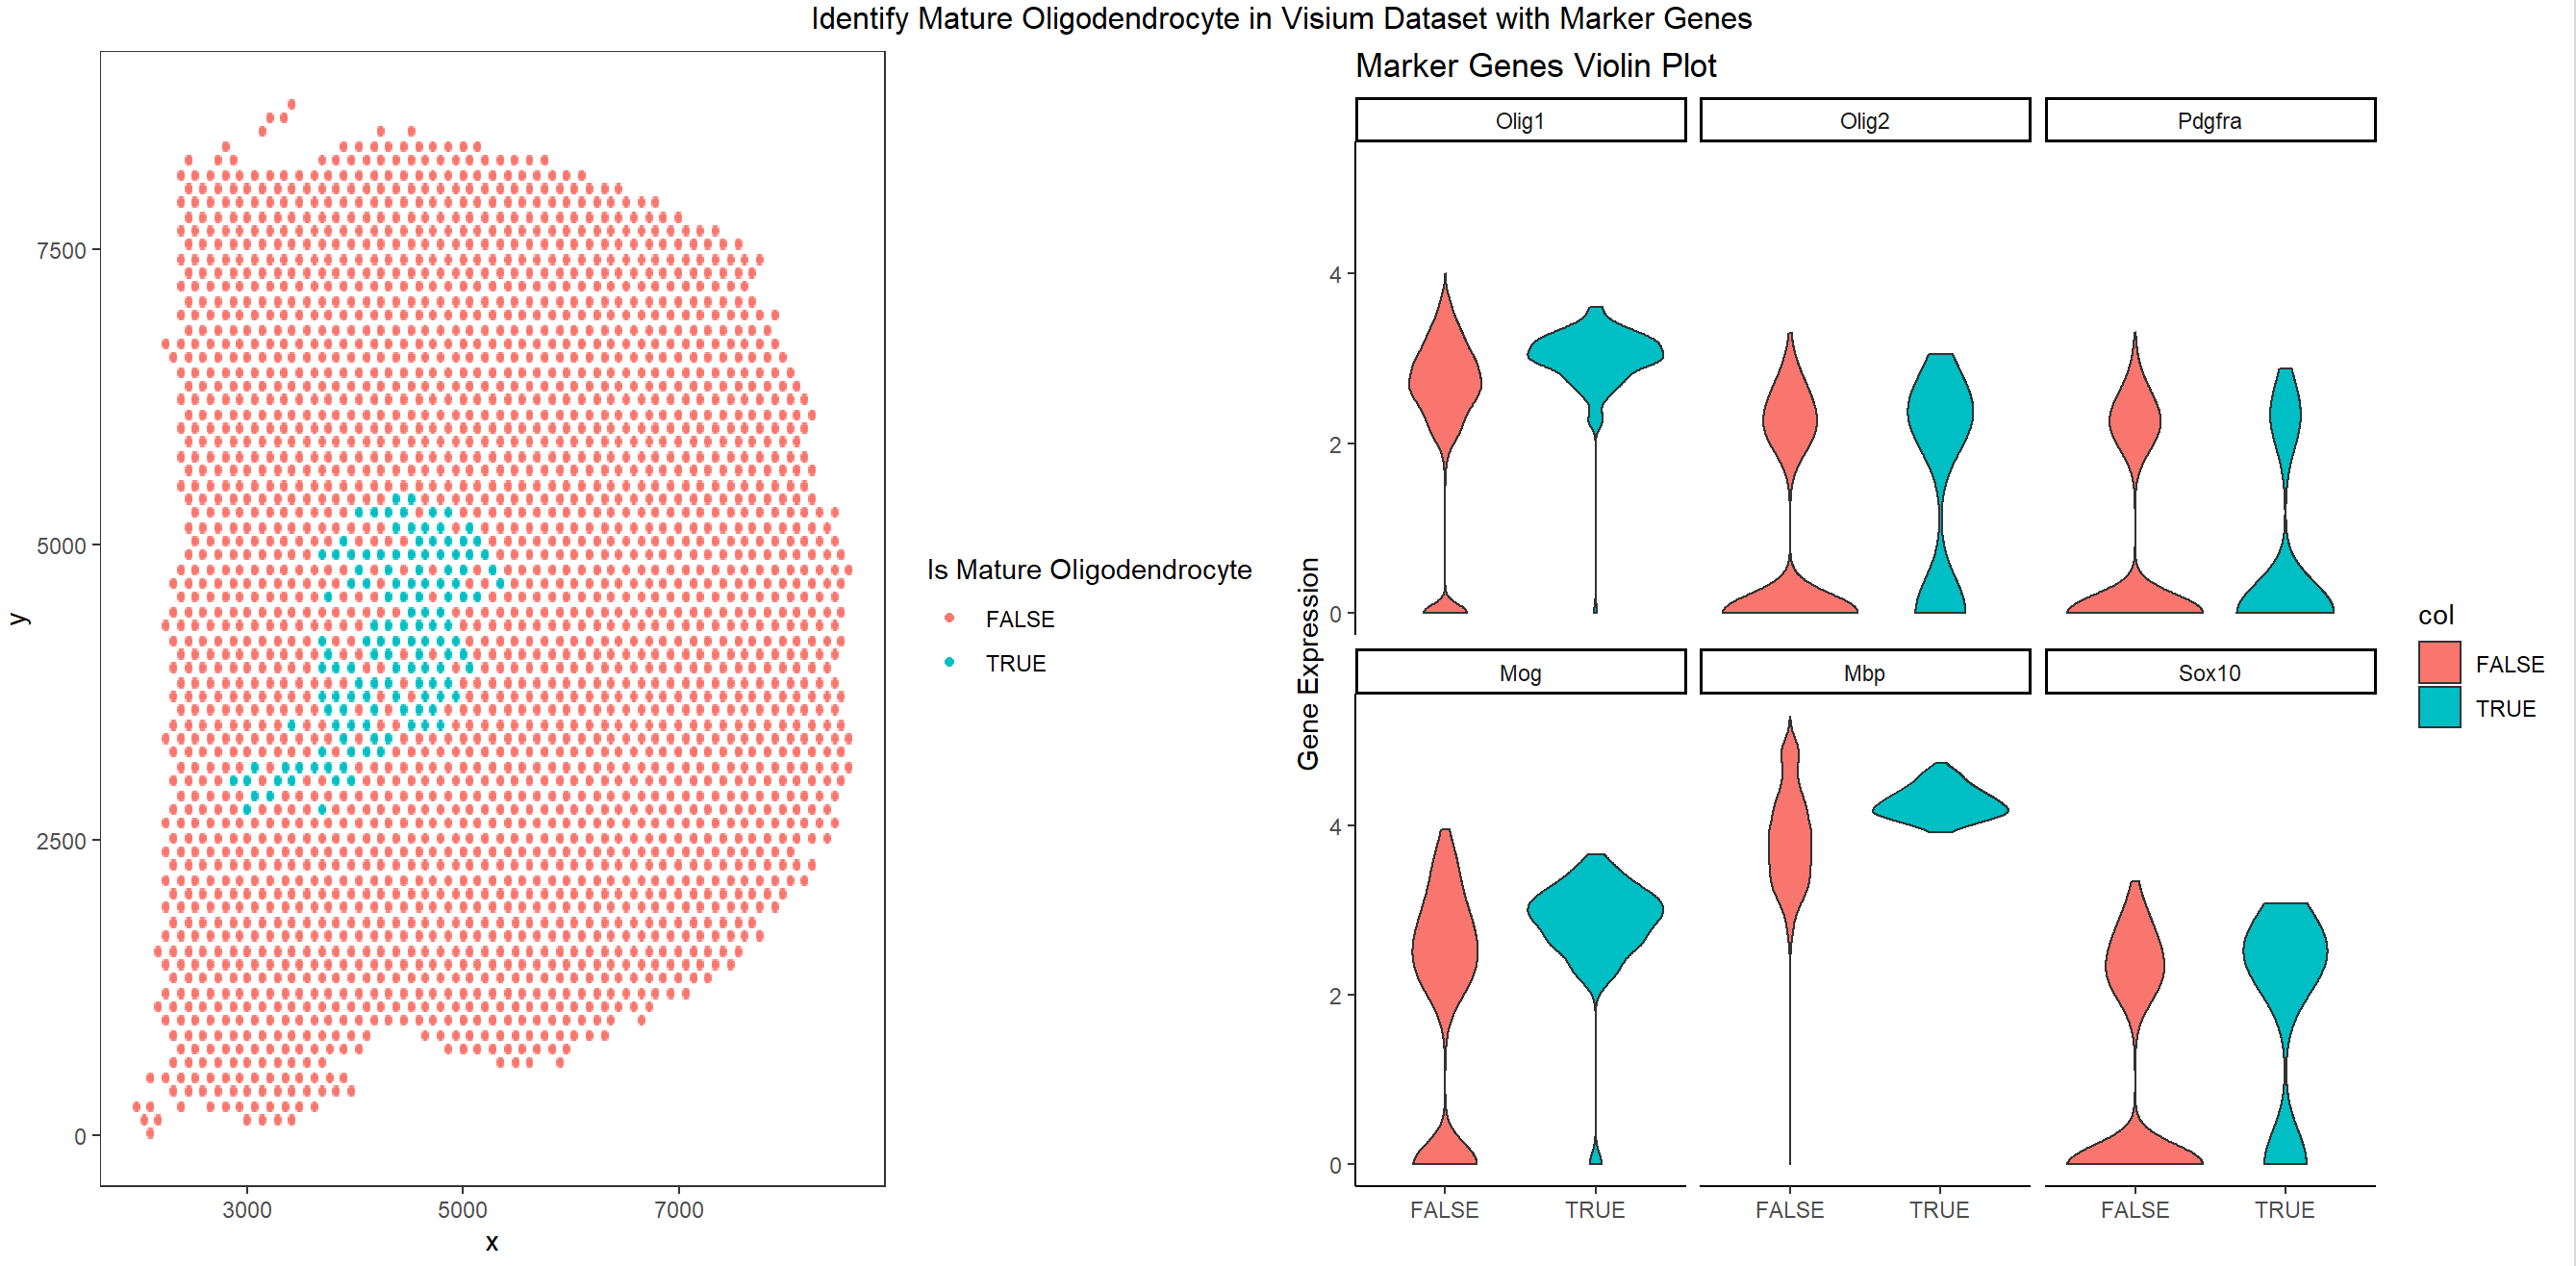
This code tries to find optimal k that clusters the gene so that one cluster has differential expression of marker gene. We need Oligo1, and Oligo2 to be highly expressed, and we need Pdgfra to be in low expression.
We find a group of cells that satisfy this condition and the cells are plotted showing the spatial distribution of mature oligodendrocyte.
The gene expression violin plot is also shown in the plot on the right. We can see that the cells we selected has higher expression of Oligo1 in average. More cells have relatively higher Oligo2 expression, and more cells have relatively lower Pdgfra expression. The other 3 genes: Mog, Mbp, and Sox10 are also highly expressed in those cells. Therefore, the group of cells are likely to be mature Oligodendrocyte.
1
2
3
4
5
6
7
8
9
10
11
12
13
14
15
16
17
18
19
20
21
22
23
24
25
26
27
28
29
30
31
32
33
34
35
36
37
38
39
40
41
42
43
44
45
46
47
48
49
50
51
52
53
54
55
56
57
58
59
60
61
62
63
64
65
66
67
68
69
70
71
72
73
74
75
76
77
library(ggplot2)
library(Rtsne)
library(gridExtra)
library(scattermore)
visium_data = read.csv("~/genomic-data-visualization/data/Visium_Cortex_varnorm.csv.gz",
                       row.names = 1)
visium_data_gene = visium_data[, c(3:ncol(visium_data))]
# Normalization:
visium_data_gene_normal = visium_data_gene/rowSums(visium_data_gene)*1e6
visium_data_gene_normal = log10(visium_data_gene_normal + 1)

g1 = "Olig1"
g2 = "Olig2"
g3 = "Pdgfra"
group_list = c()
found = FALSE
k = 20

# Find optimal cluster that has differential expression of marker genes
while(!found)
{
  k_clusters = kmeans(visium_data_gene_normal, centers = k)
  visium_data_gene_normal$cluster = as.factor(k_clusters$cluster)
  for (i in 1:k)
  {
    group = visium_data_gene_normal$cluster == i
    test_stat_g1 = wilcox.test(visium_data_gene_normal[group, g1],
                               visium_data_gene_normal[!group, g1], alternative = "greater")
    test_stat_g2 = wilcox.test(visium_data_gene_normal[group, g2],
                               visium_data_gene_normal[!group, g2], alternative = "greater")
    test_stat_g3 = wilcox.test(visium_data_gene_normal[group, g3],
                               visium_data_gene_normal[!group, g3], alternative = "less")
    if (test_stat_g1$p.value < 0.01 & test_stat_g2$p.value < 0.01 & test_stat_g3$p.value < 0.01)
      group_list = append(group_list, i)
  }
  if (length(group_list) == 1)
  {
    found = TRUE
  }
  else
    k = k - 1
  if (k < 2)
  {
    print("Cannot find a group. ")
    break
  }
  print(k)
}

cells_interest = visium_data_gene_normal$cluster == group_list[1]

pos_df = visium_data[, 1:2]

# Visuailze Spatial Distribution
p1 = ggplot(pos_df, aes(x = x, y = y)) +
  geom_scattermore(aes(col = cells_interest), pointsize = 2) + theme_bw() +
  theme(panel.grid.major = element_blank(), panel.grid.minor = element_blank()) +
  labs(color = "Is Mature Oligodendrocyte")


df <- reshape2::melt(
  data.frame(id=rownames(visium_data_gene_normal),
             visium_data_gene_normal[, c('Olig1', 'Olig2', 'Pdgfra', 'Mog', 'Mbp', 'Sox10')],
             col=as.factor(cells_interest)))

# Visualize Marker Genes
p2 = ggplot(data = df,
       mapping = aes(x=col, y=value, fill=col)) +
  geom_violin() +
  theme_classic() +
  facet_wrap(~ variable) + ggtitle("Marker Genes Violin Plot") +
  ylab("Gene Expression") + xlab("") + labs(color = "Is Mature Oligodendrocyte")

png("~/genomic-data-visualization/homework/hw4/yuqiz.png", width = 1200, height = 500)
grid.arrange(p1, p2, ncol = 2,
             top = "Identify Mature Oligodendrocyte in Visium Dataset with Marker Genes")
dev.off()