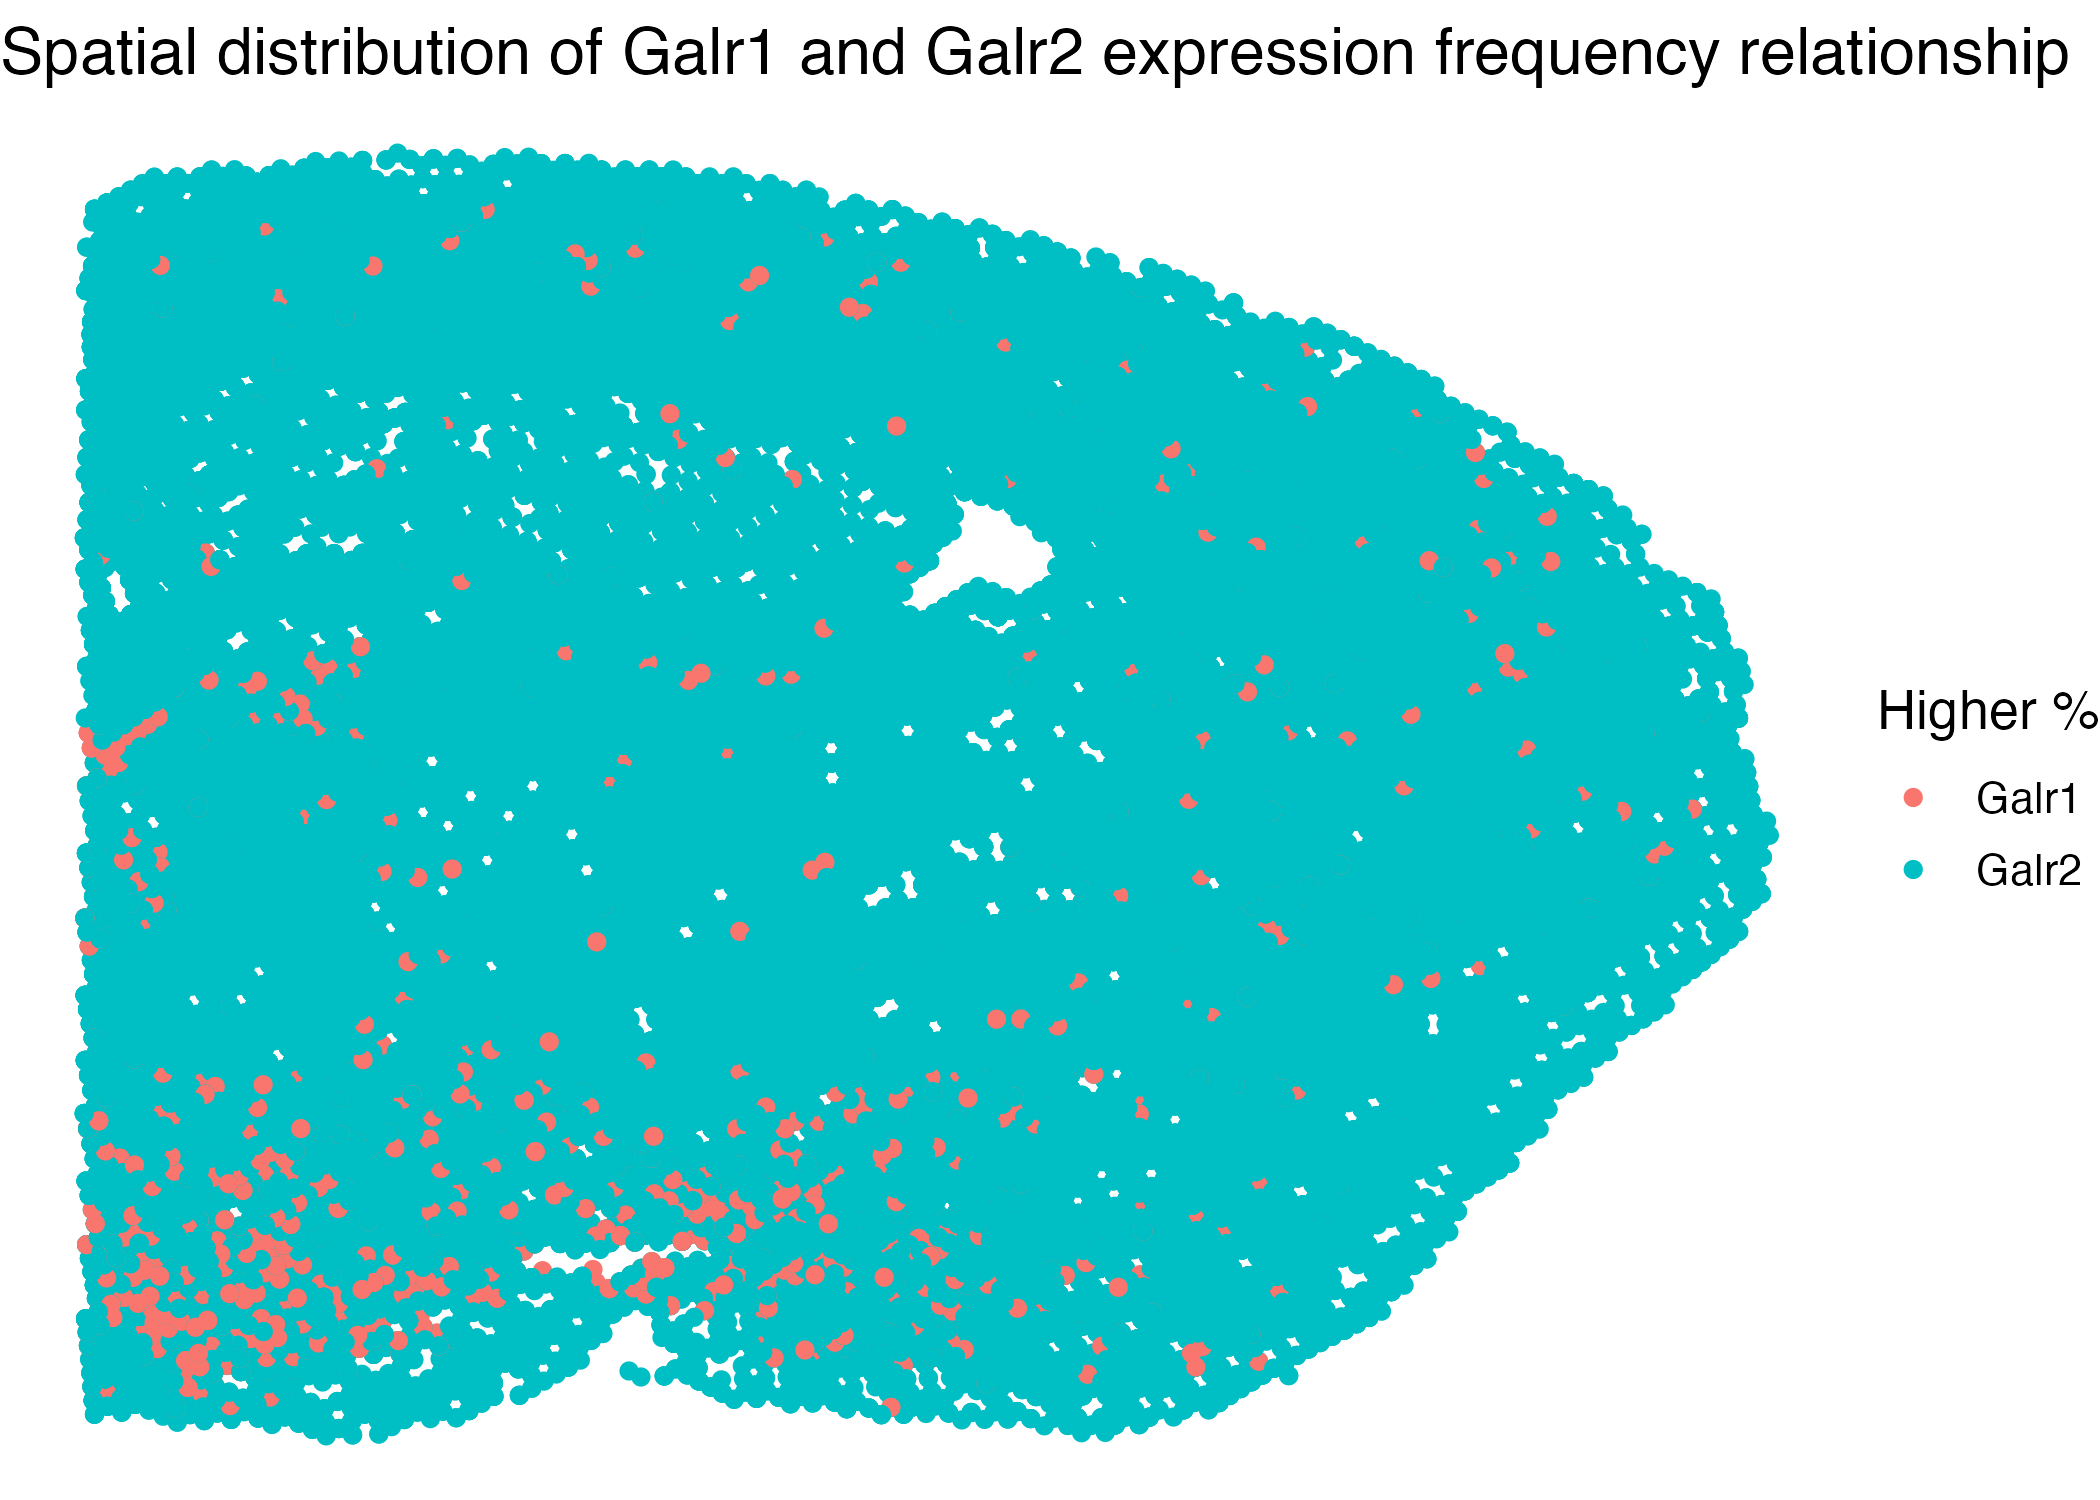
This visualization compares the Galr1 and Galr2 expression frequencies across different brain areas. The expression frequencies are quantitative, computed by dividing the counts over the total RNA counts per cell....
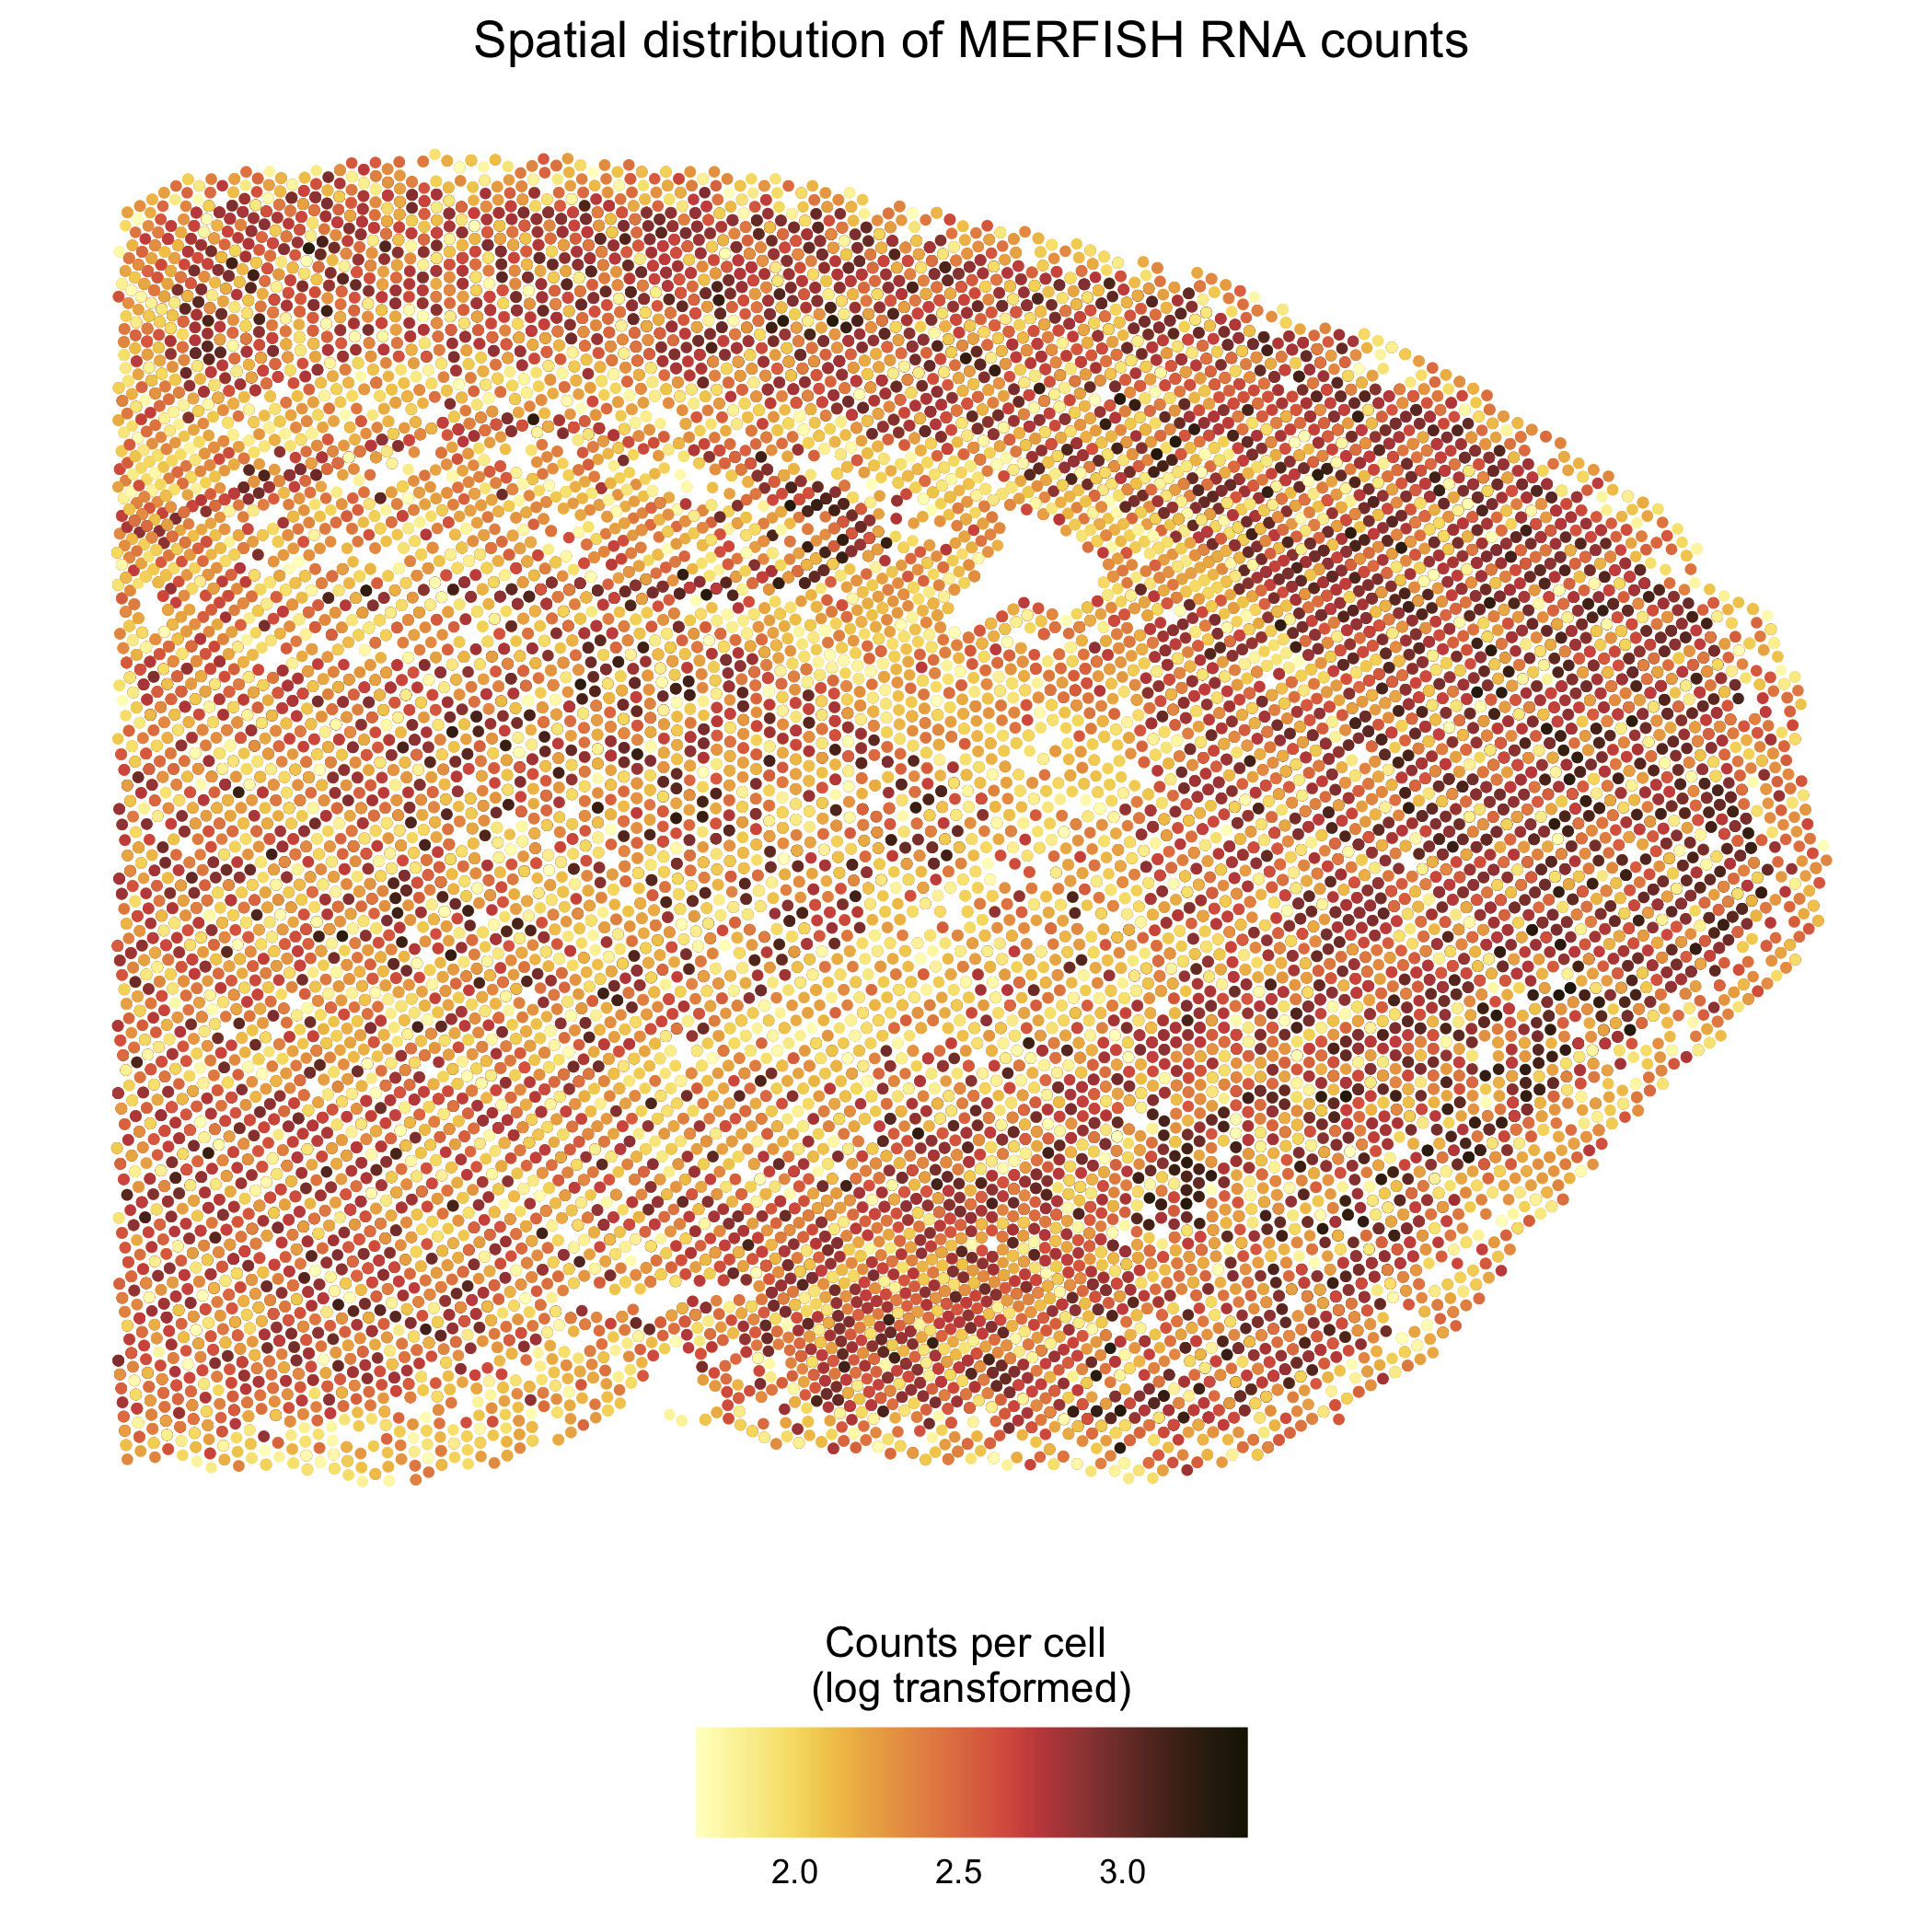
I am visualizing the relationship between the position of cells in the MERFISH dataset (quantitative) and the total RNA counts per cell (quantitative).
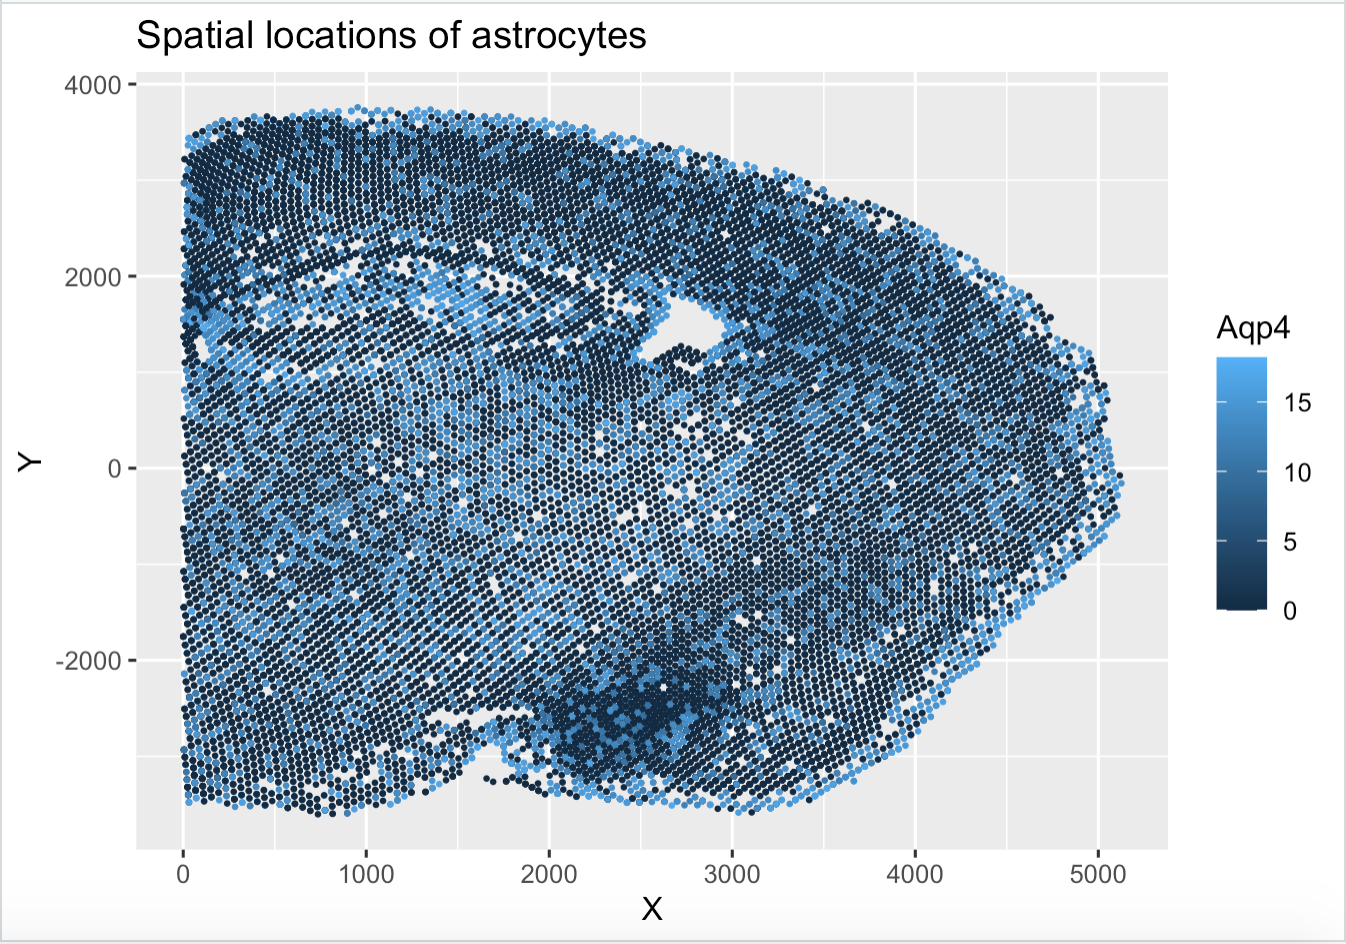
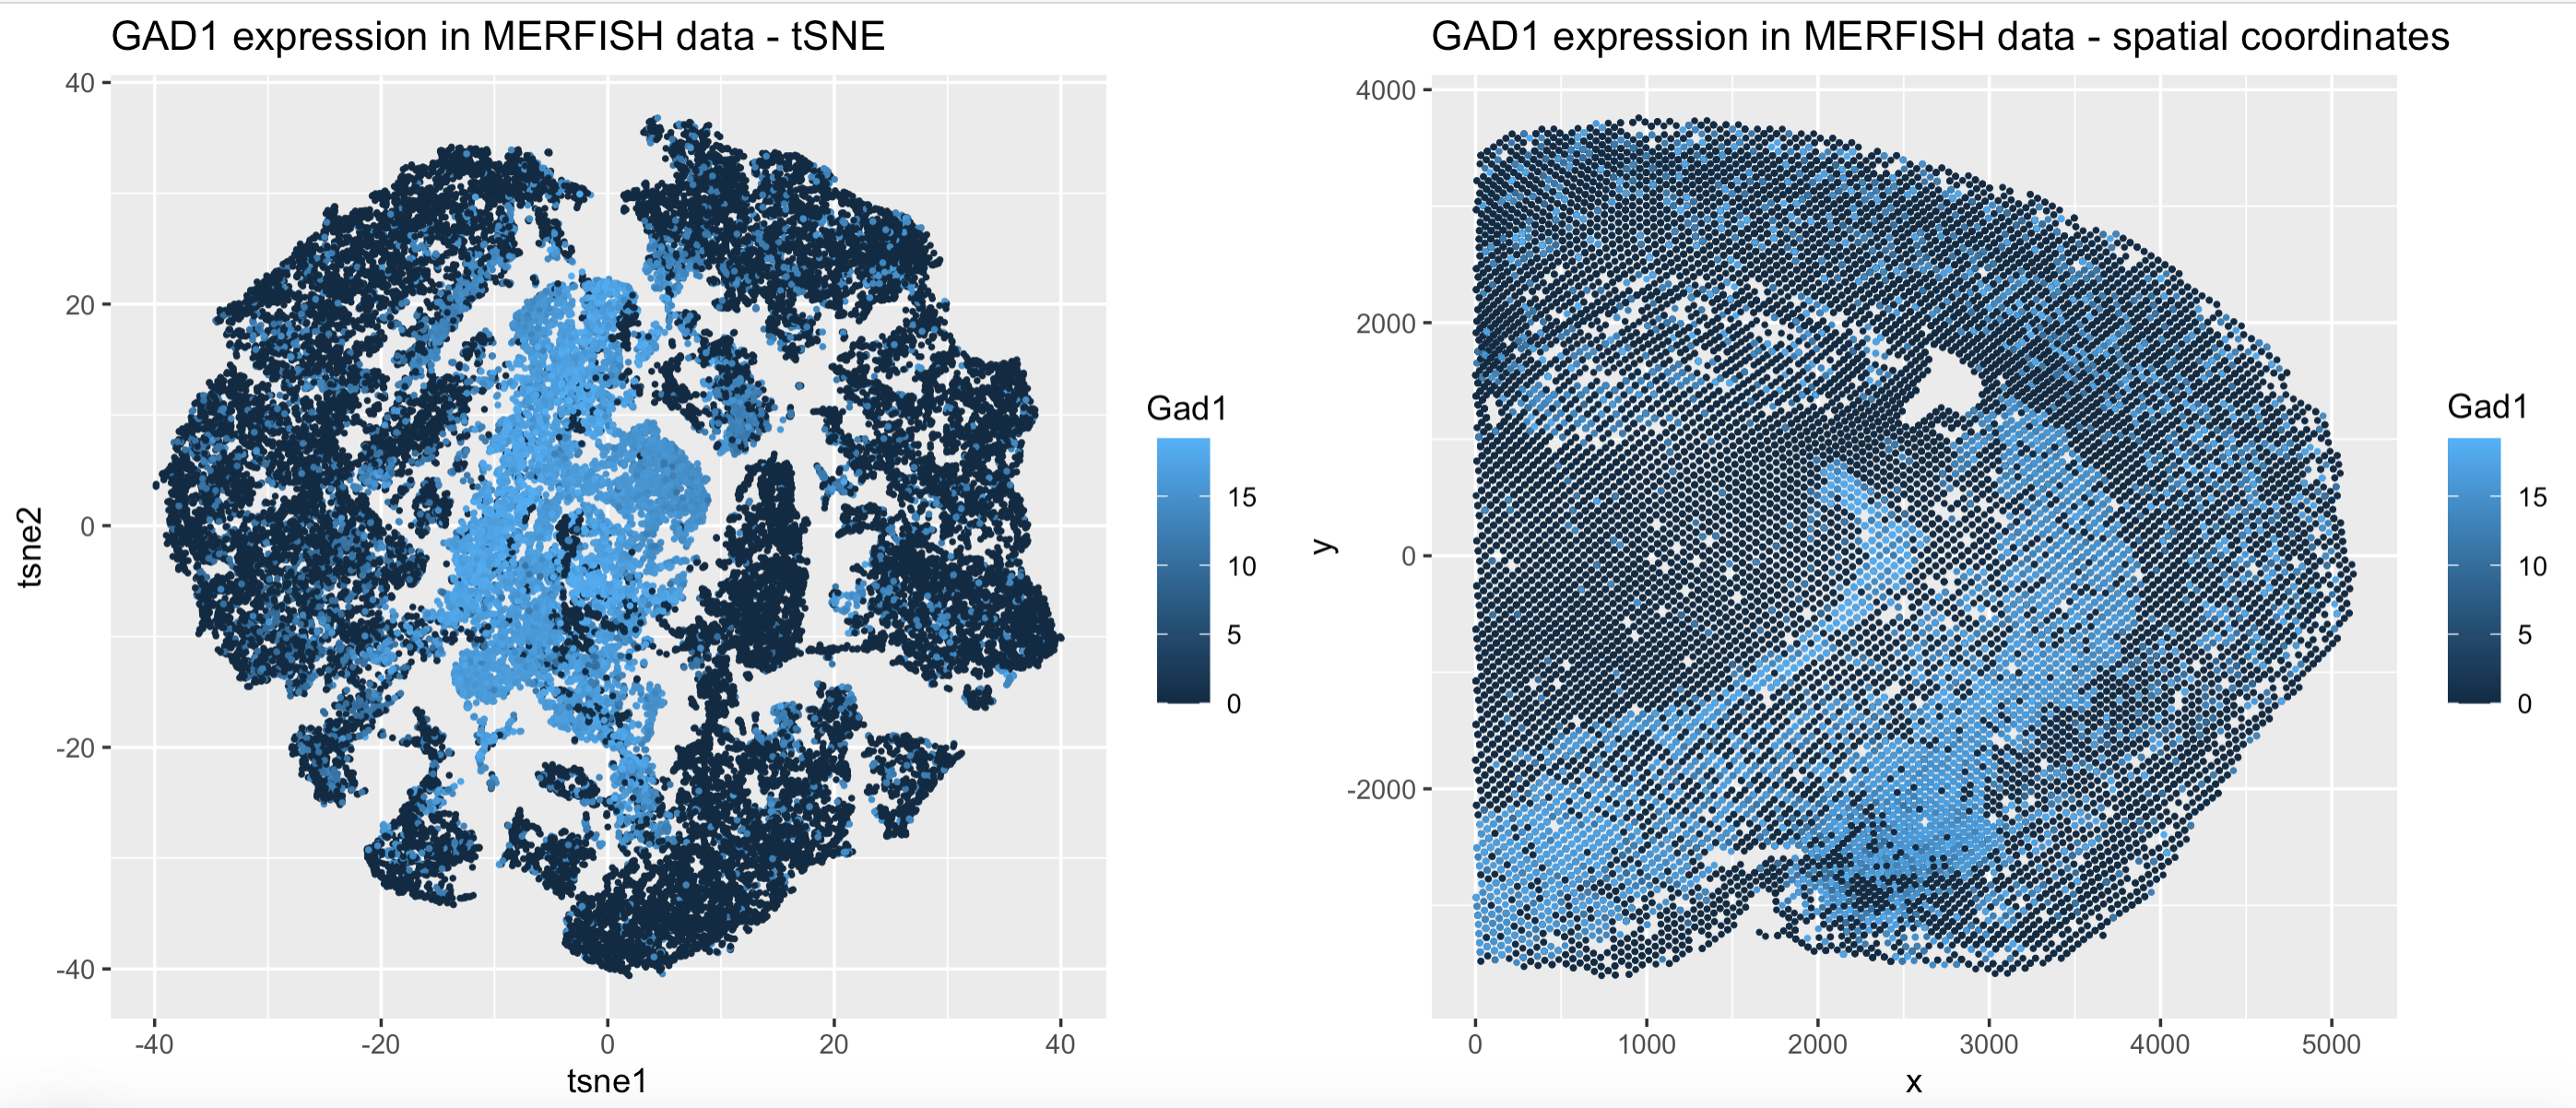
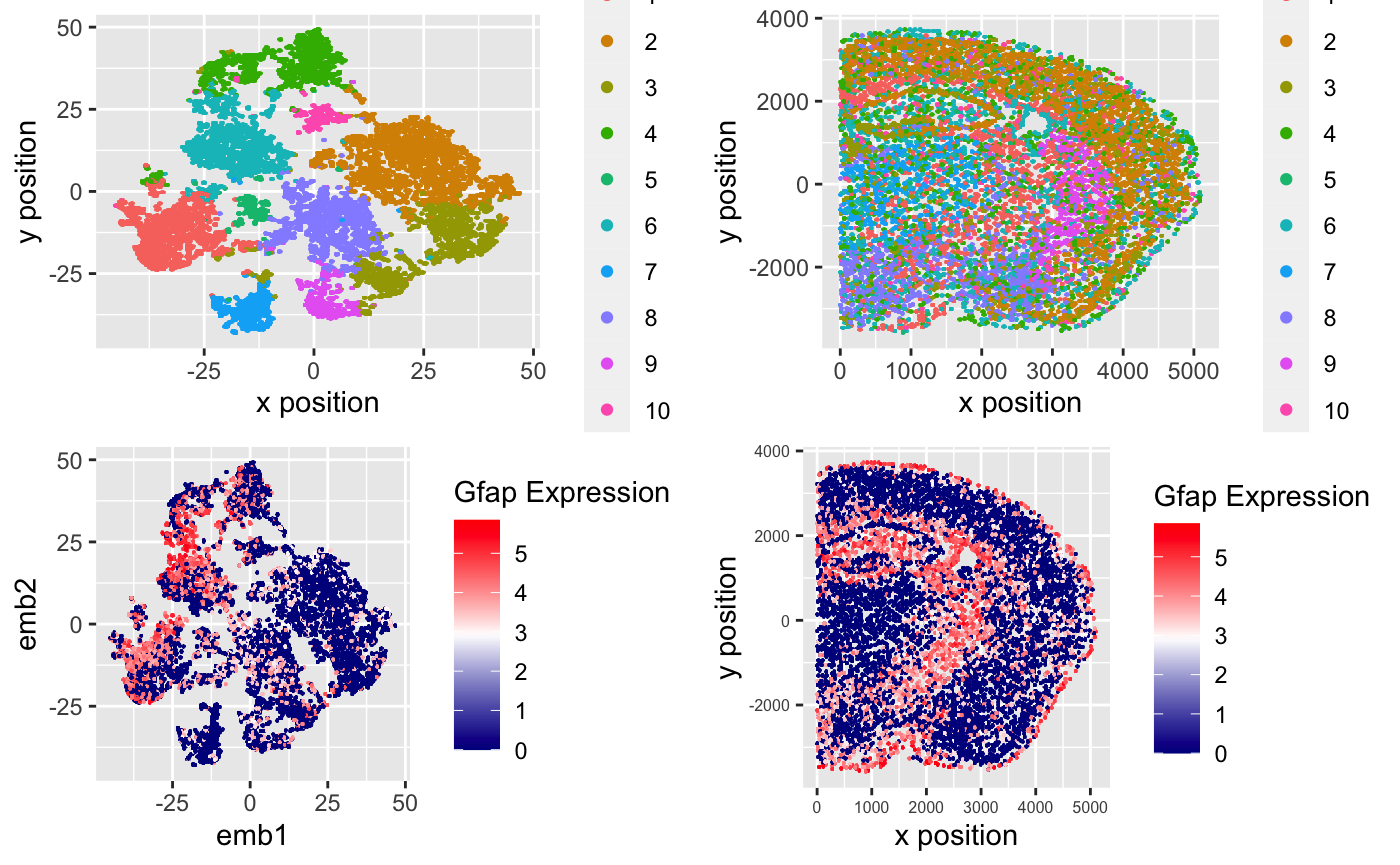
I am making a visualization of the relationship between the spatial location (quantitative) and the expression (quantitative) of Aqp4, a common marker gene for astrocytes in the merfish dataset. The...
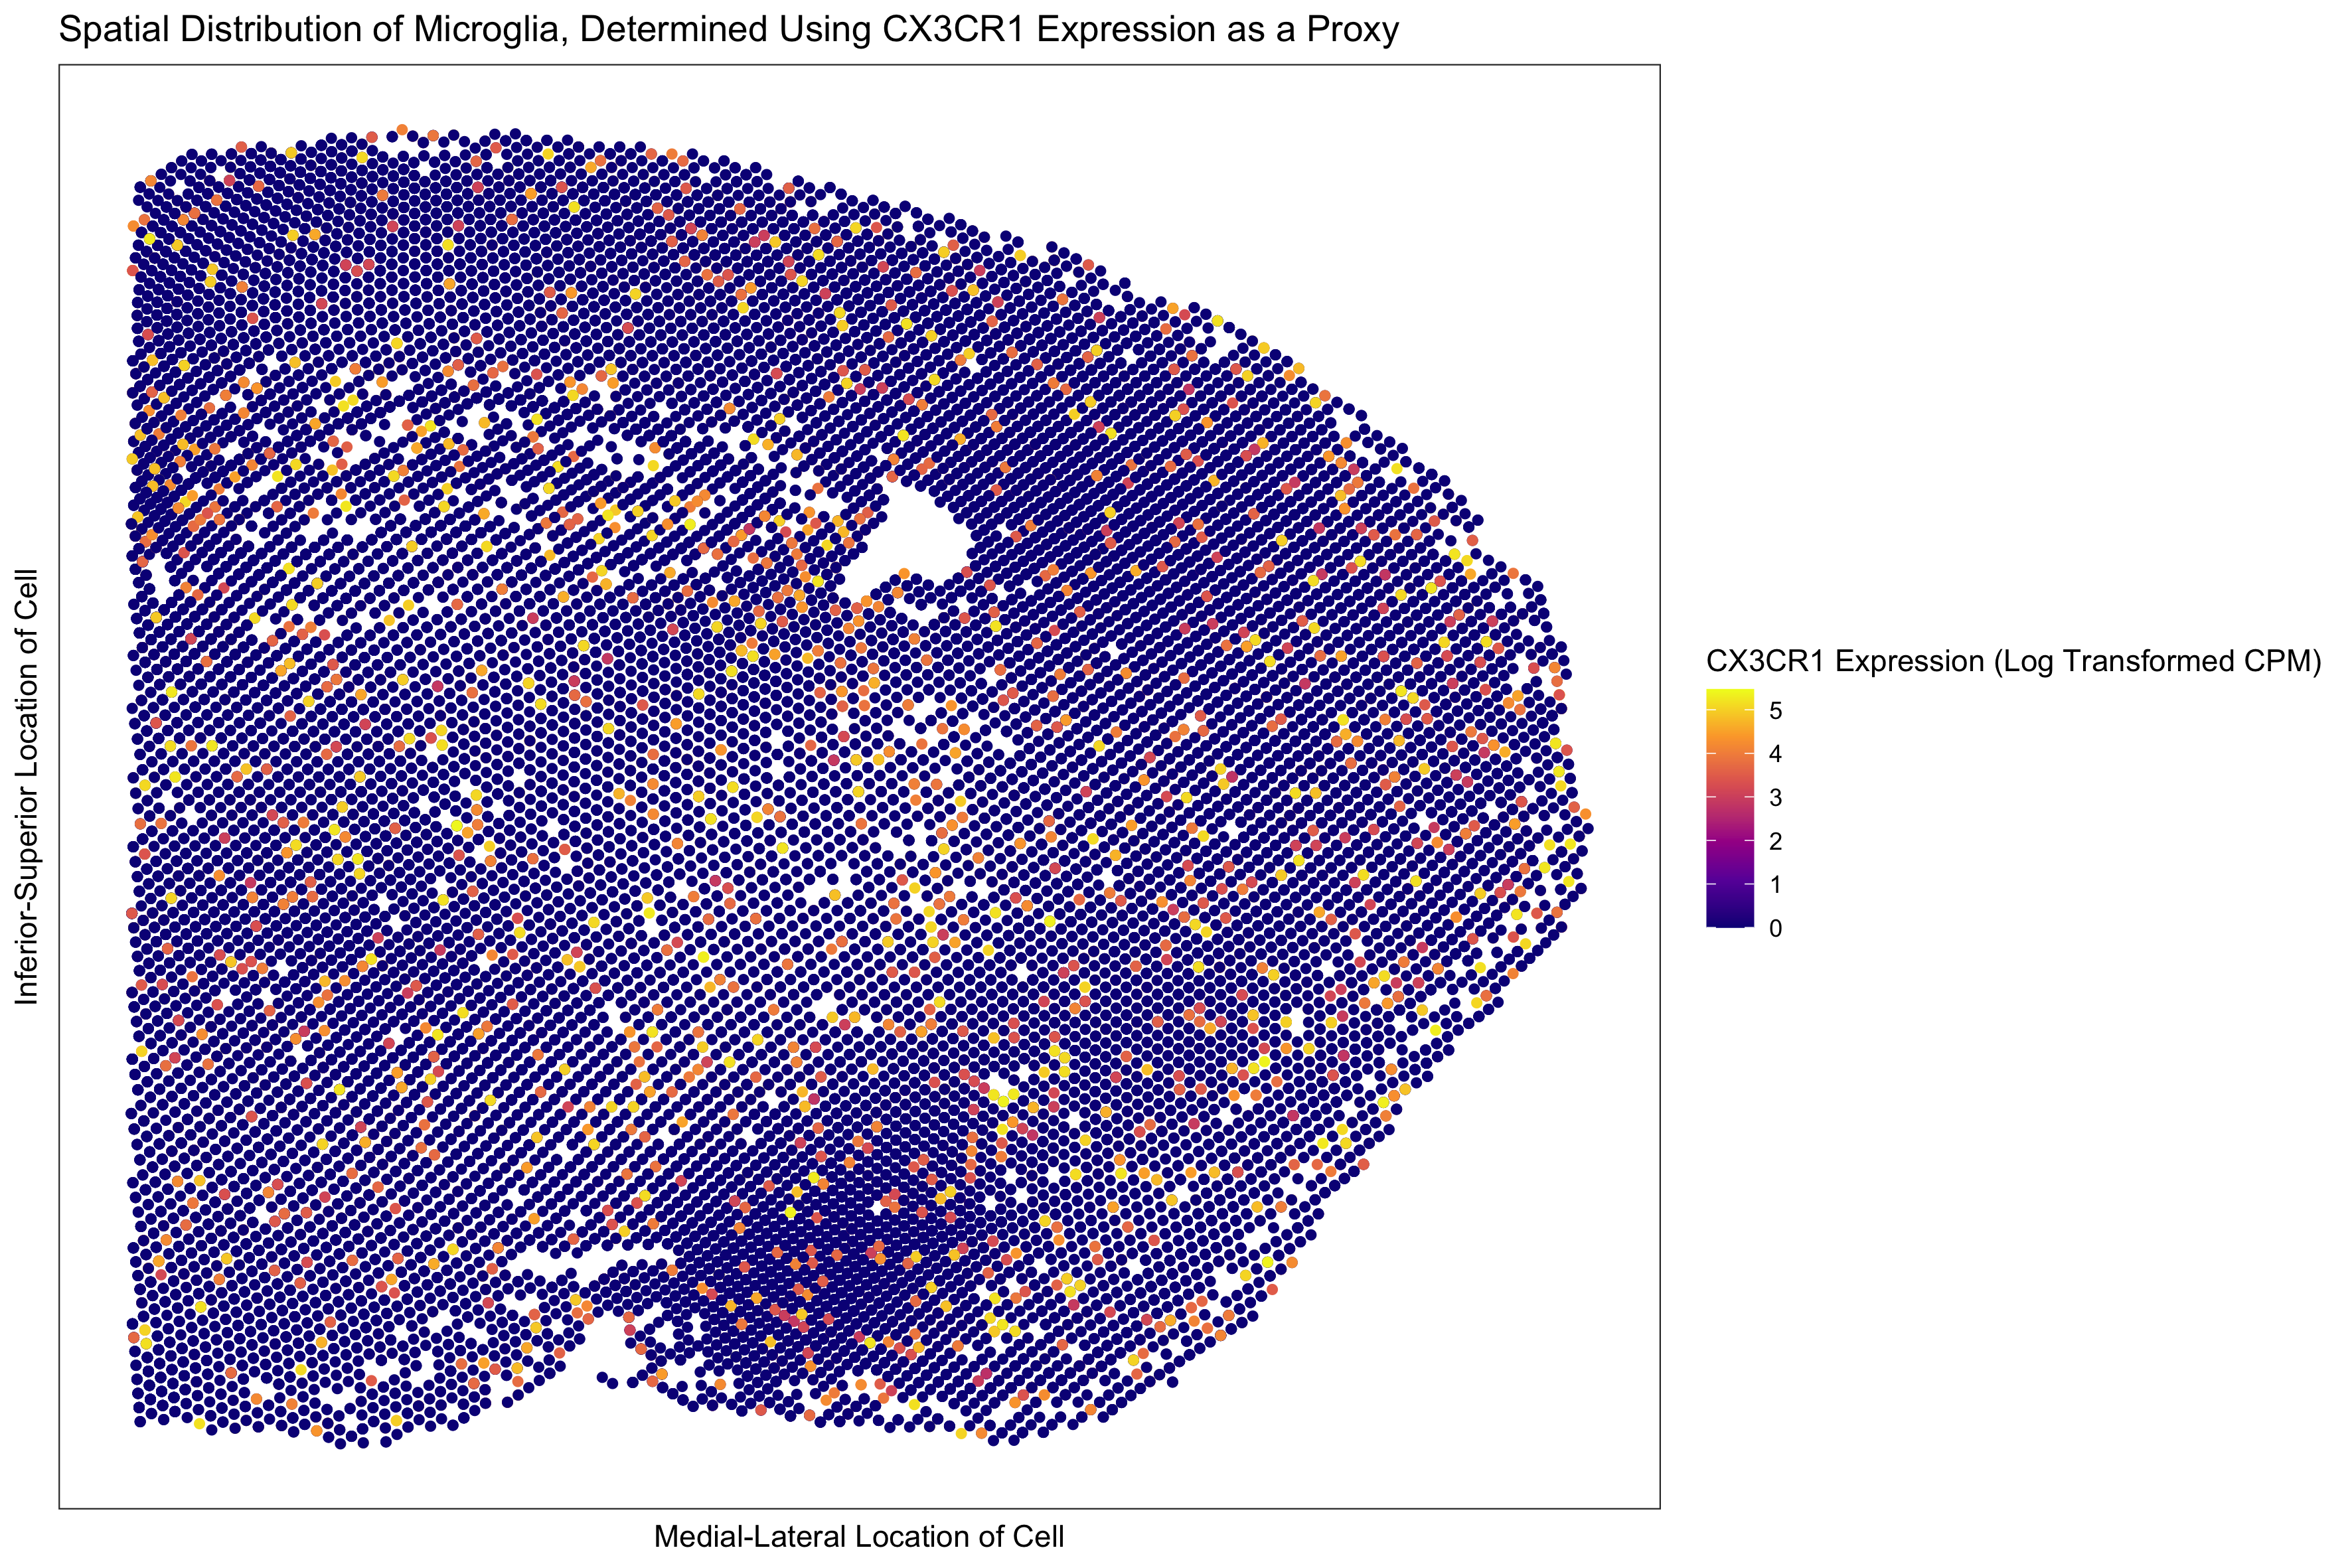
For homework 1, I chose to visualize quantitative data regarding the levels of expression of CX3CR1 (a marker whose expression I am using as a proxy for the identification of...
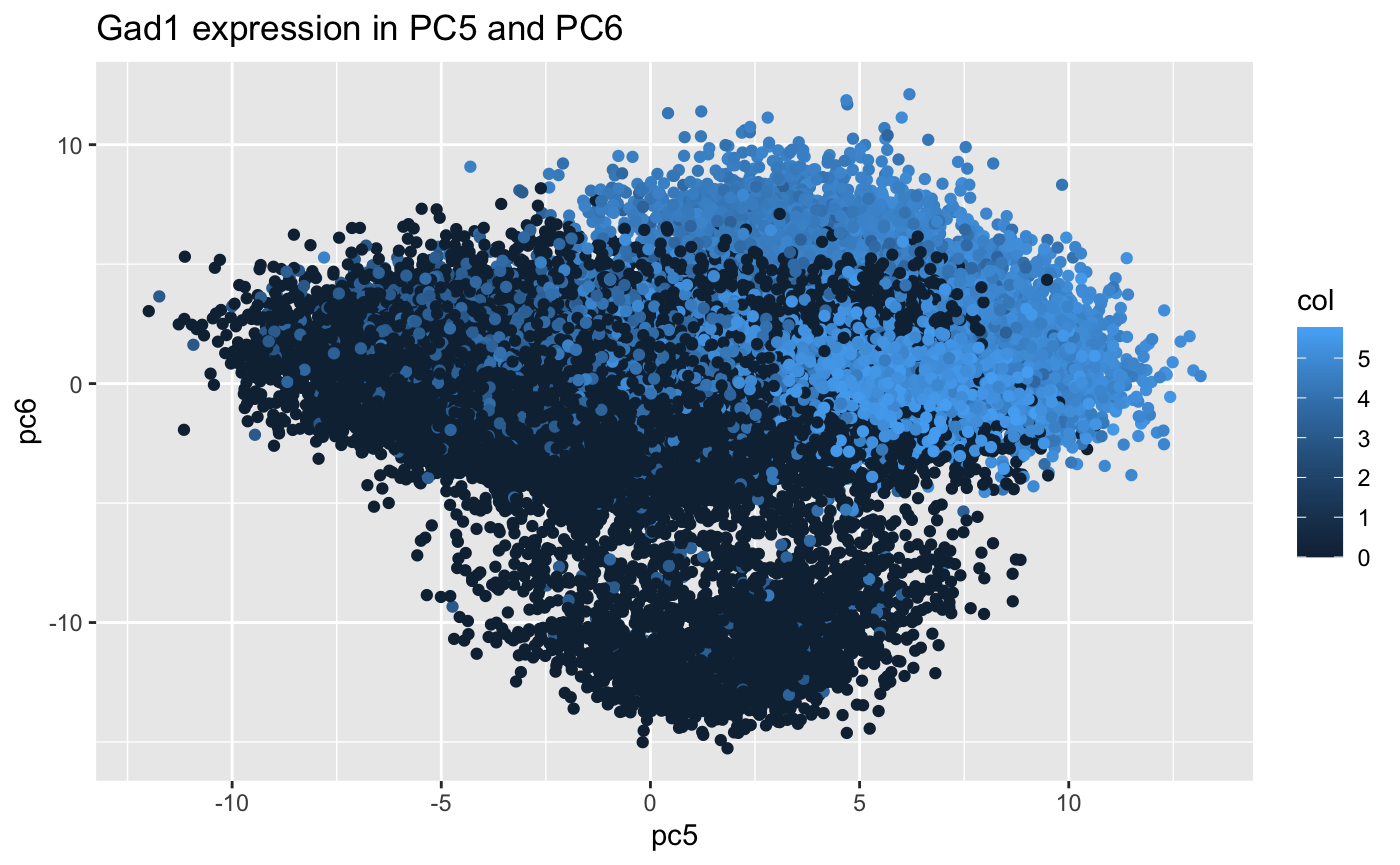
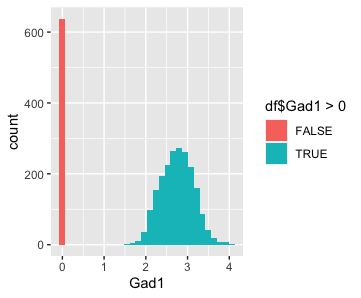
I am visualizing quantitative data of the expression level of the Gad1 gene, as well as ordinal data of the detection of the Gad1 gene, across spots in the Visium...
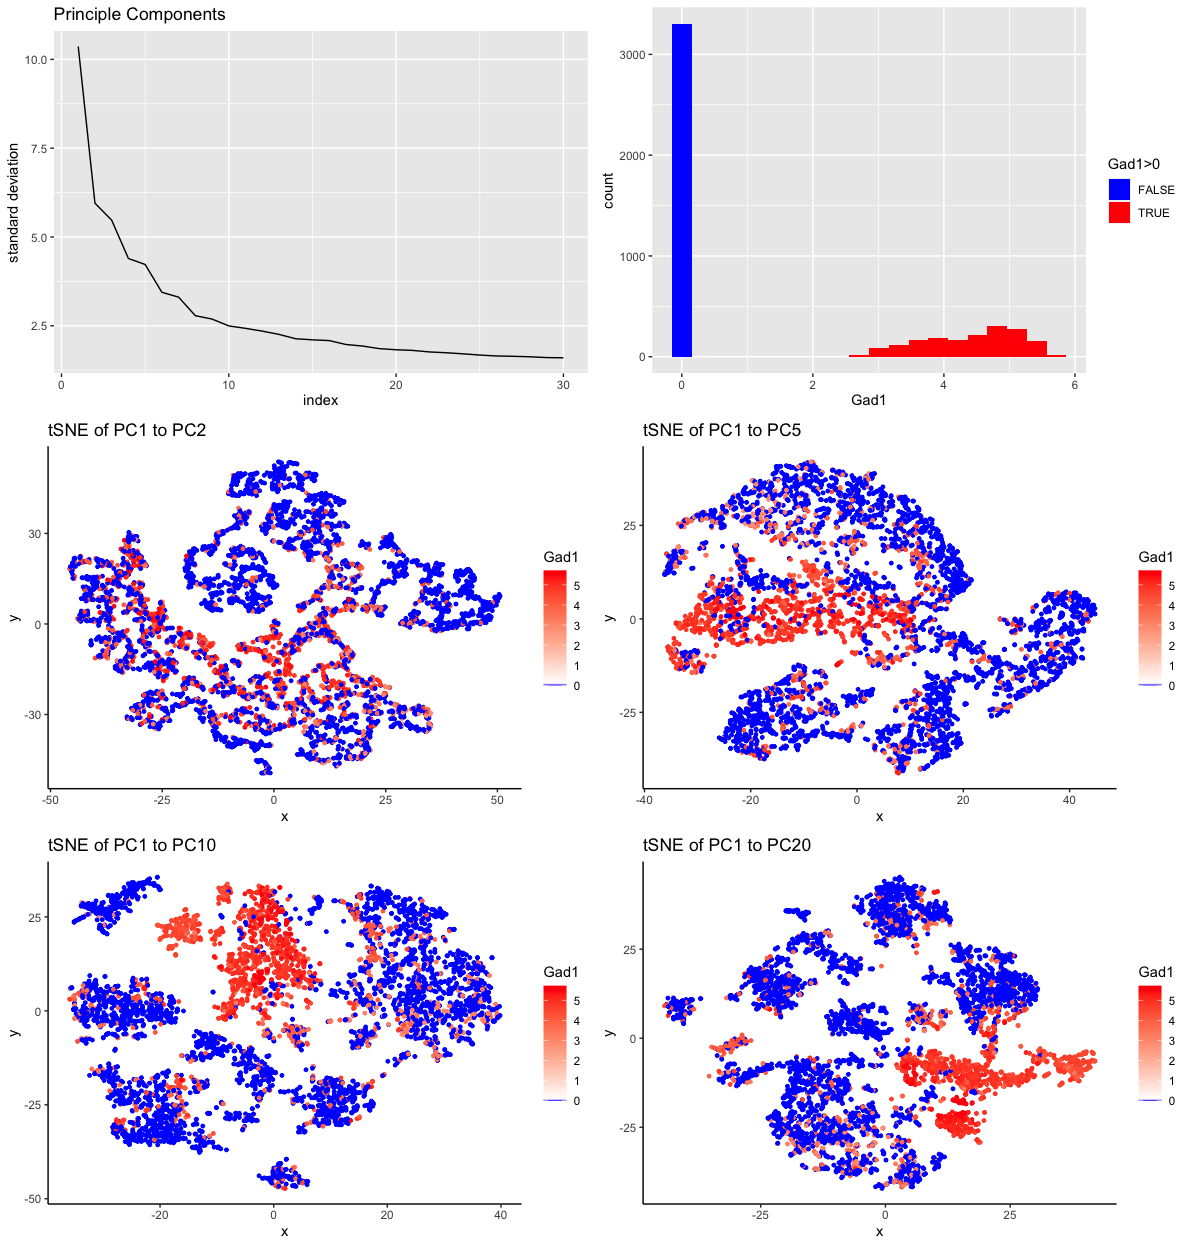
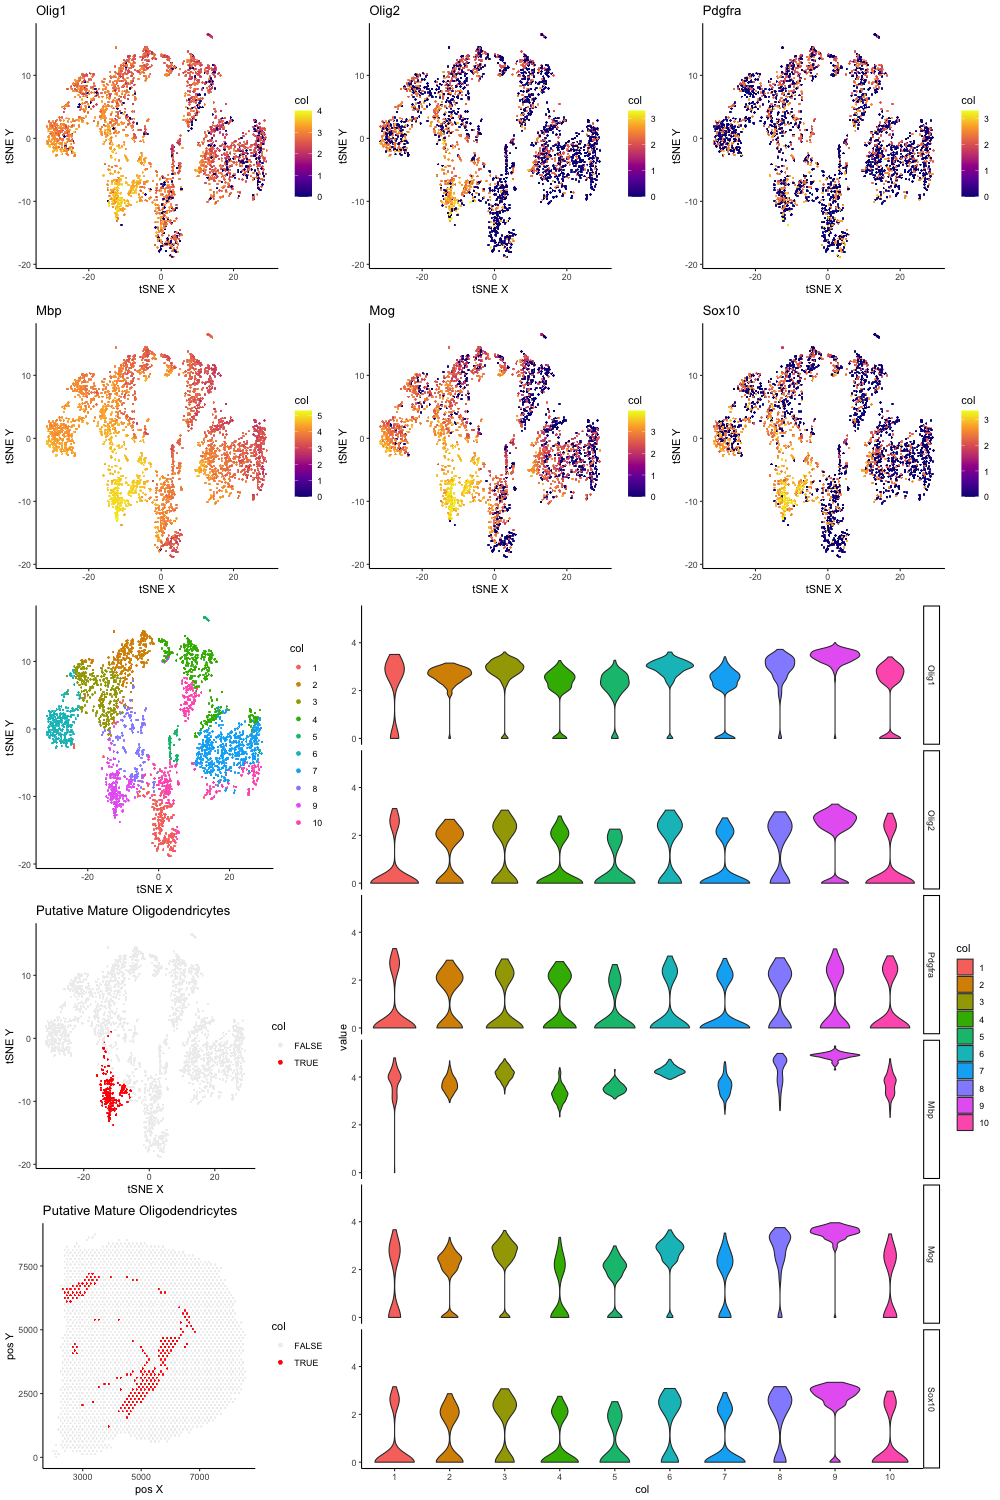
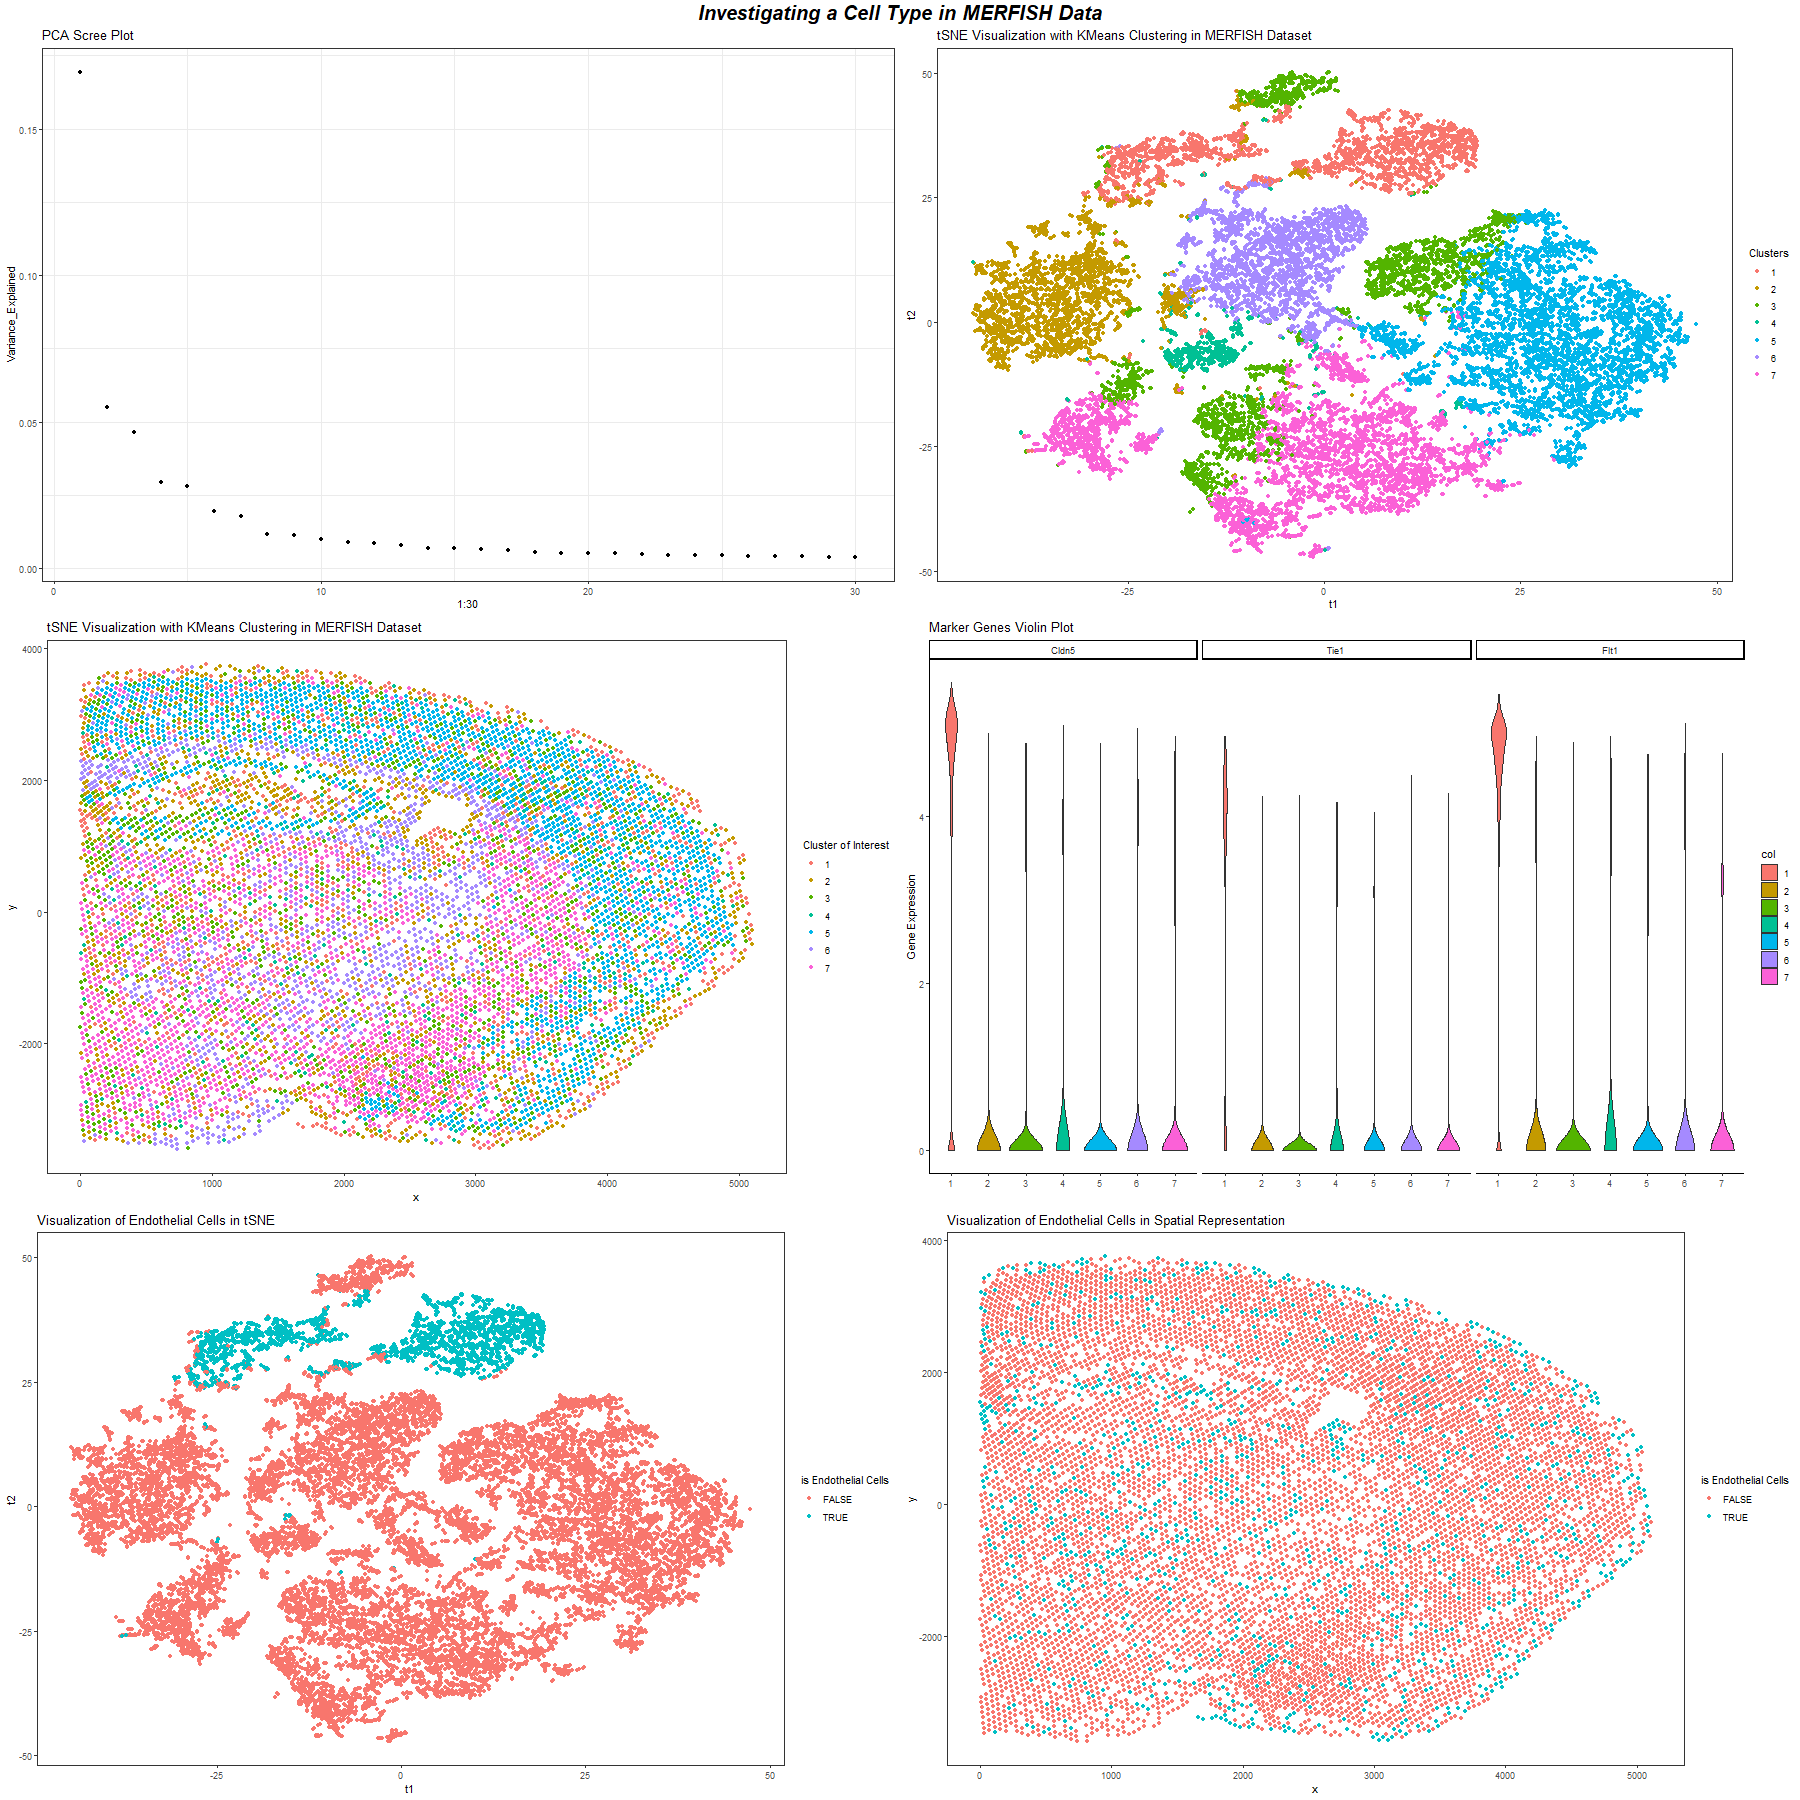
My multipanel visualization includes six individual plots. The origin of the data for all plots is the MERFISH dataset (42519 cells x 486 genes) which has been downsampled to 5000...
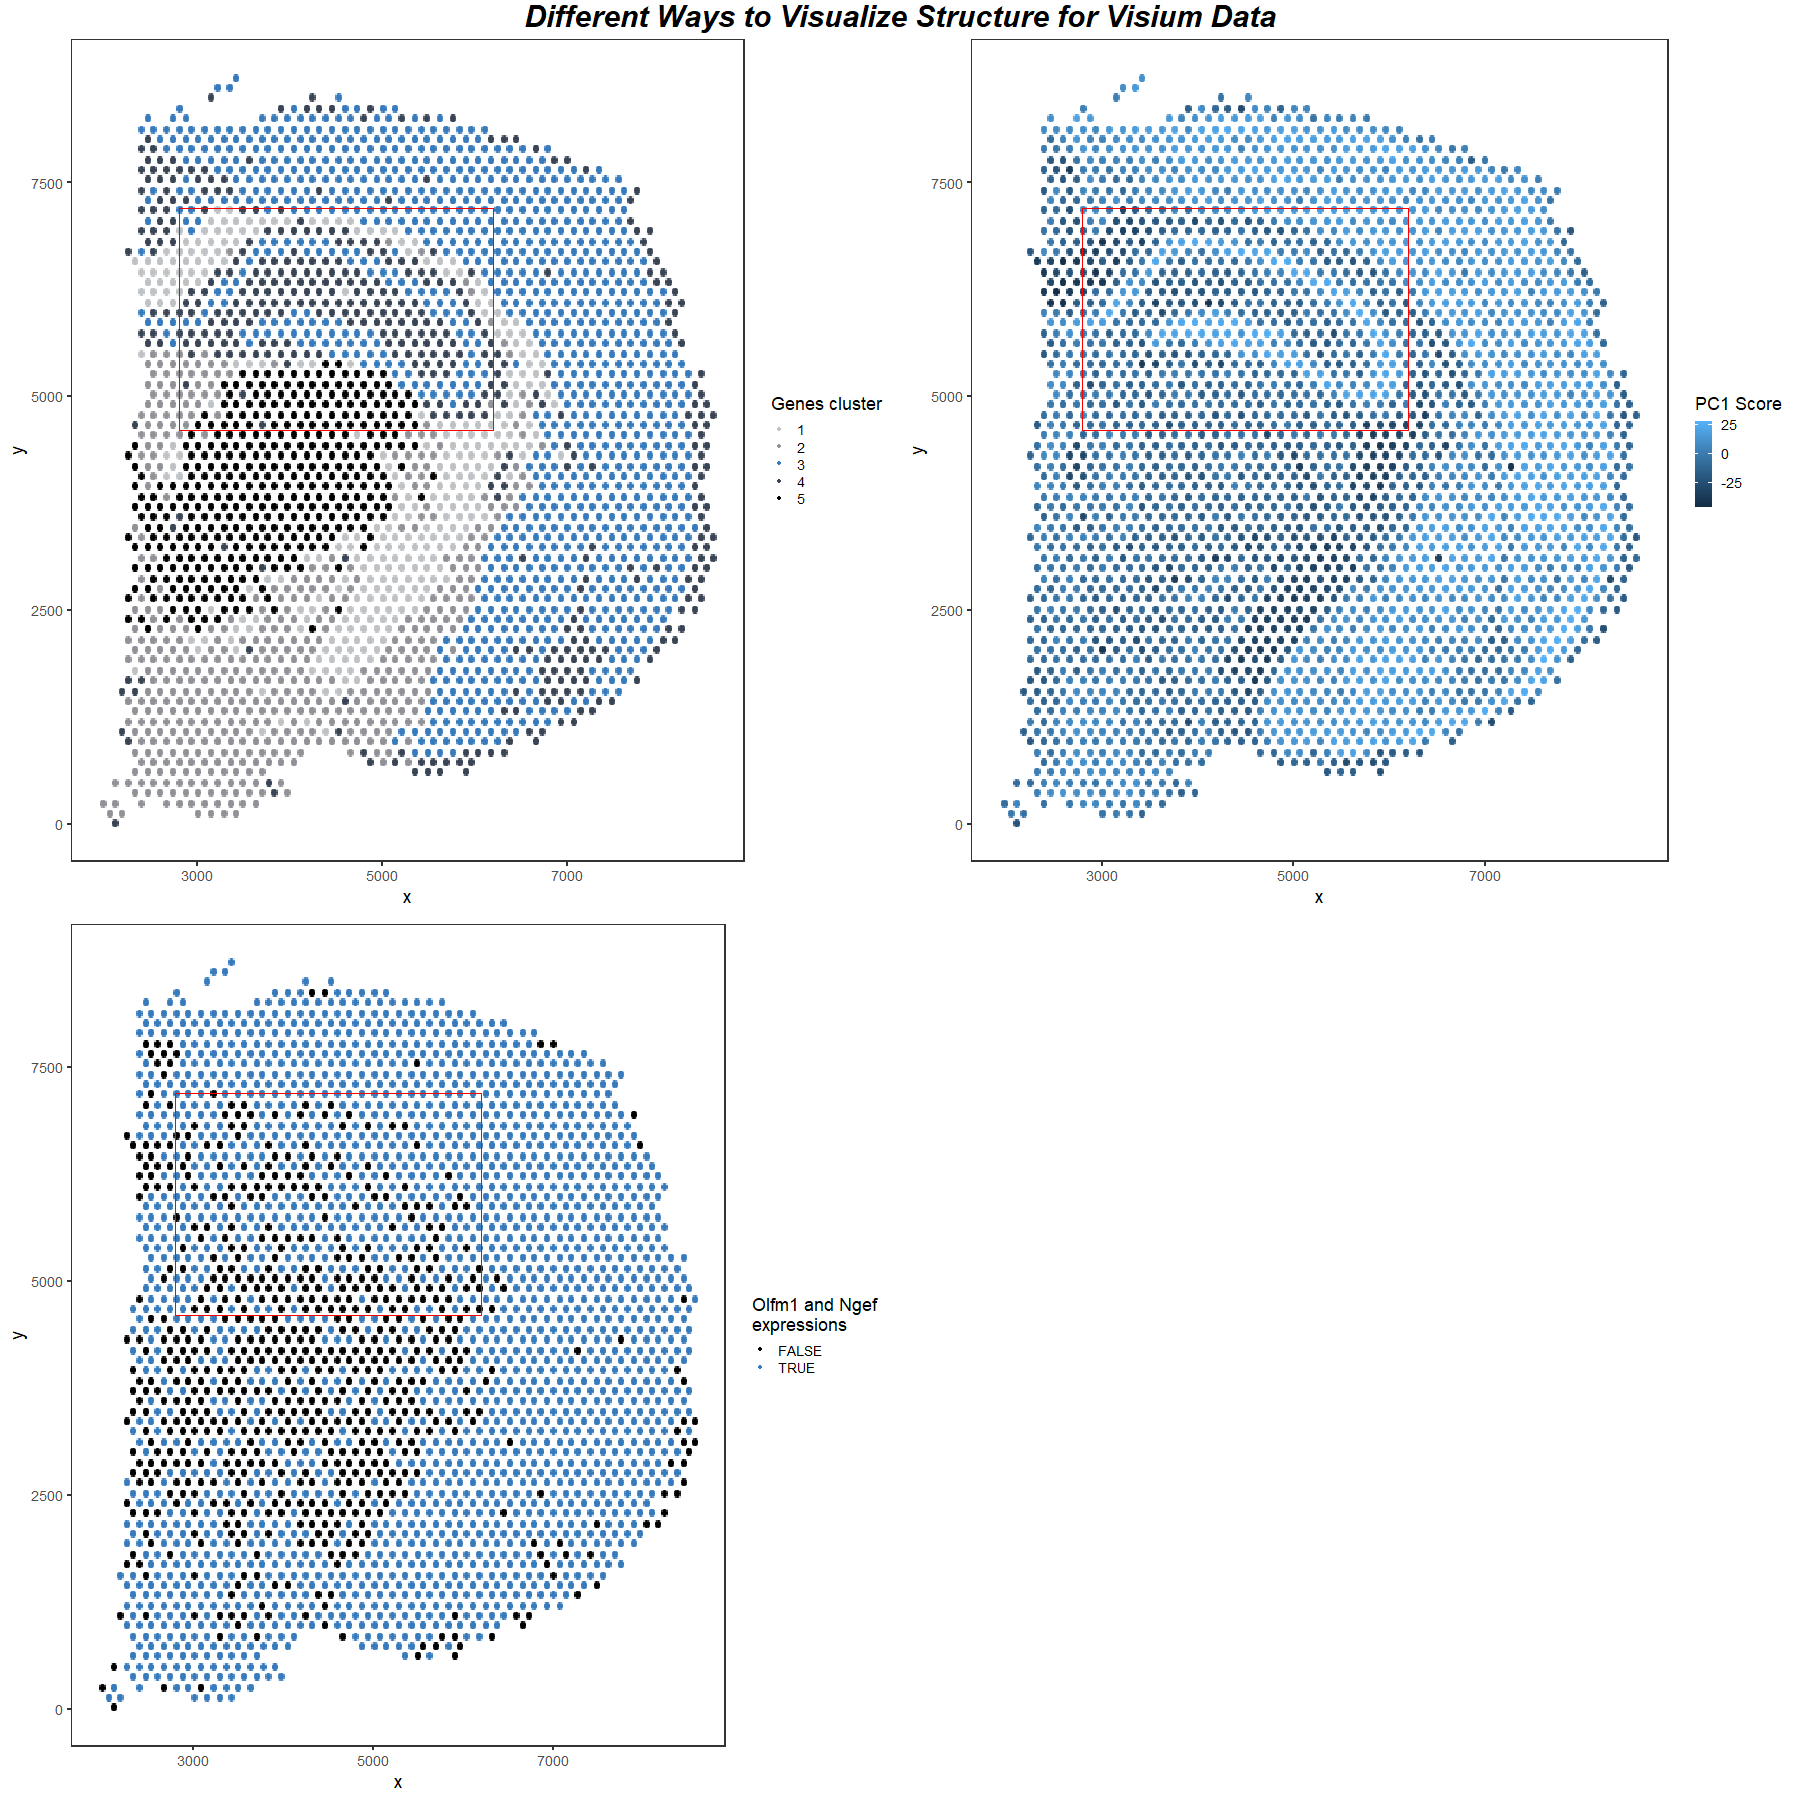
For all three images, I am visualizing the position of cells in the Visium Dataset, which is quantitative data. In image 1, I am also visualizing the Kmeans clustering grouping...
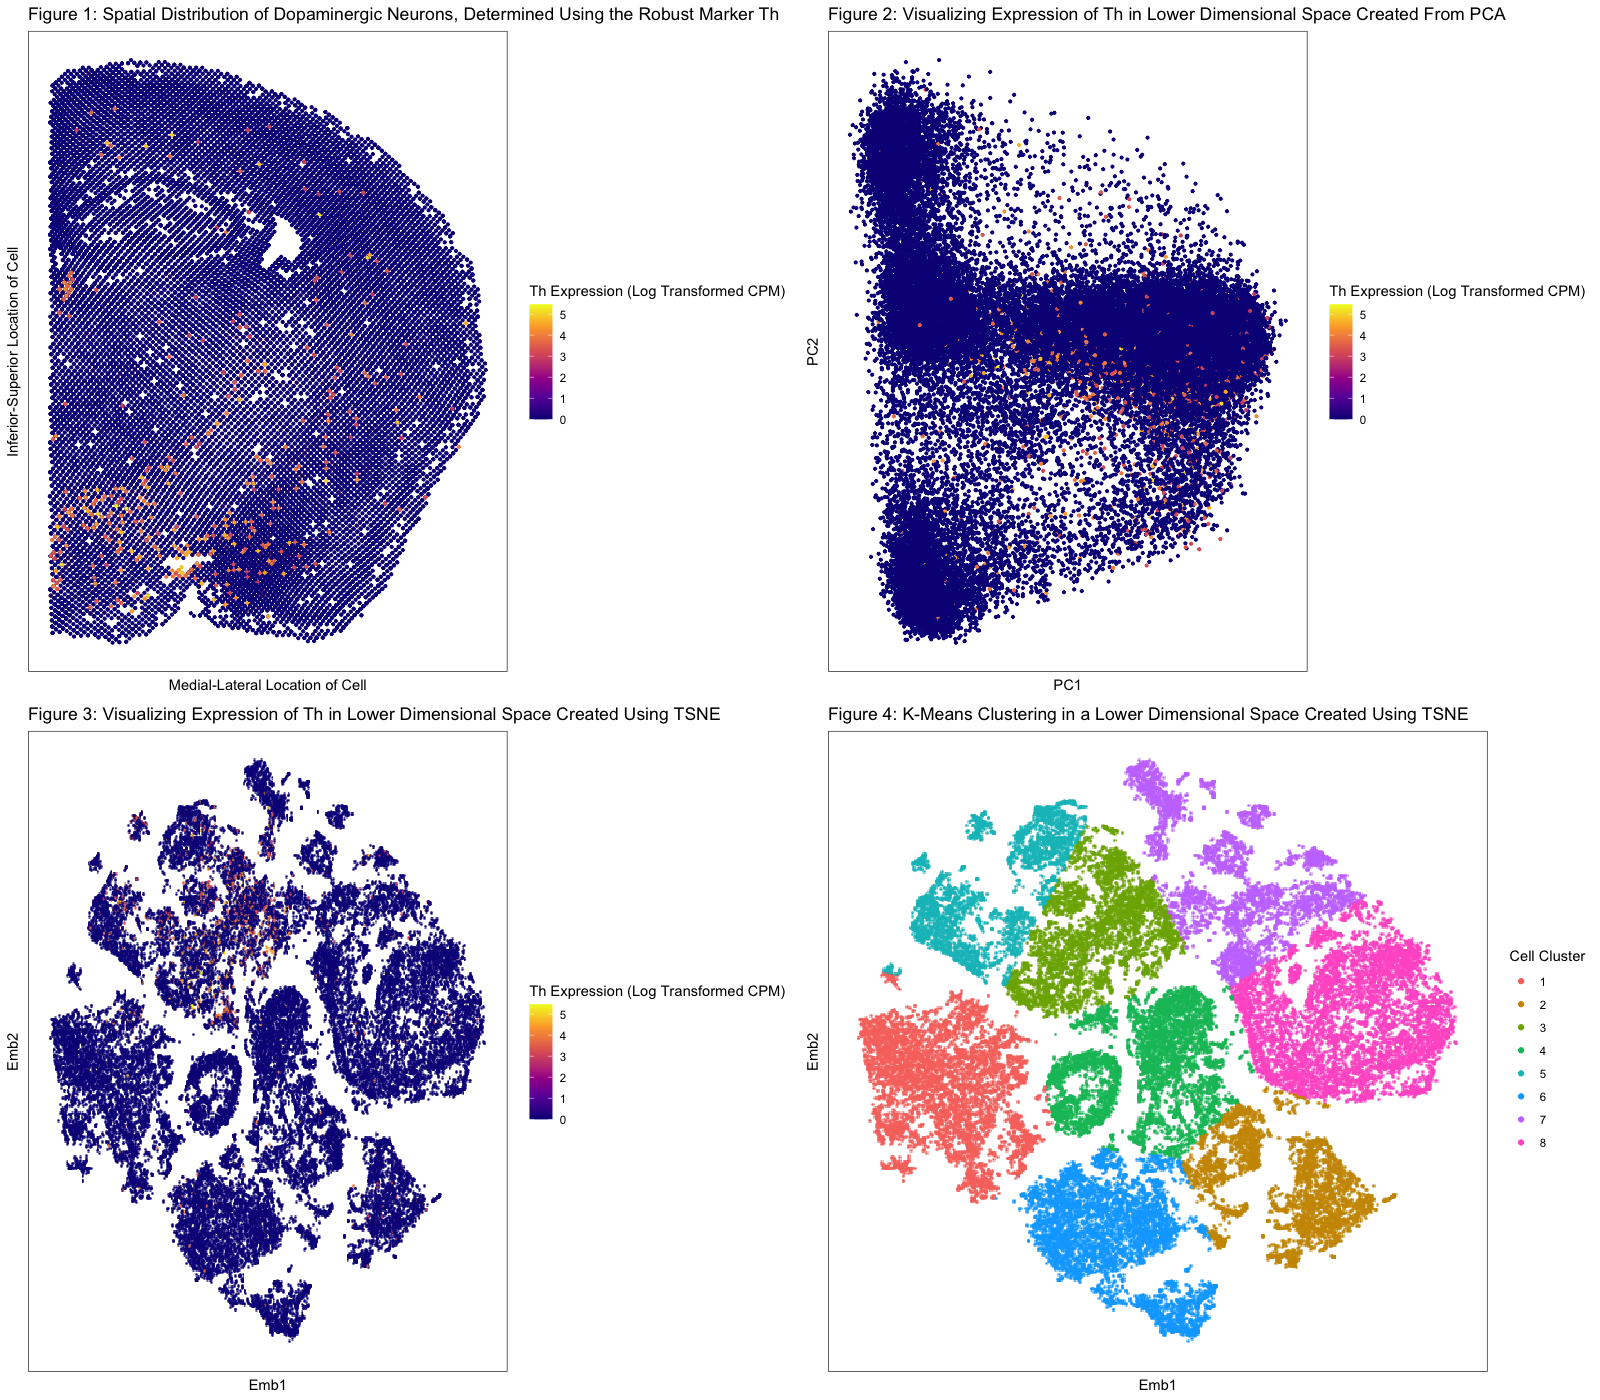
In Figure 1, I chose to visualize quantitative data regarding the levels of expression of Th (a marker whose expression I am using as a proxy for the identification of...
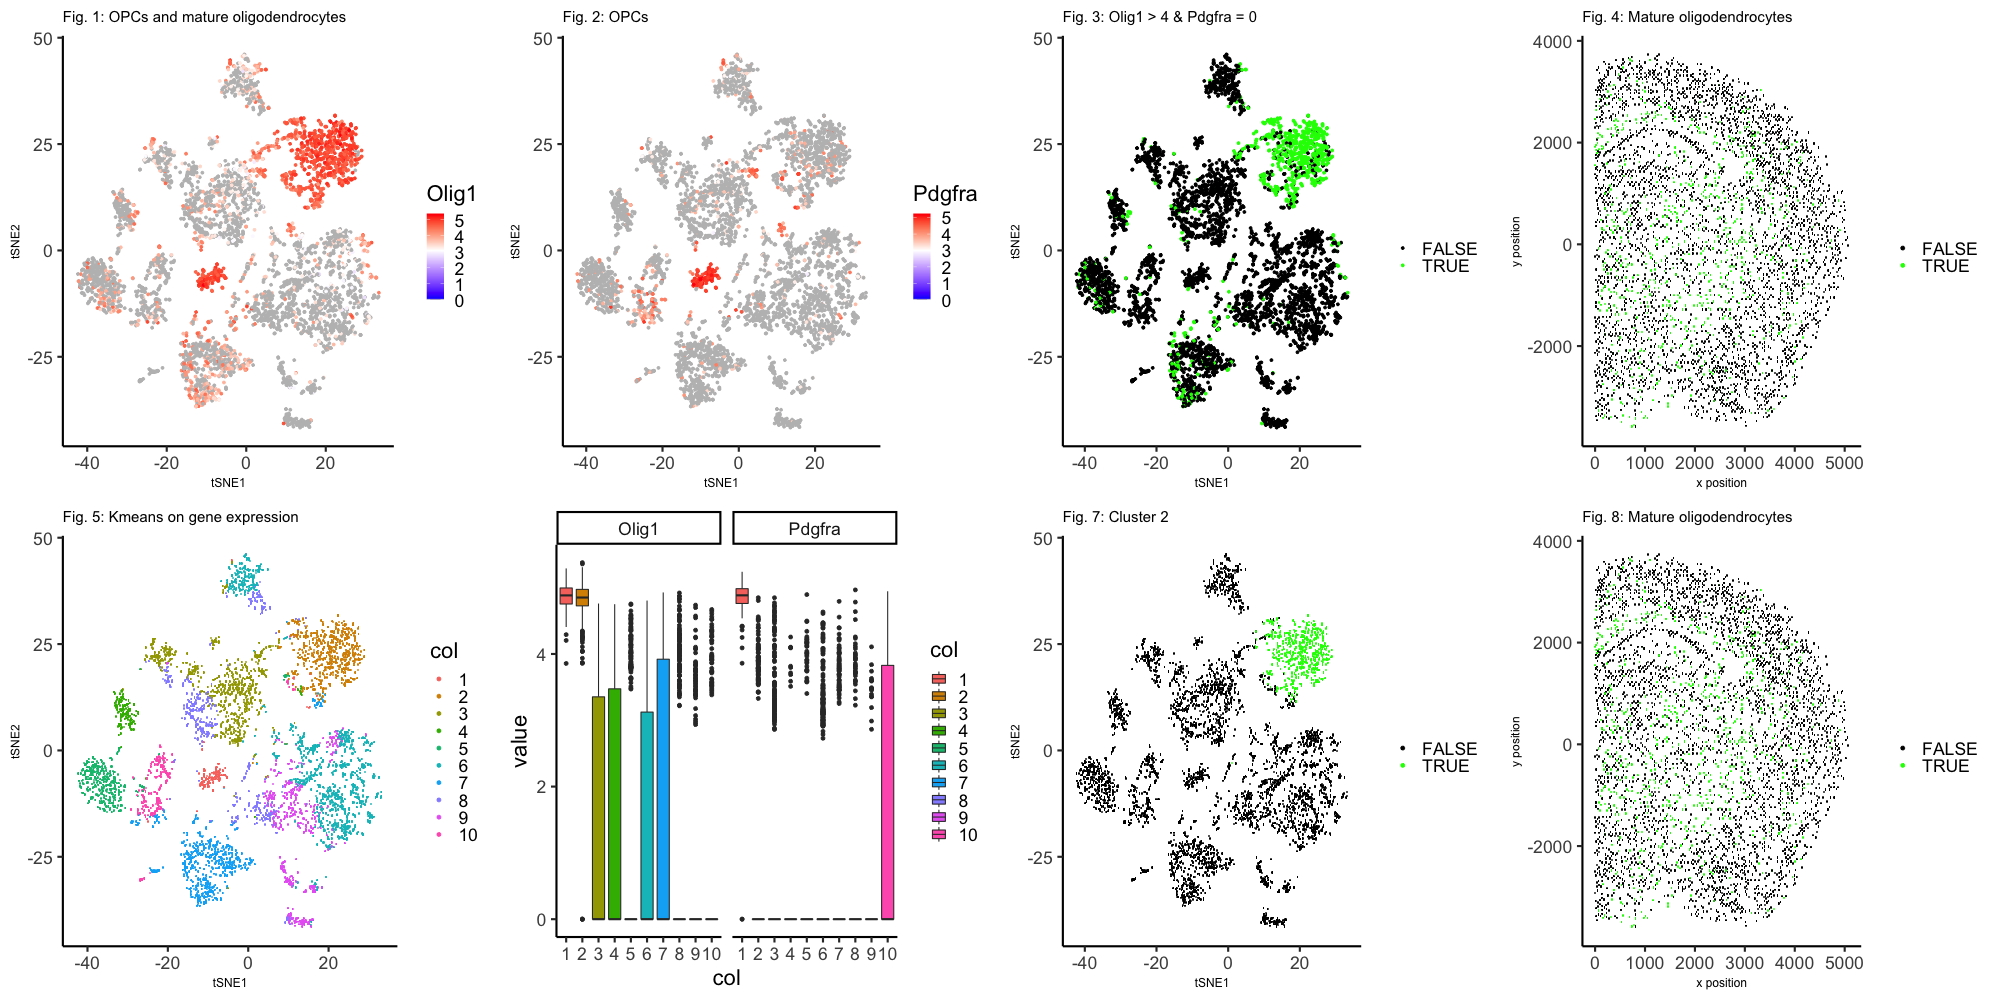
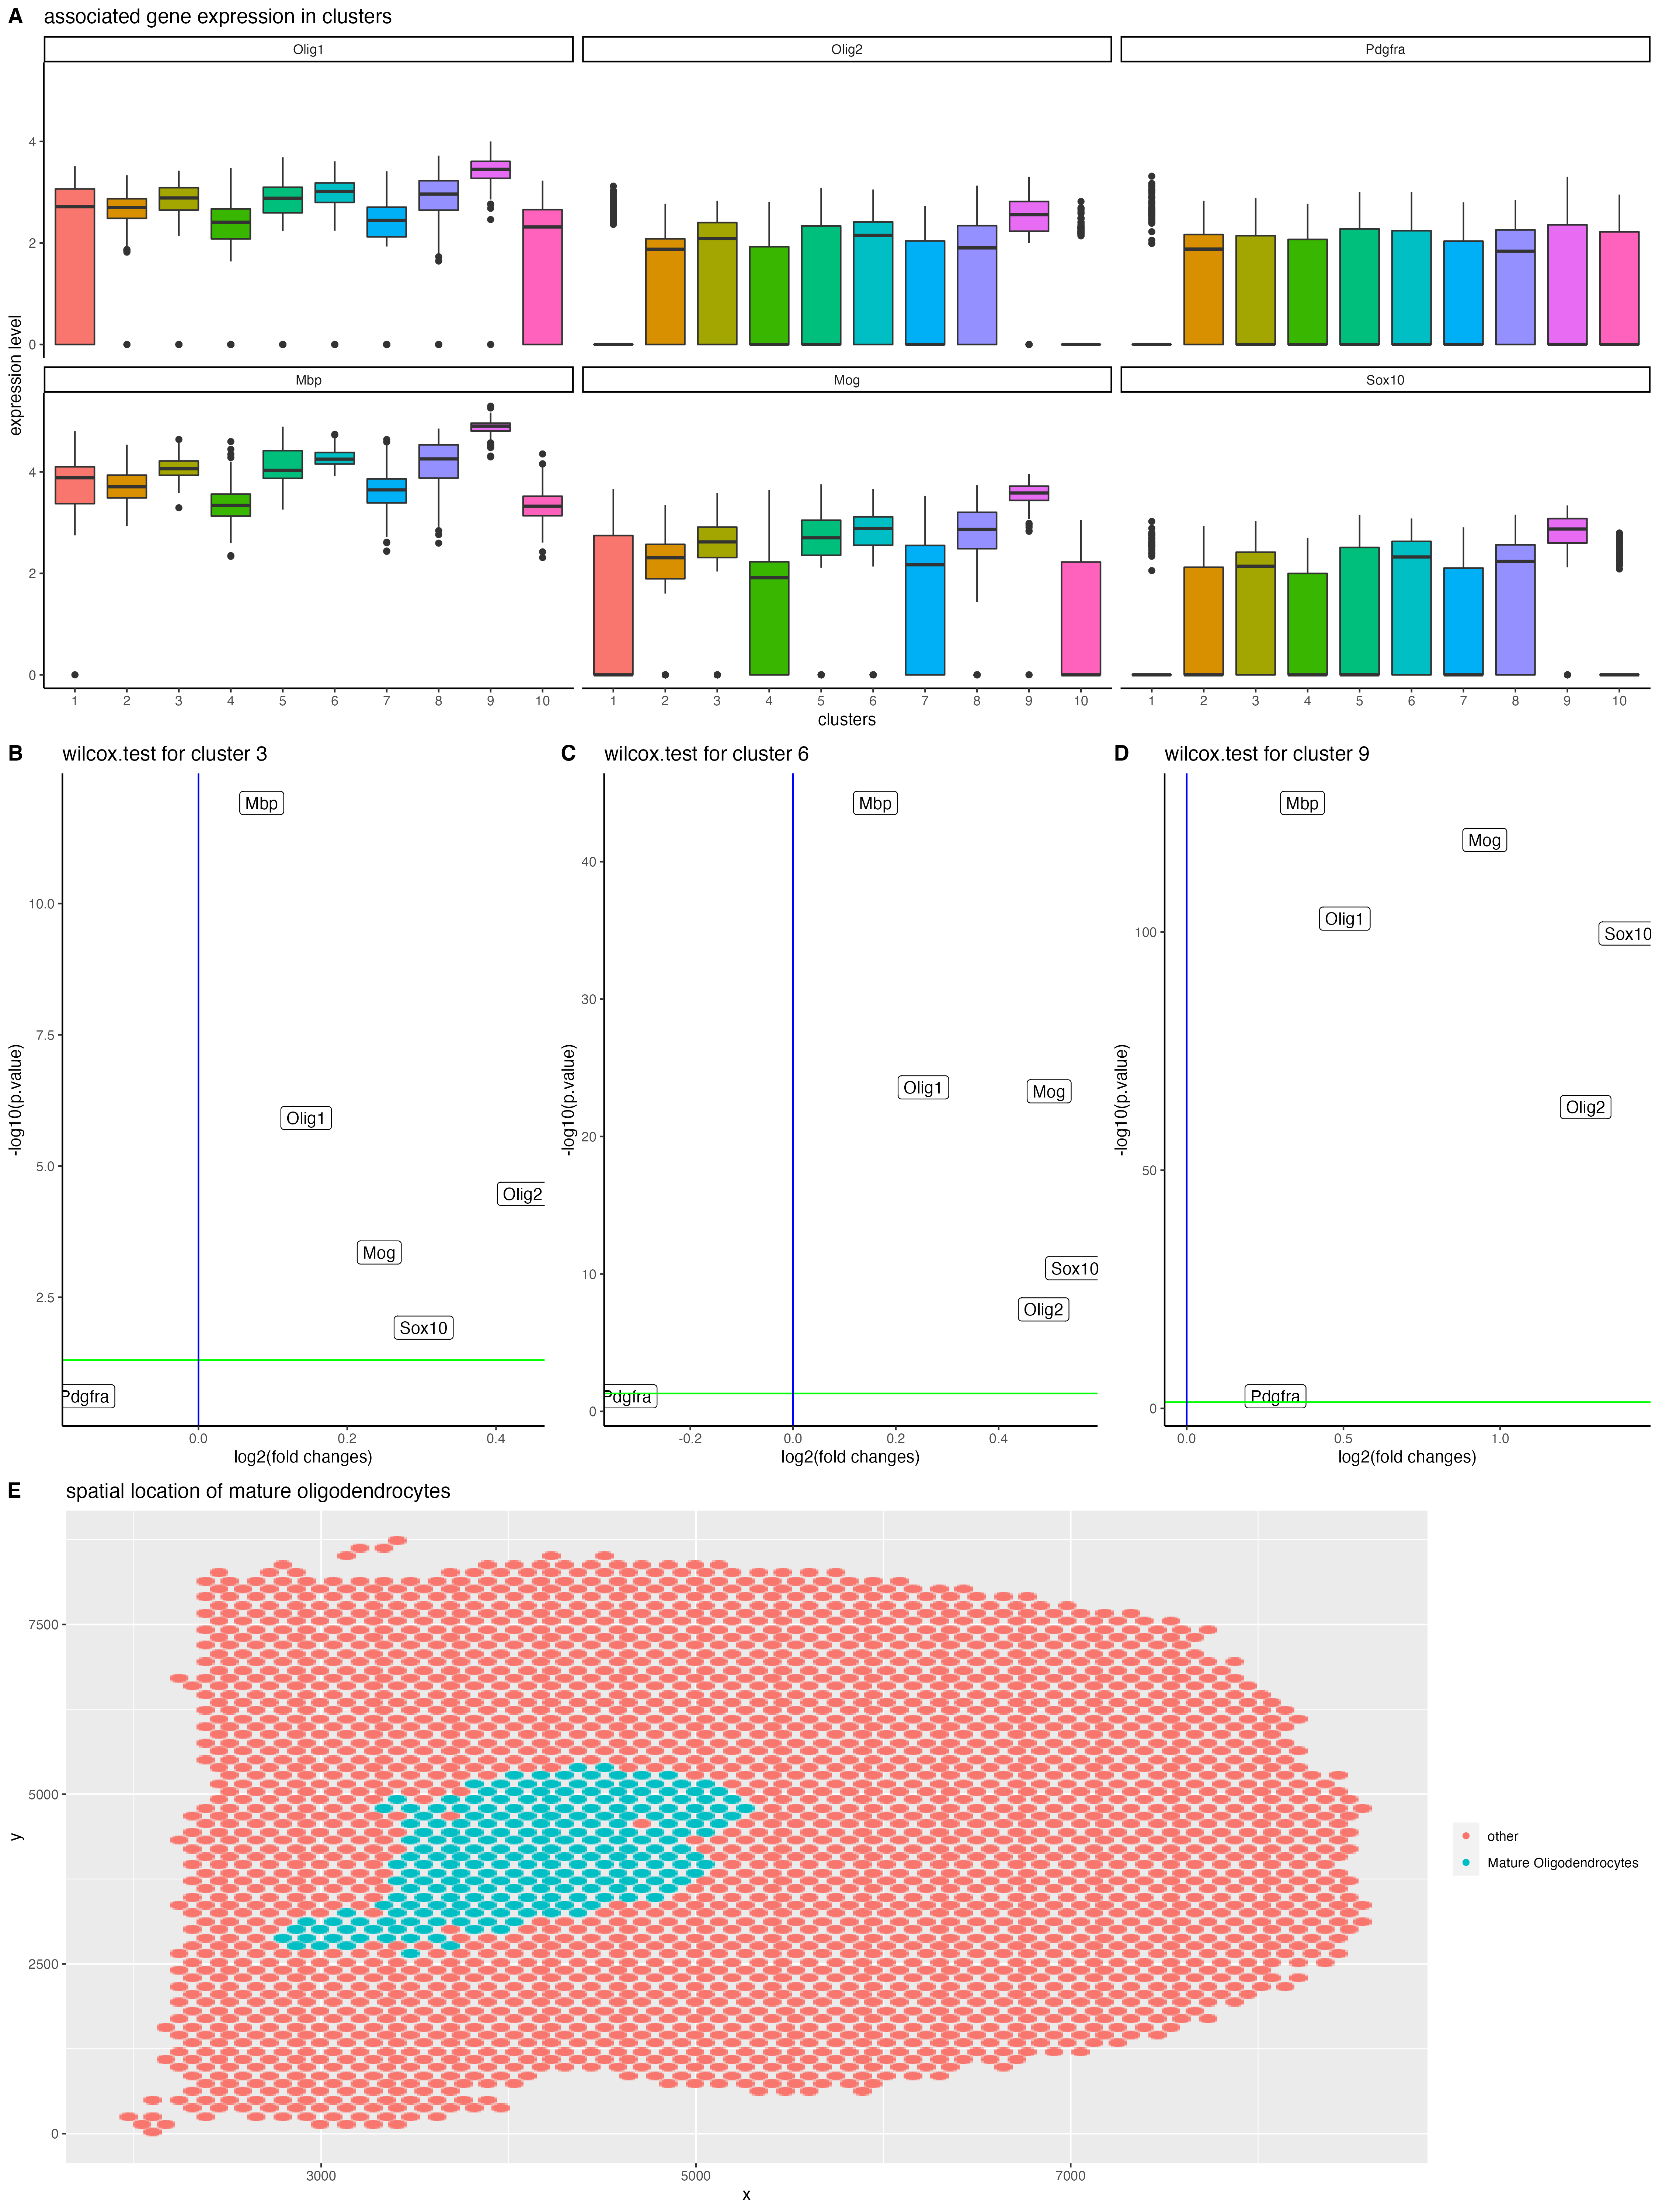
This code tries to find optimal k that clusters the gene so that one cluster has differential expression of marker gene. We need Oligo1, and Oligo2 to be highly expressed,...
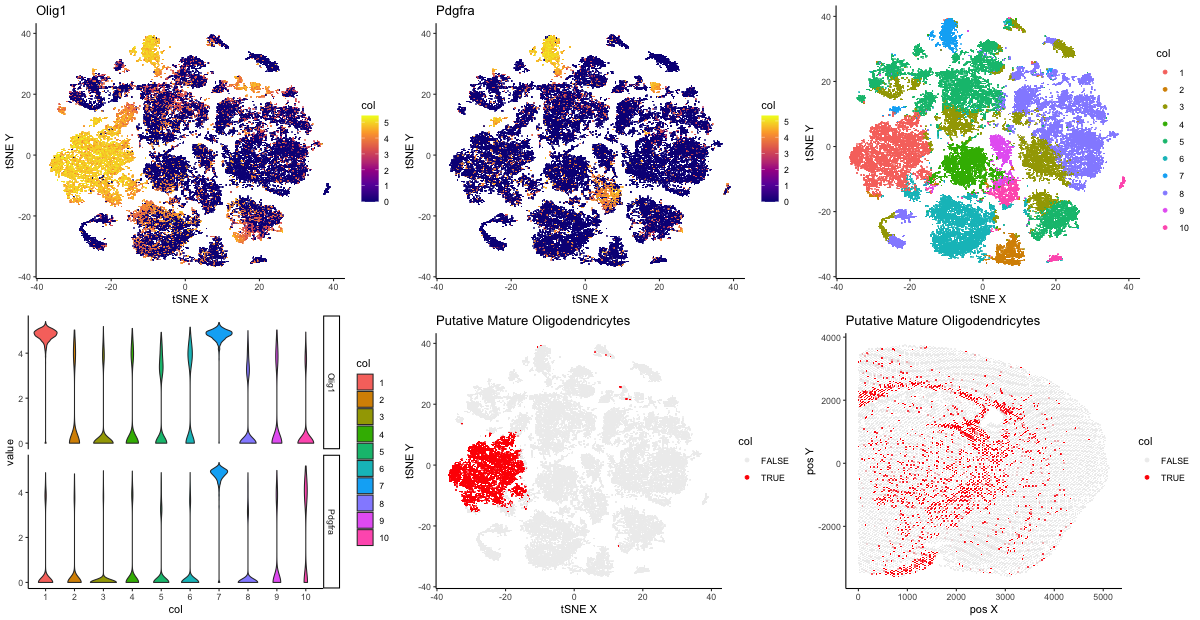
Gene expression of 5000 cells was measured by MERFISH. Initially, populations were grouped by the first thirty principle components and visualized in two dimensions by tSNE. Two populations of cells...
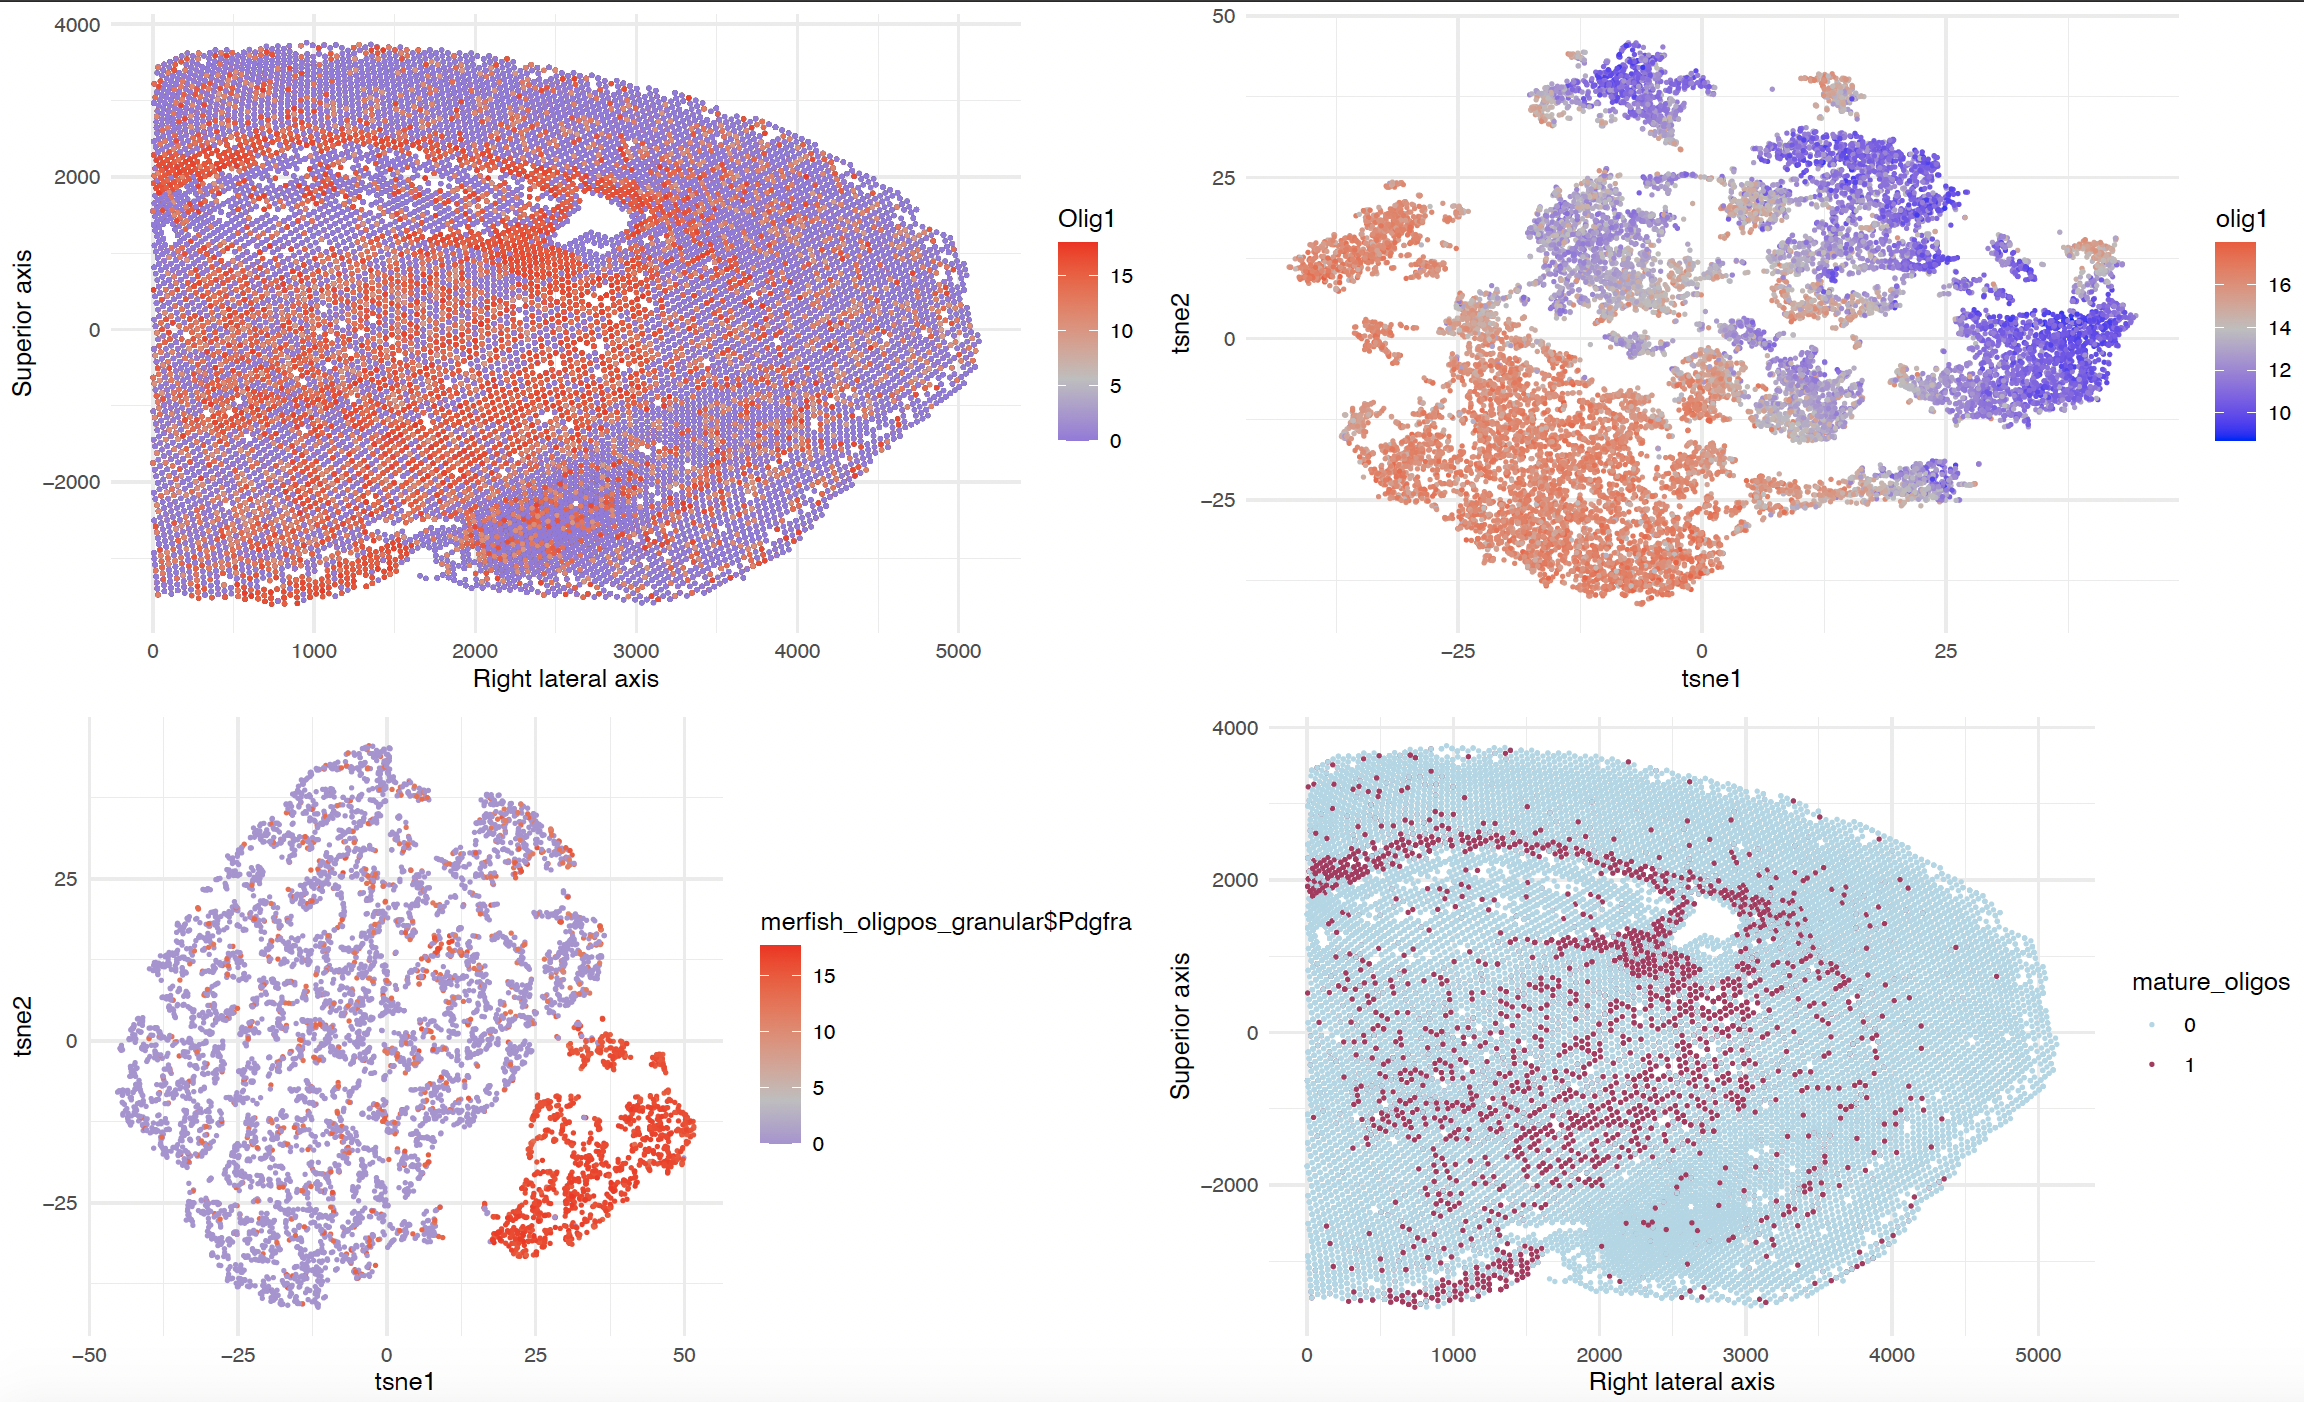
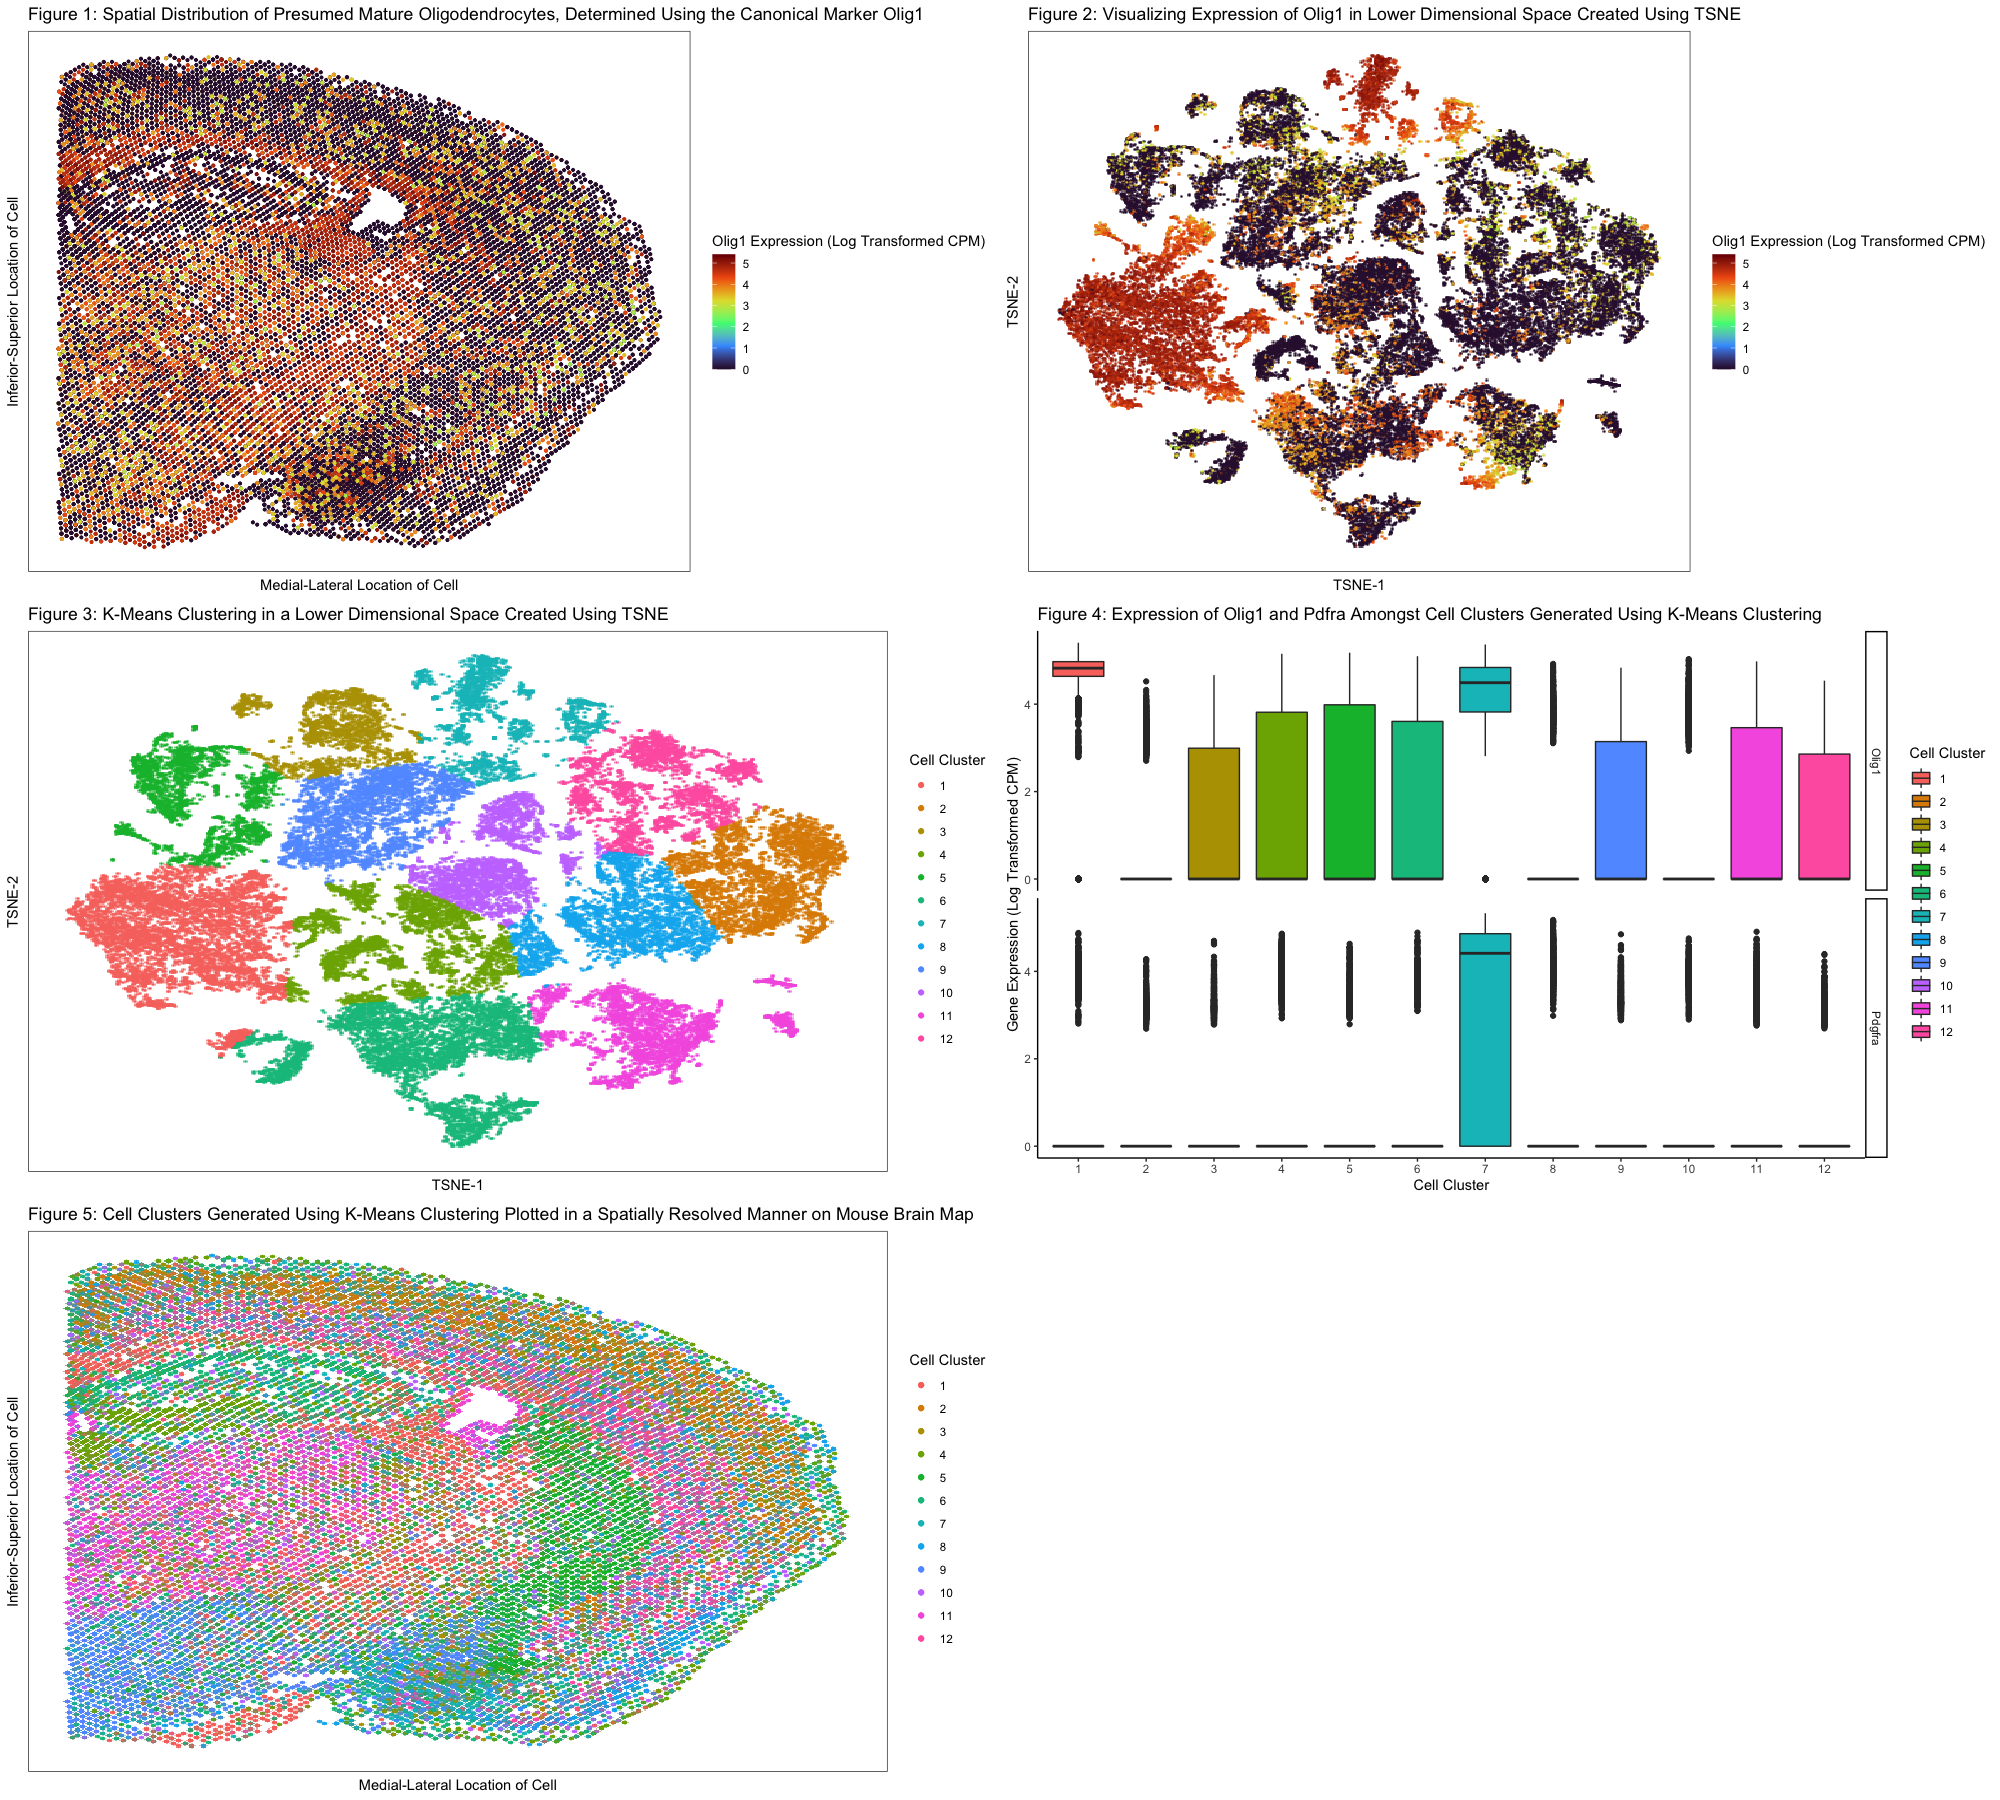
In Figure 1, I chose to visualize quantitative data regarding the levels of expression of Olig1 (a canonical marker endogenous to mature oligodendrocytes as well as oligodendrocyte precursor cells) across...
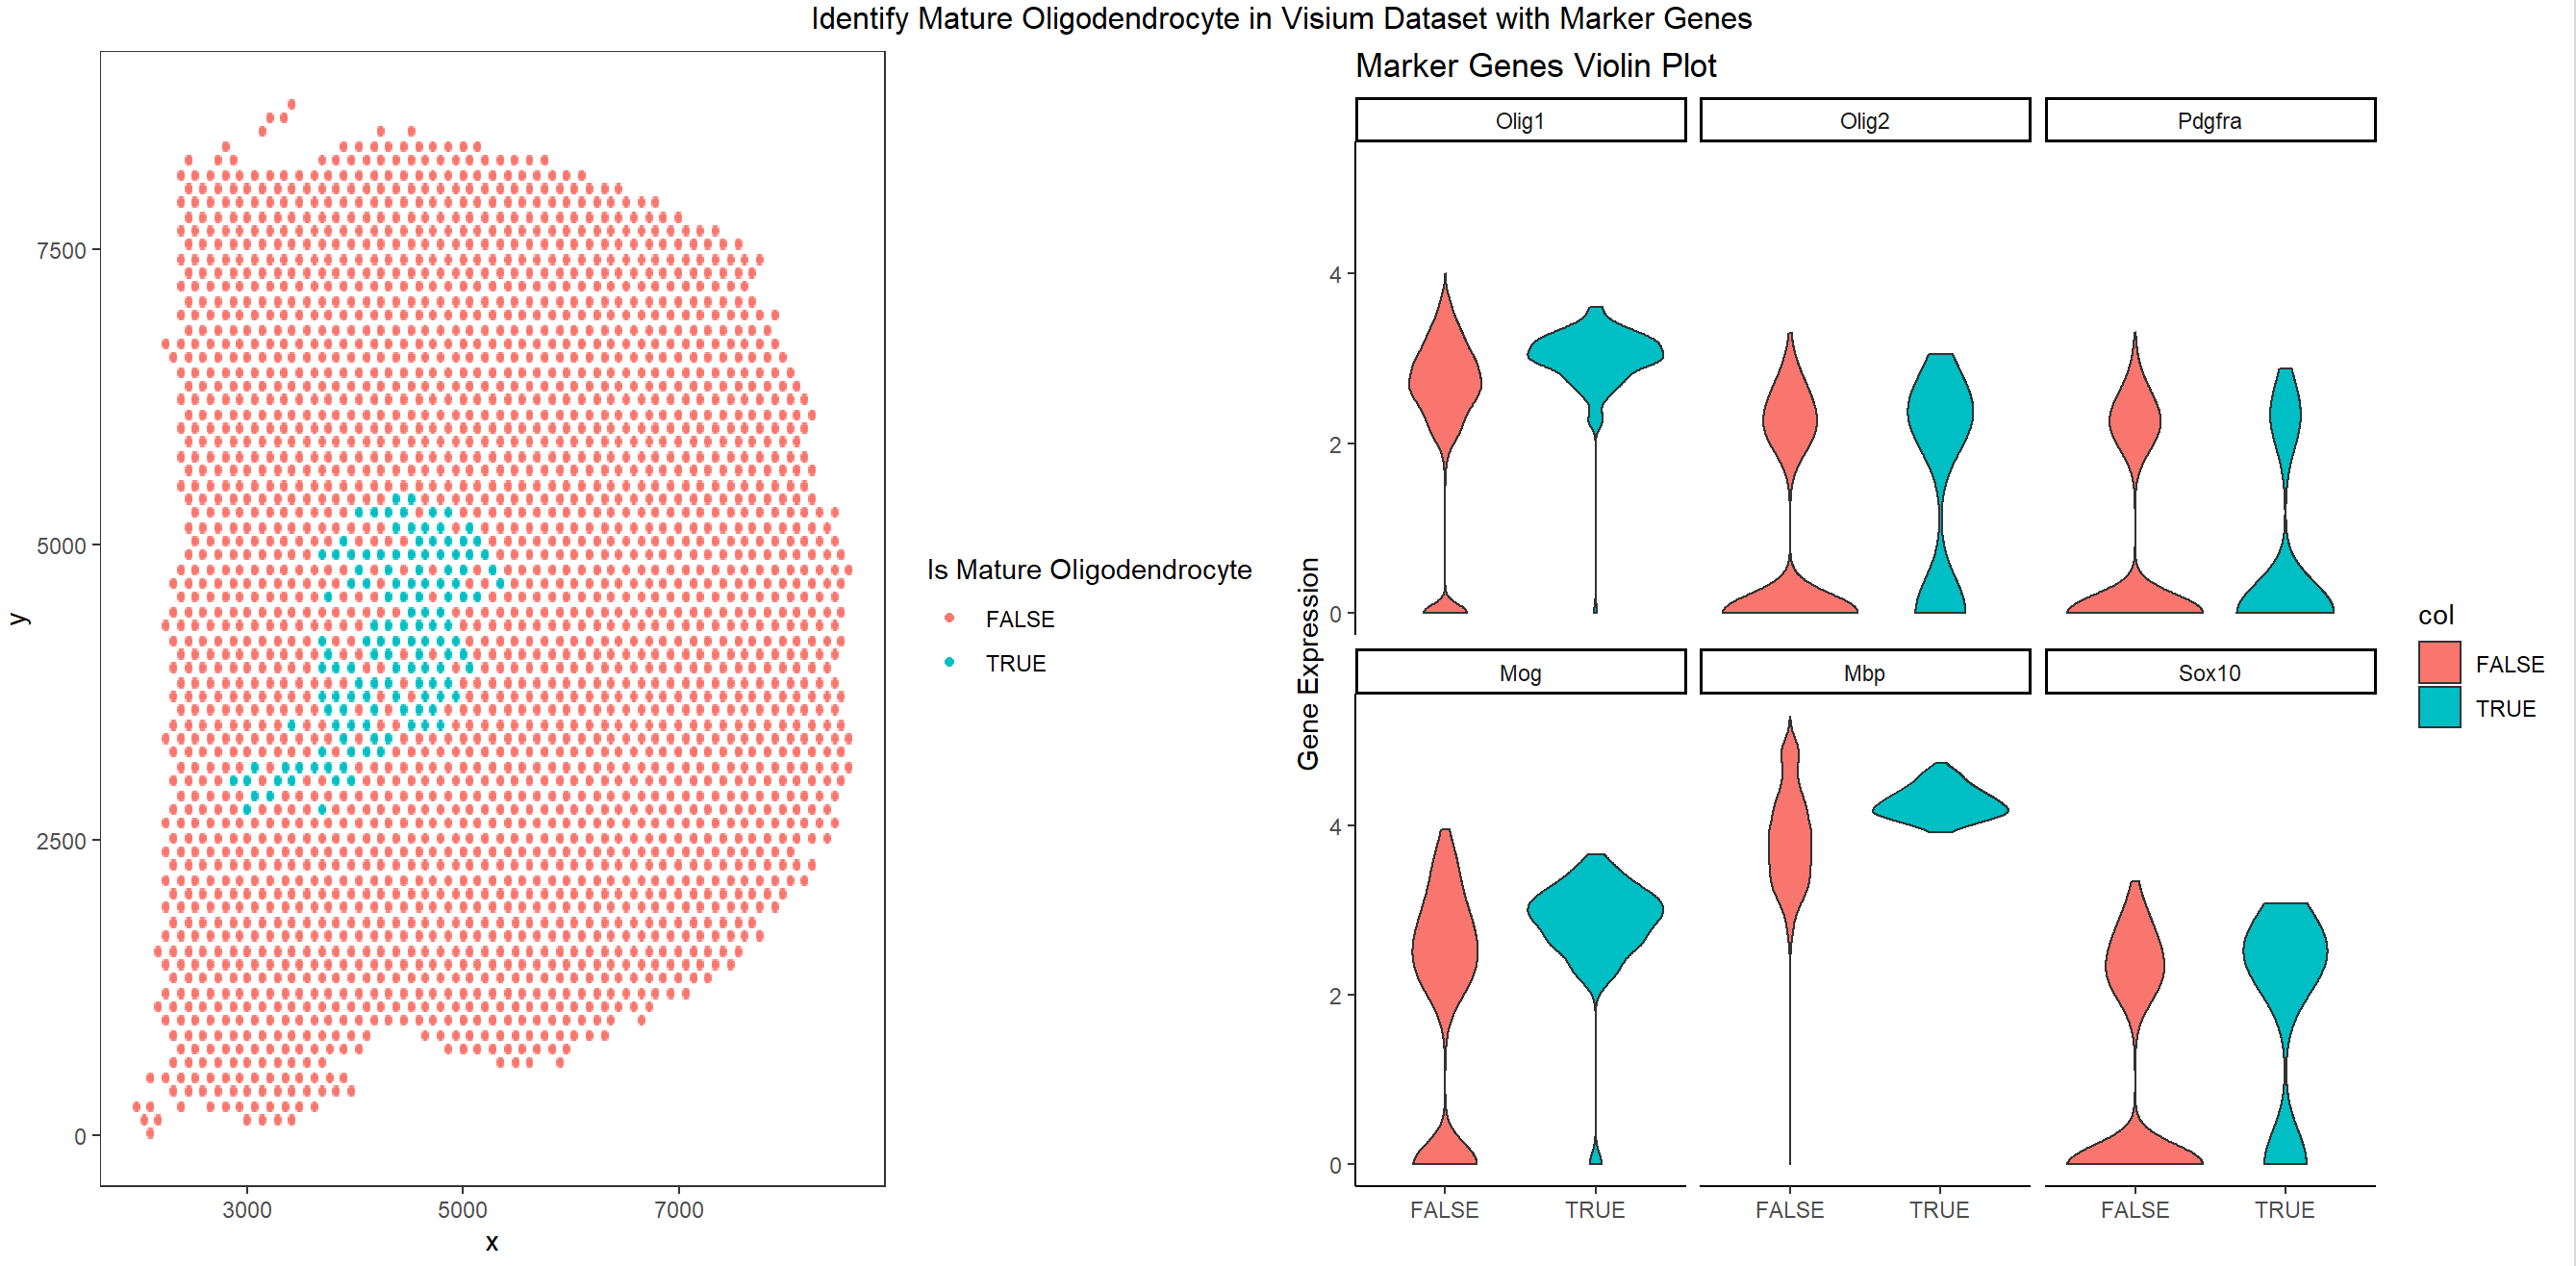
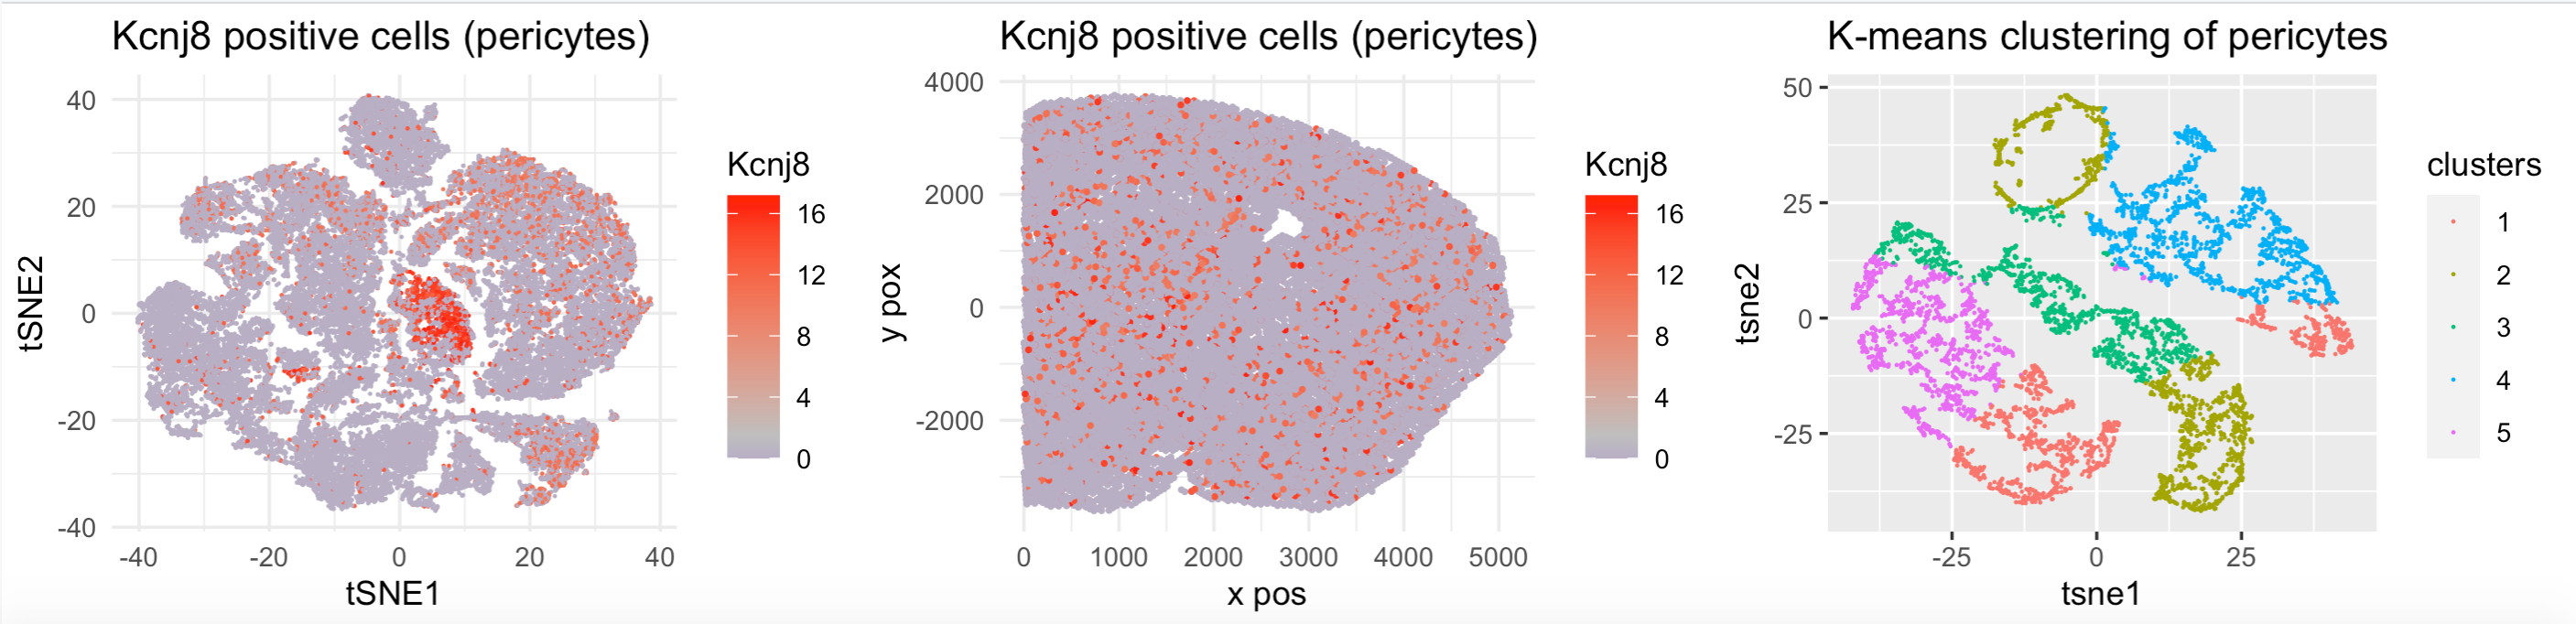
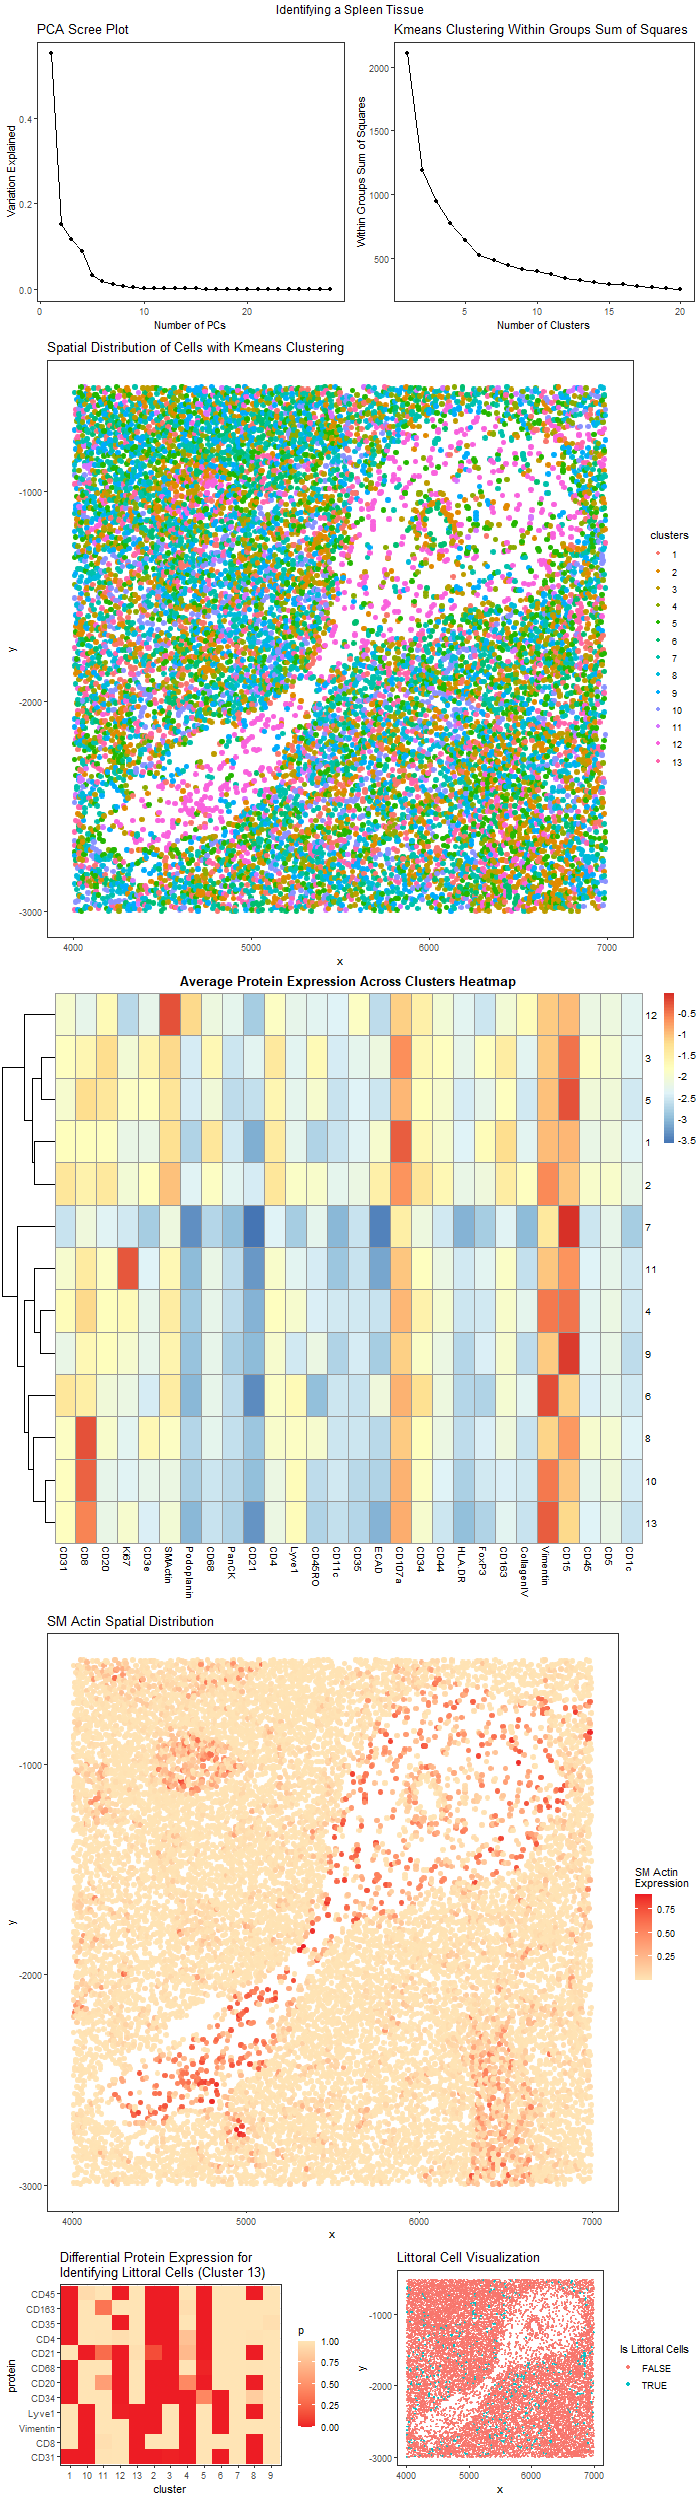
We are given a spatial gene expression dataset with MERFISH technology. We will cluster the cells and try to identify a group of cells to understand their cell type based...
Expression of 483 genes has been measured in 42519 cells in a segment of brain tissue via MERFISH. Each cell position in the tissue sample has also been recorded. Fluorescence...
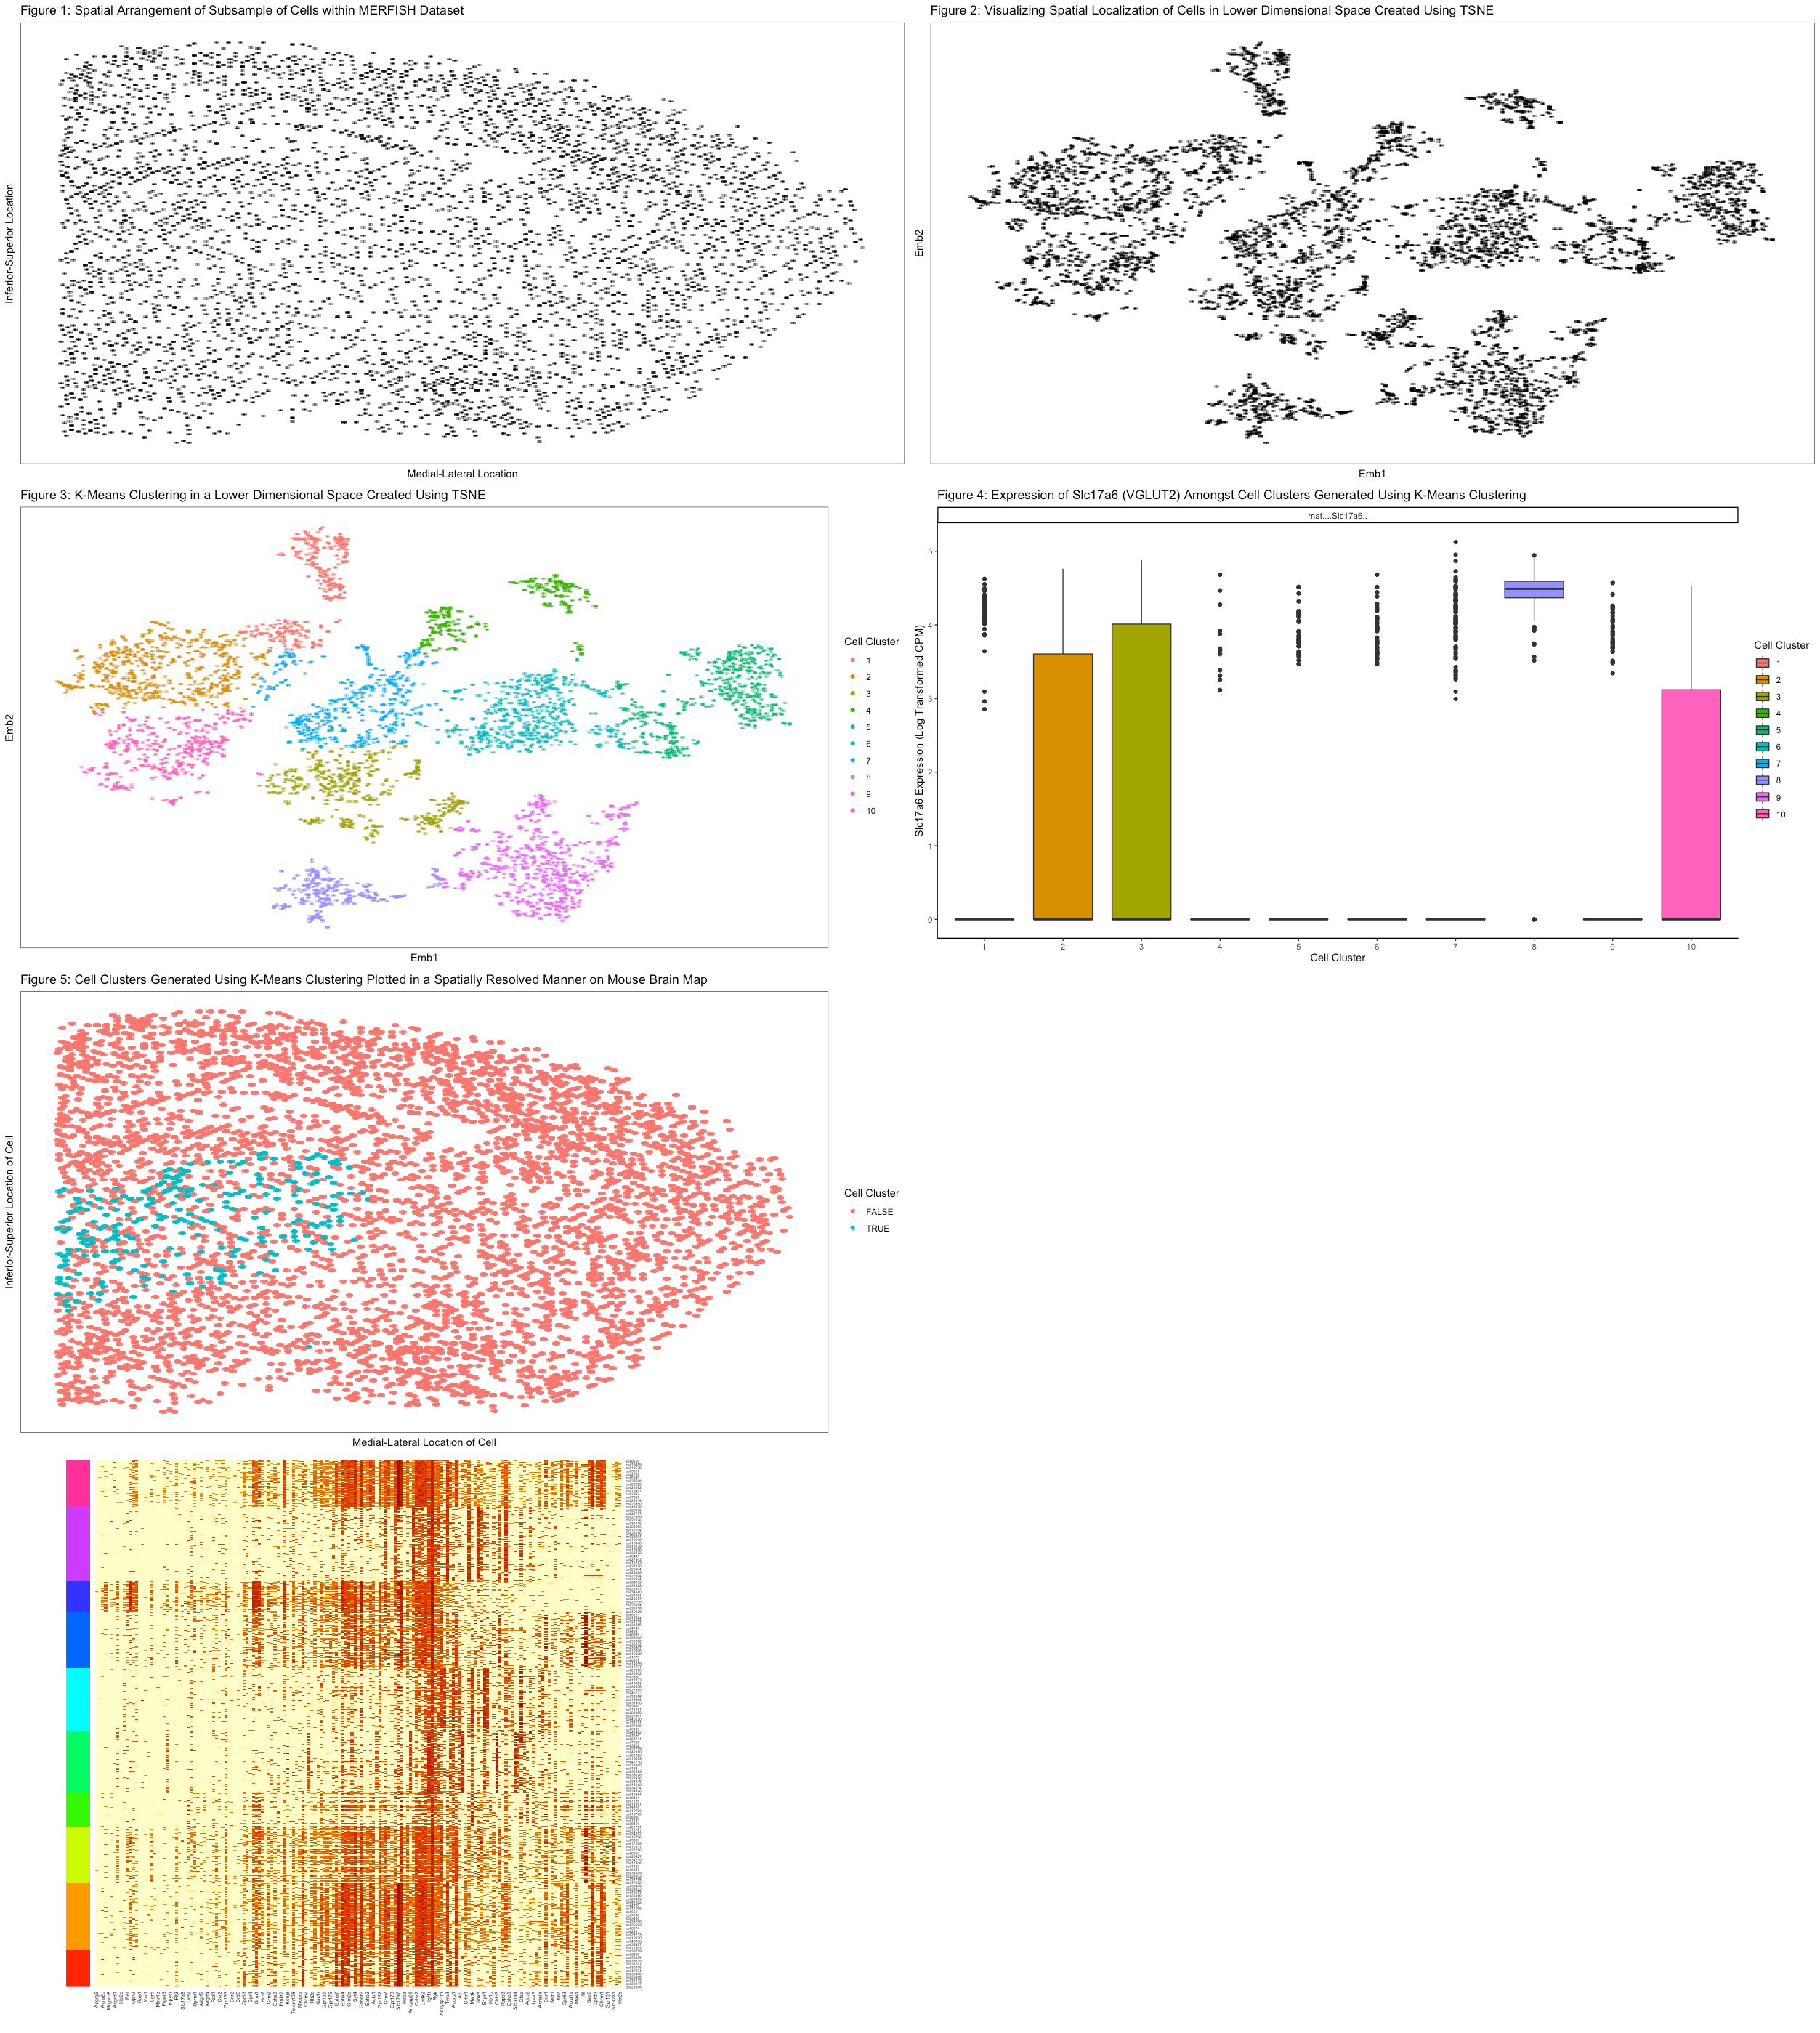
In Figure 1, I have plotted the spatial distribution of cells within our MERFISH data set, after down-sampling the data. I used the geometric primitive of points to represent single...
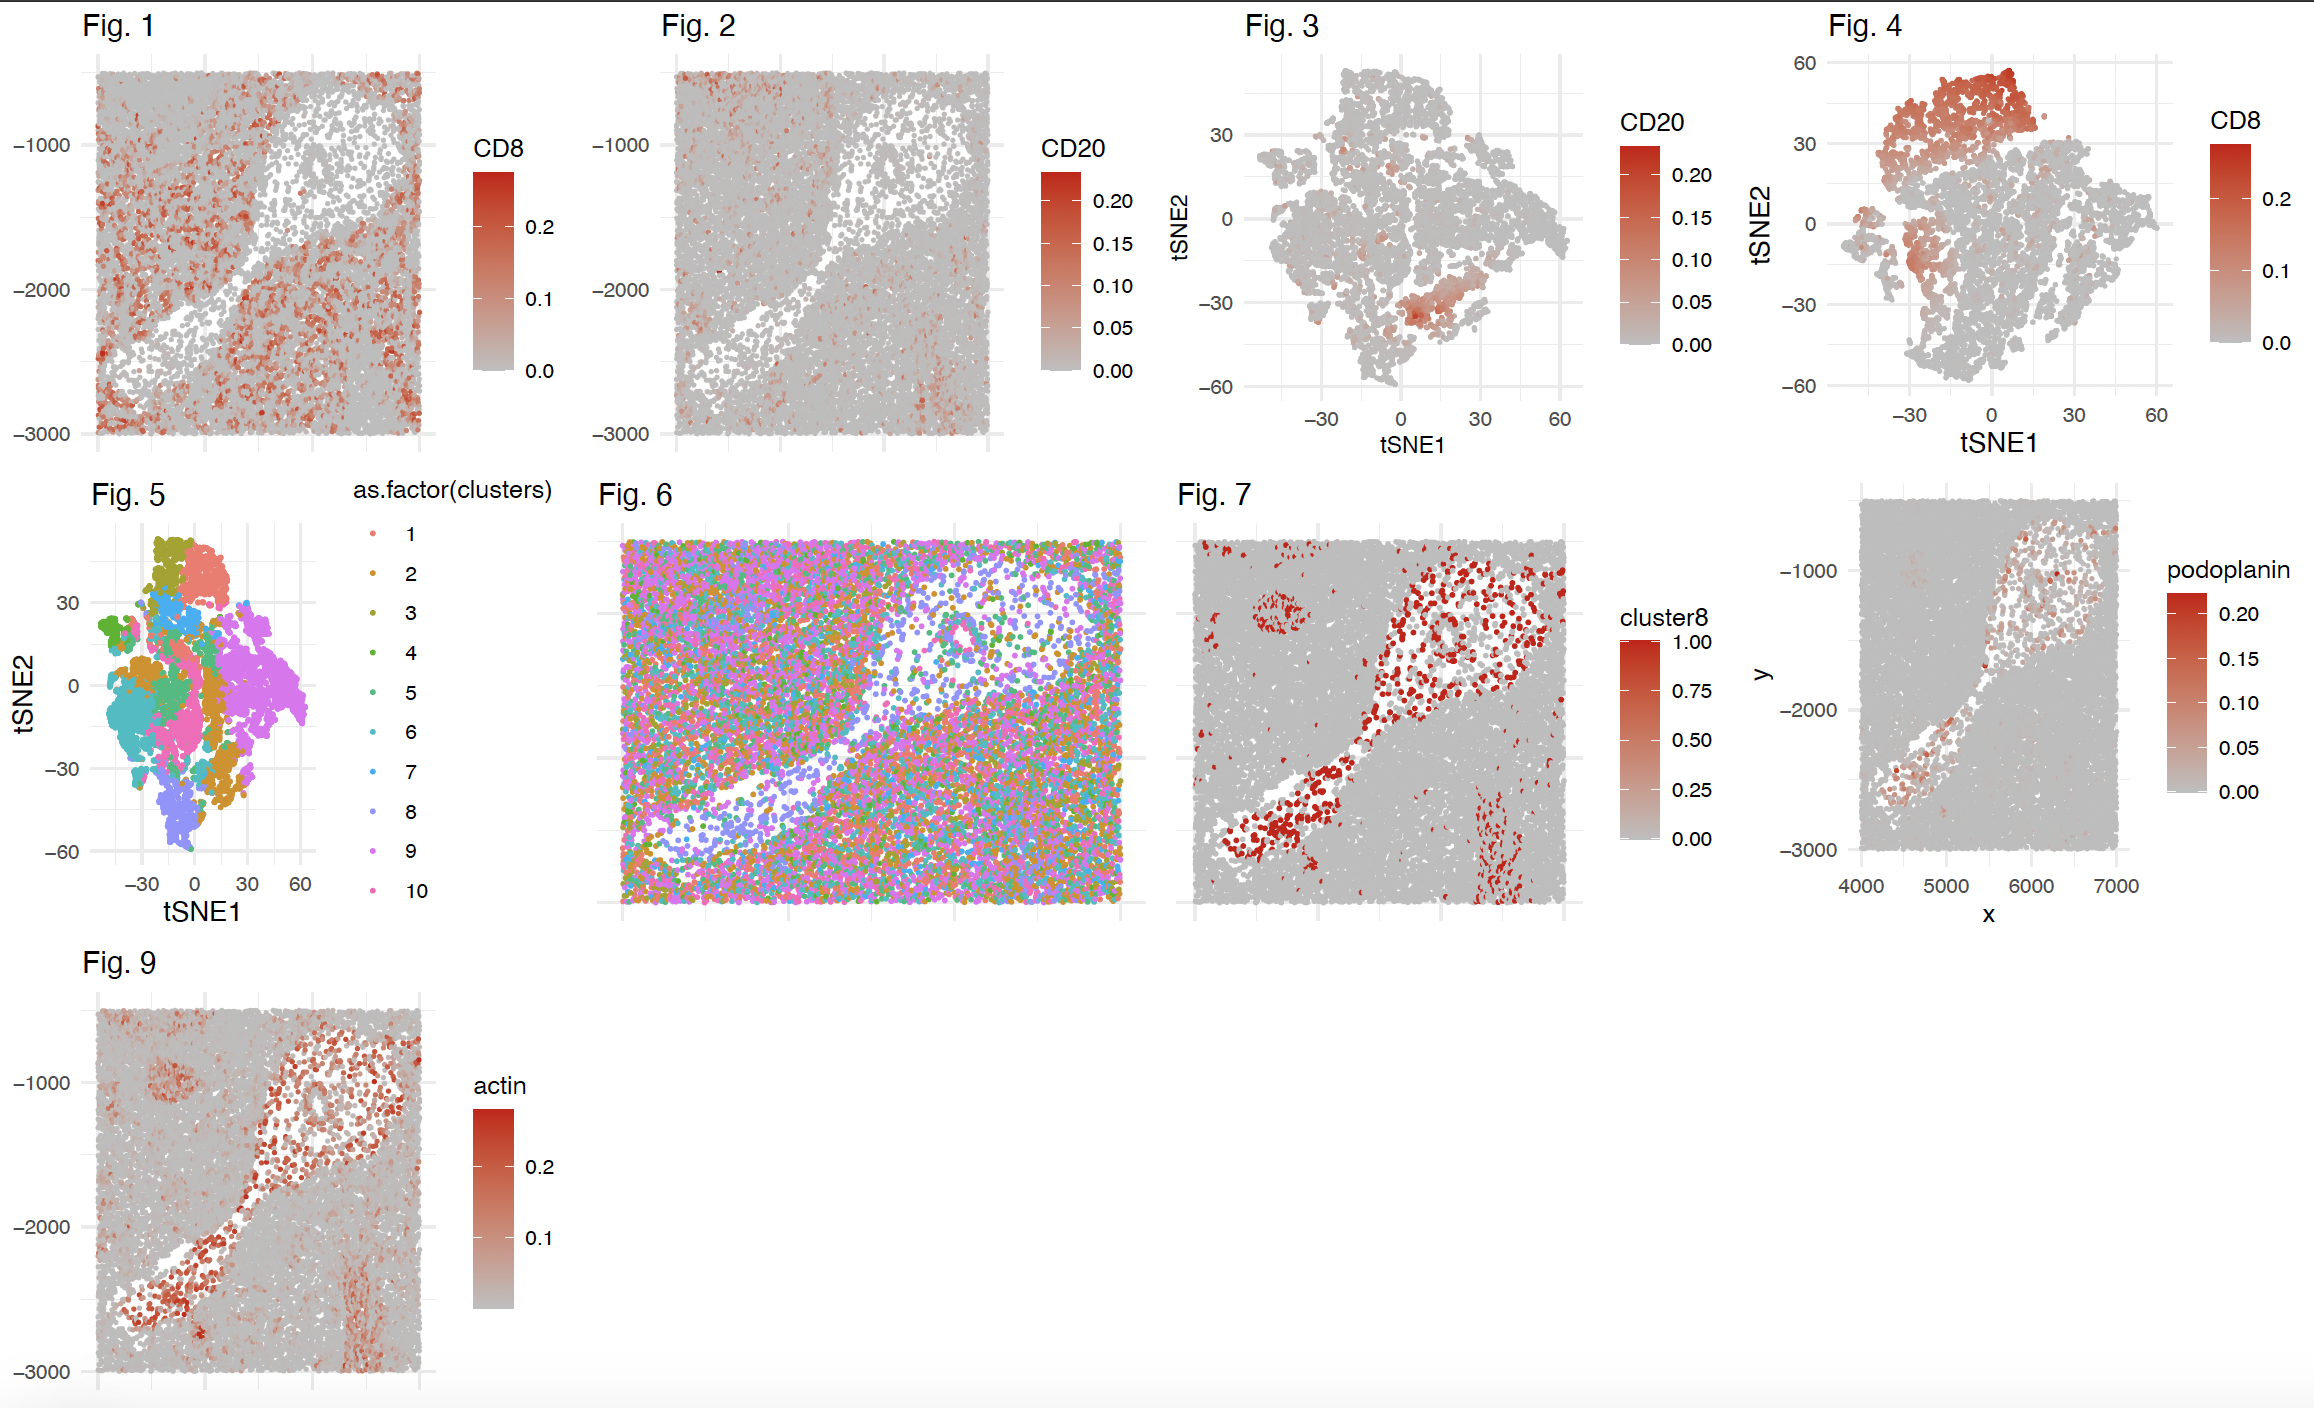
We are given a spatial protein expression dataset identify its originality. The figures shown above should be labeled A to G from left to right and from top to bottom....
Expression of 28 proteins has been measured in 11512 spleen cells by fluorescence intensity. Each cell area and position in the tissue sample has also been recorded. Fluorescence intensity has...
In Figure 1, I chose to visualize quantitative positional data regarding the spatial organization of cells within the proteomics data set. I used the geometric primitive of points to represent...
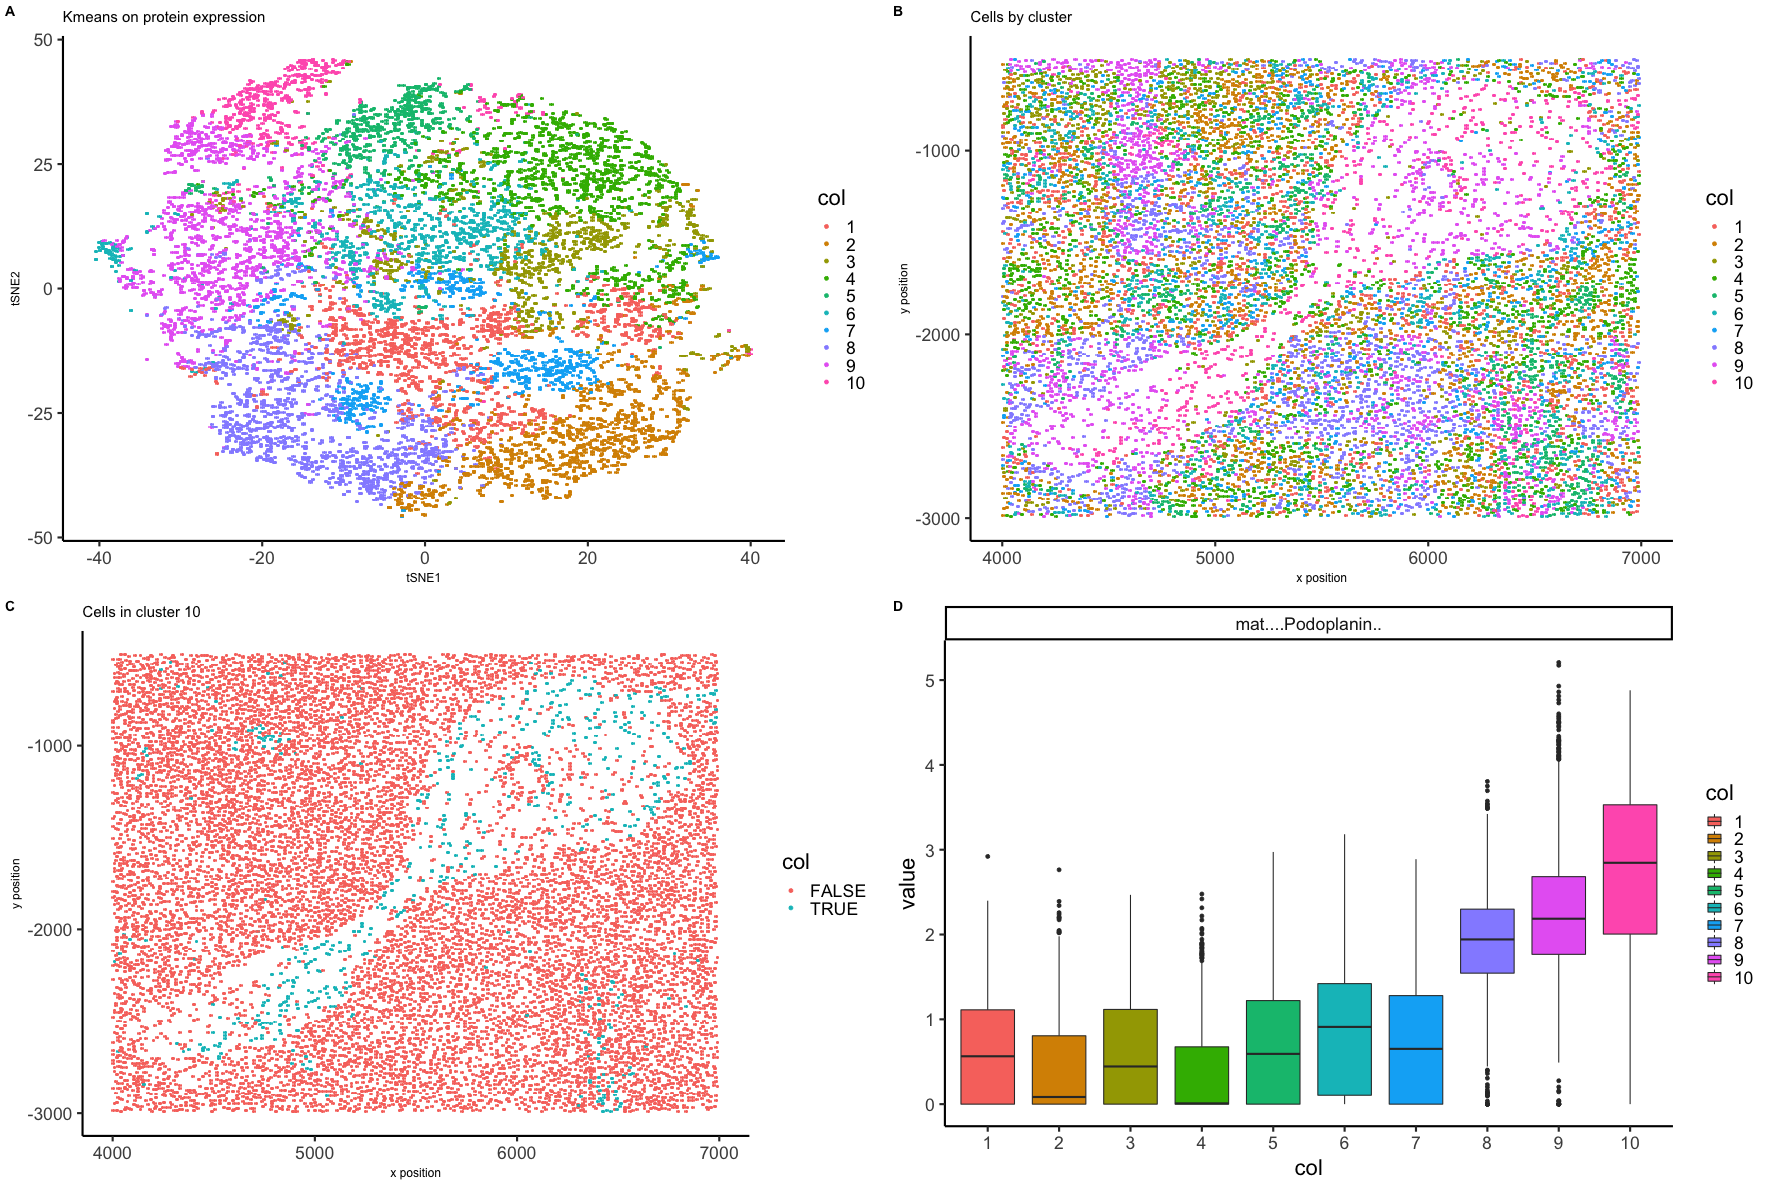
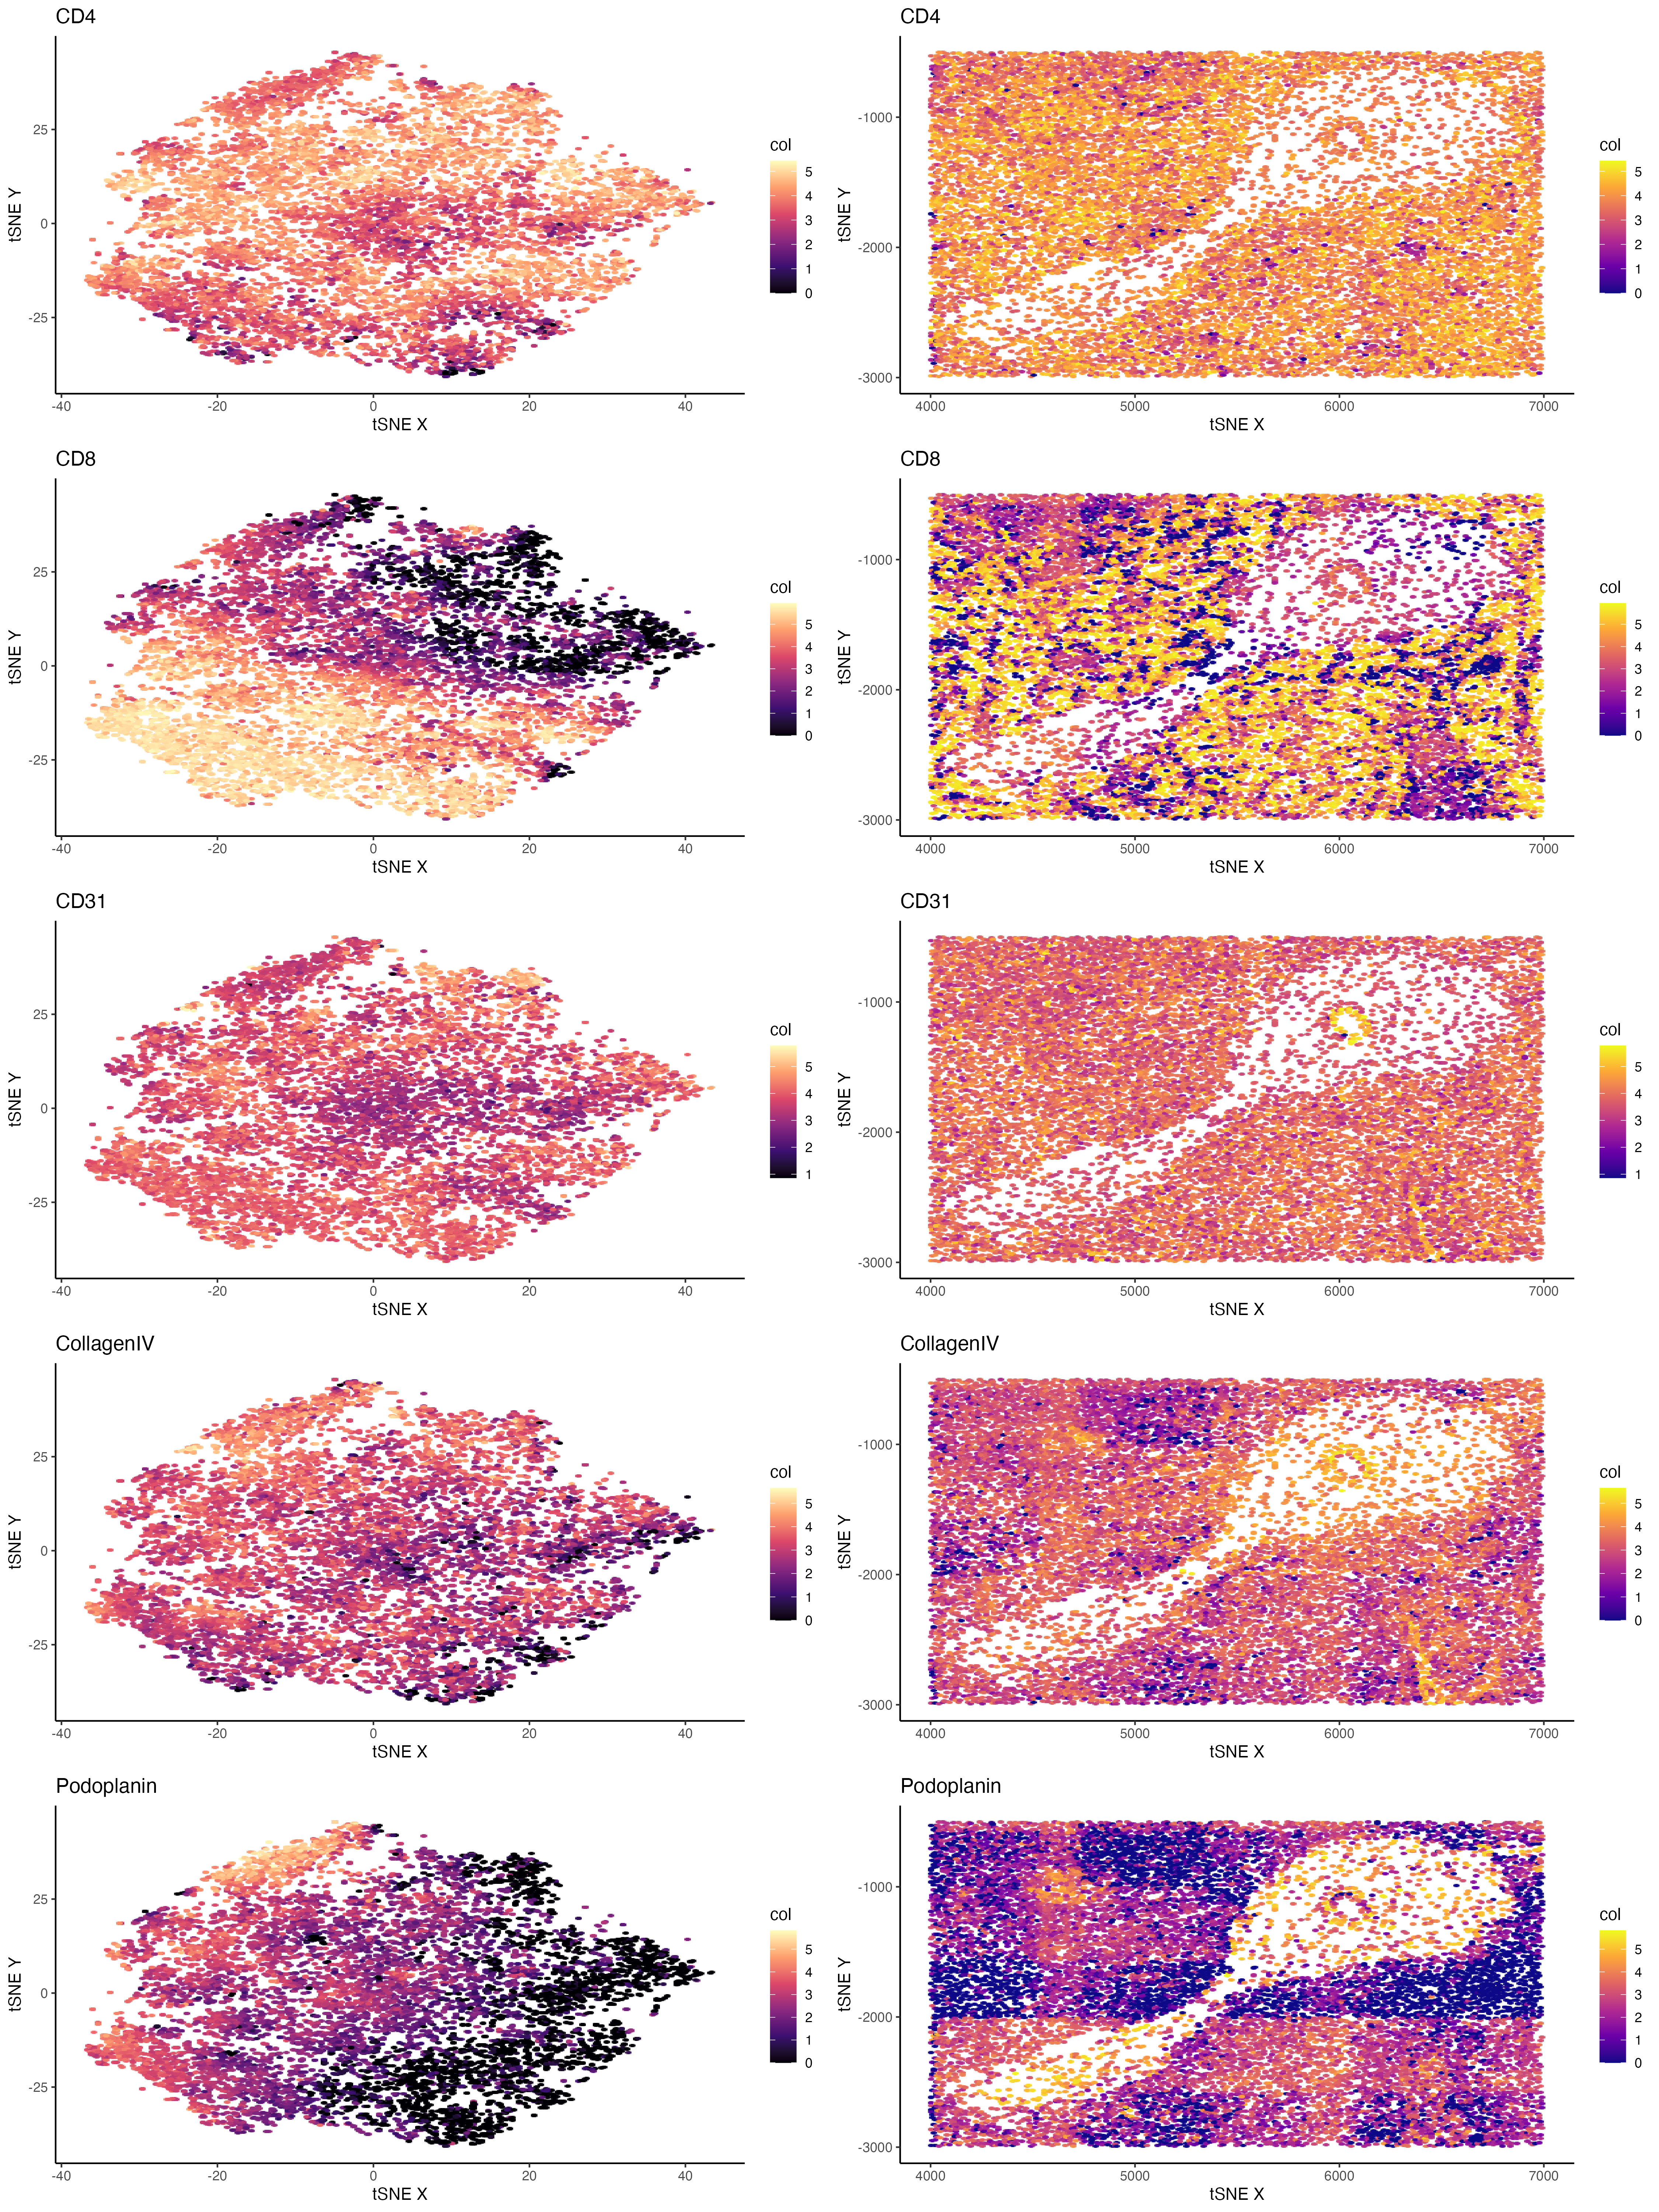
I tried to plot the protein expression in clusters and spatial organizations side by side for better comparison. I noticed a large proportion of genes sequenced are immune cell marker...