Welcome
Welcome to the Course Website for EN.580.428 Genomic Data Visualization!
As the primary mode through which analysts and audience members alike consume data, data visualization remains an important hypothesis generating and analytical technique in data-driven research to facilitate new discoveries. However, if done poorly, data visualization can also mislead, bias, and slow down progress. This hands-on course will cover the principles of perception and cognition relevant for data visualization and apply these principles to genomic data, including large-scale single-cell and spatially-resolved omics datasets, using the R statistical programming language. Students will be expected to complete class readings, create weekly data visualizations as homework assignments, and make a major class presentation.
Course Information
Course Staff: Prof. Jean Fan and Lyla Atta
Office Hours: 10:00am-10:50am Monday, Wednesday, and Friday. See Slack for location details.
Lectures: 8:00am-9:50am Monday, Wednesday, and Friday. See Slack for location details.
Course Details
☞ see Course tabFeatured Visualizations
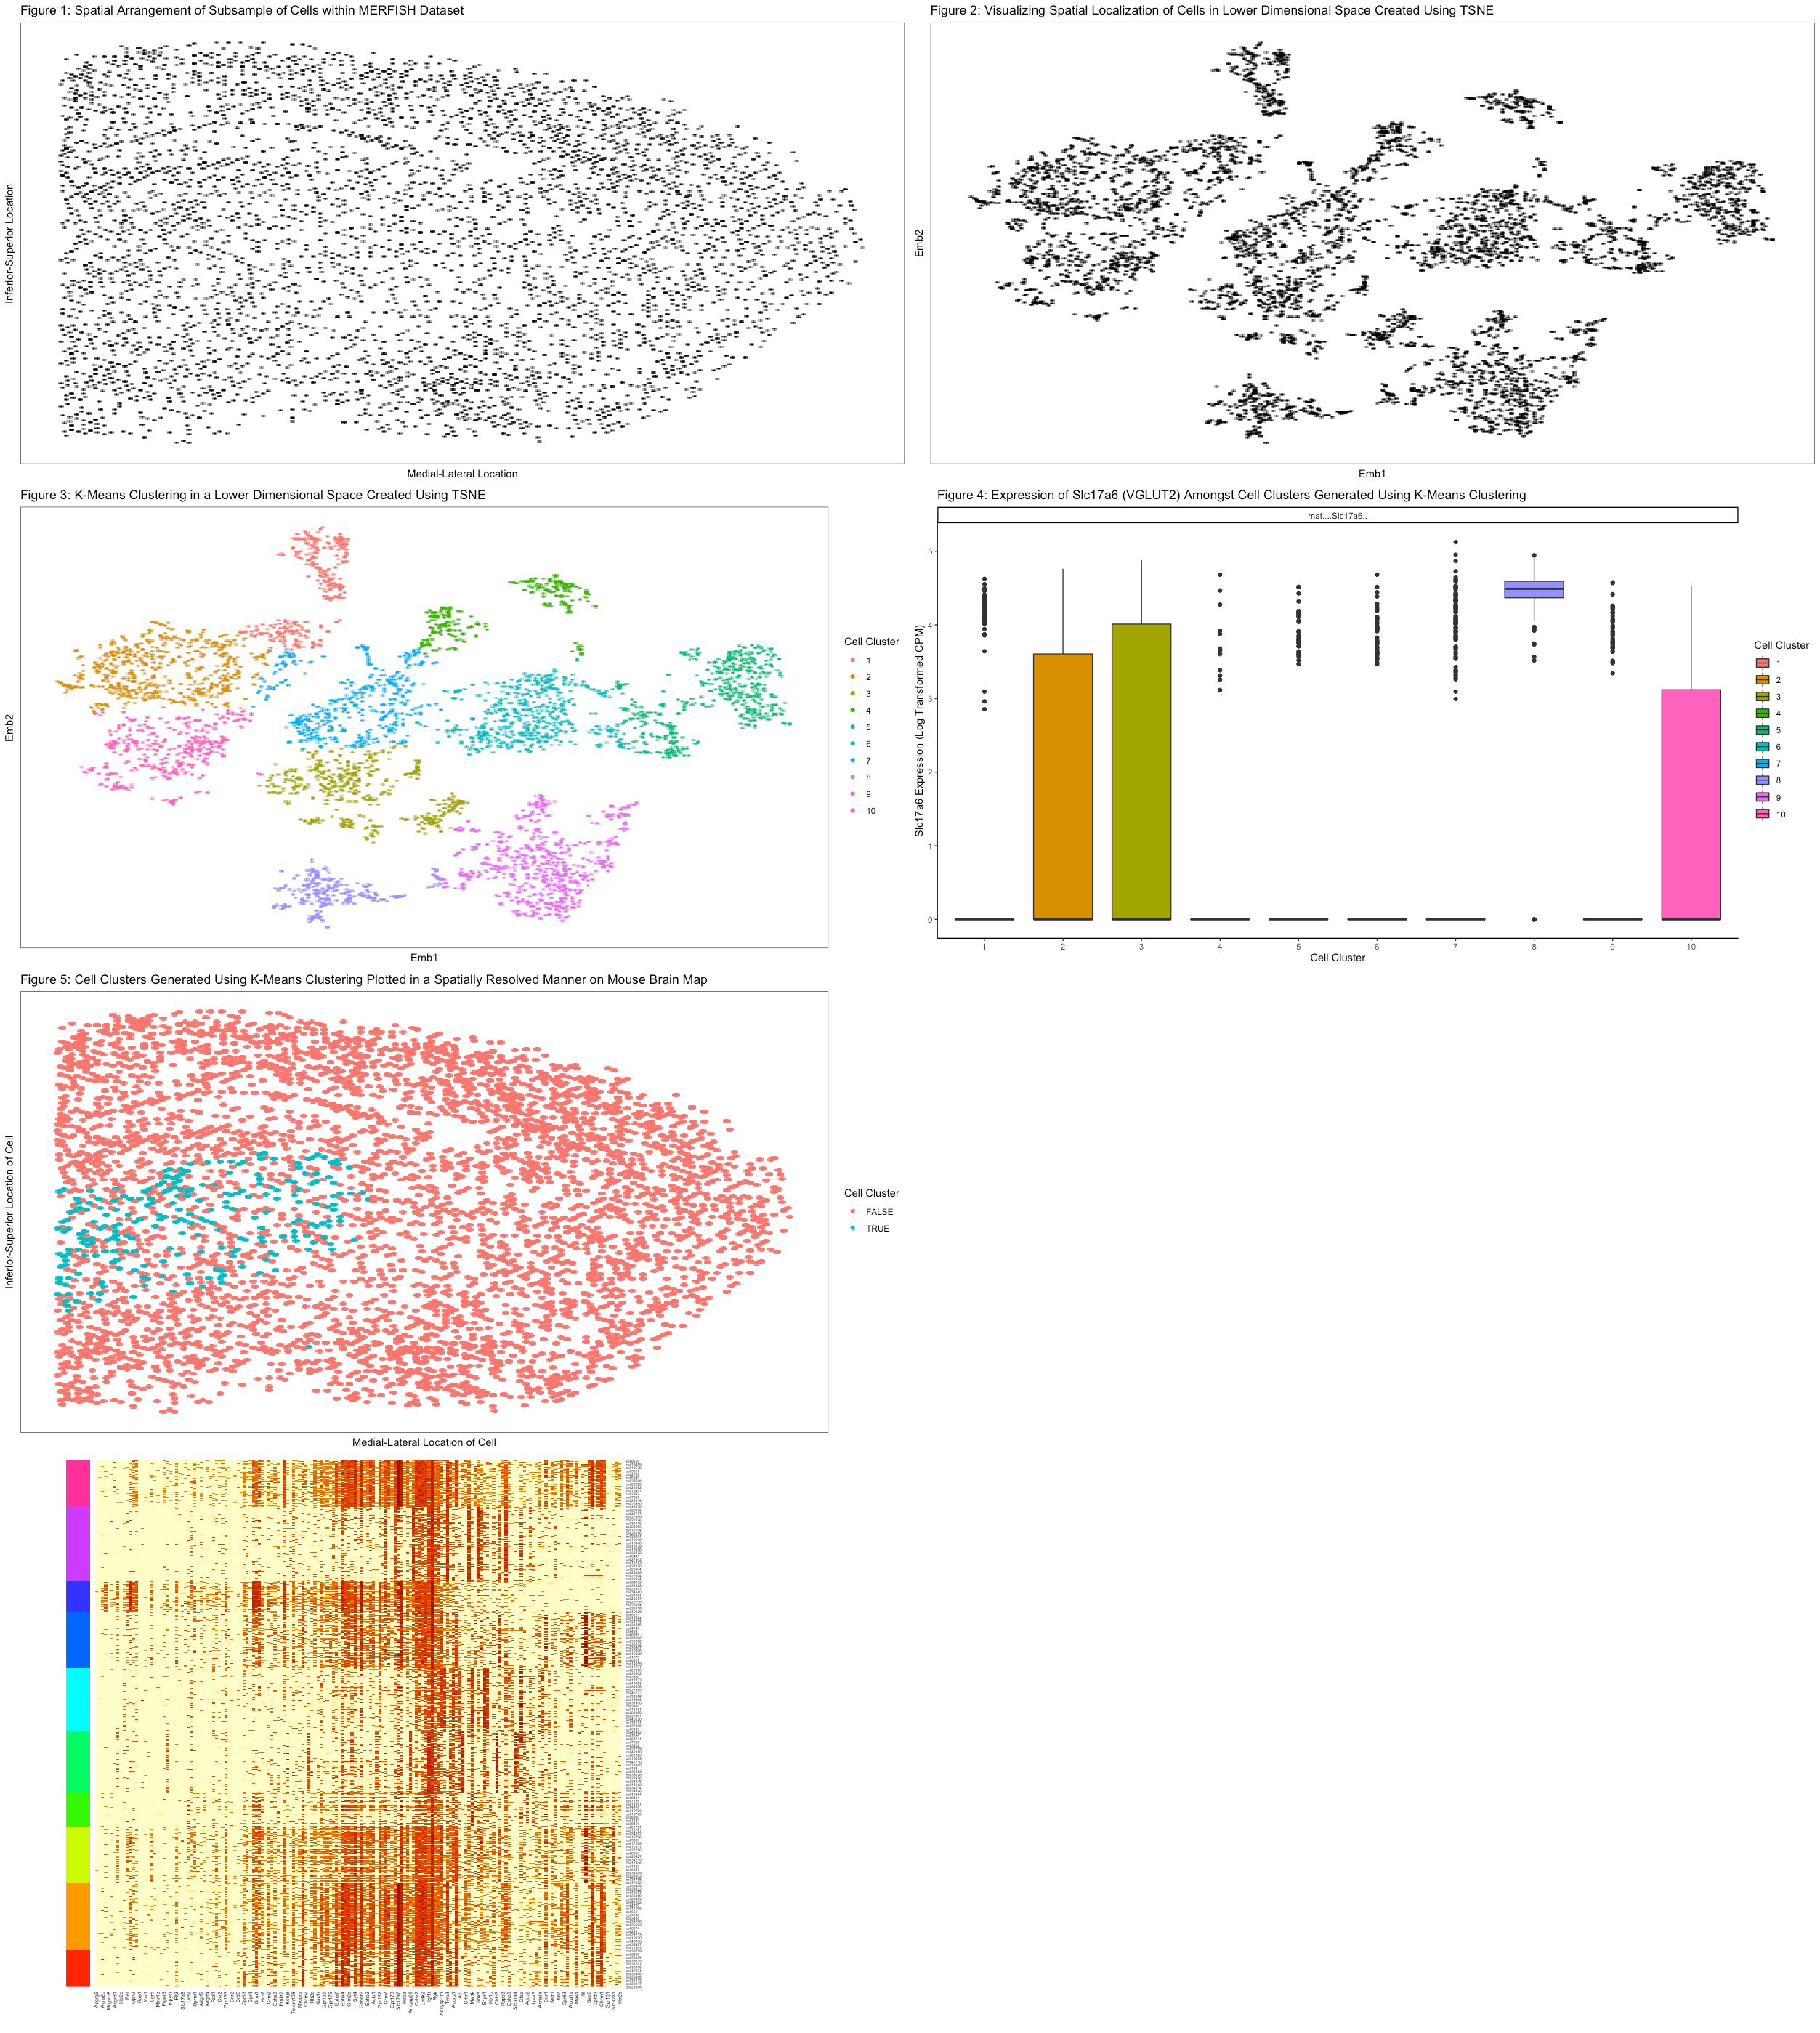
Identifying the Cell-type of a Random Cell Cluster
In Figure 1, I have plotted the spatial distribution of cells within our MERFISH data set, after down-sampling the data. I used the geometric primitive...

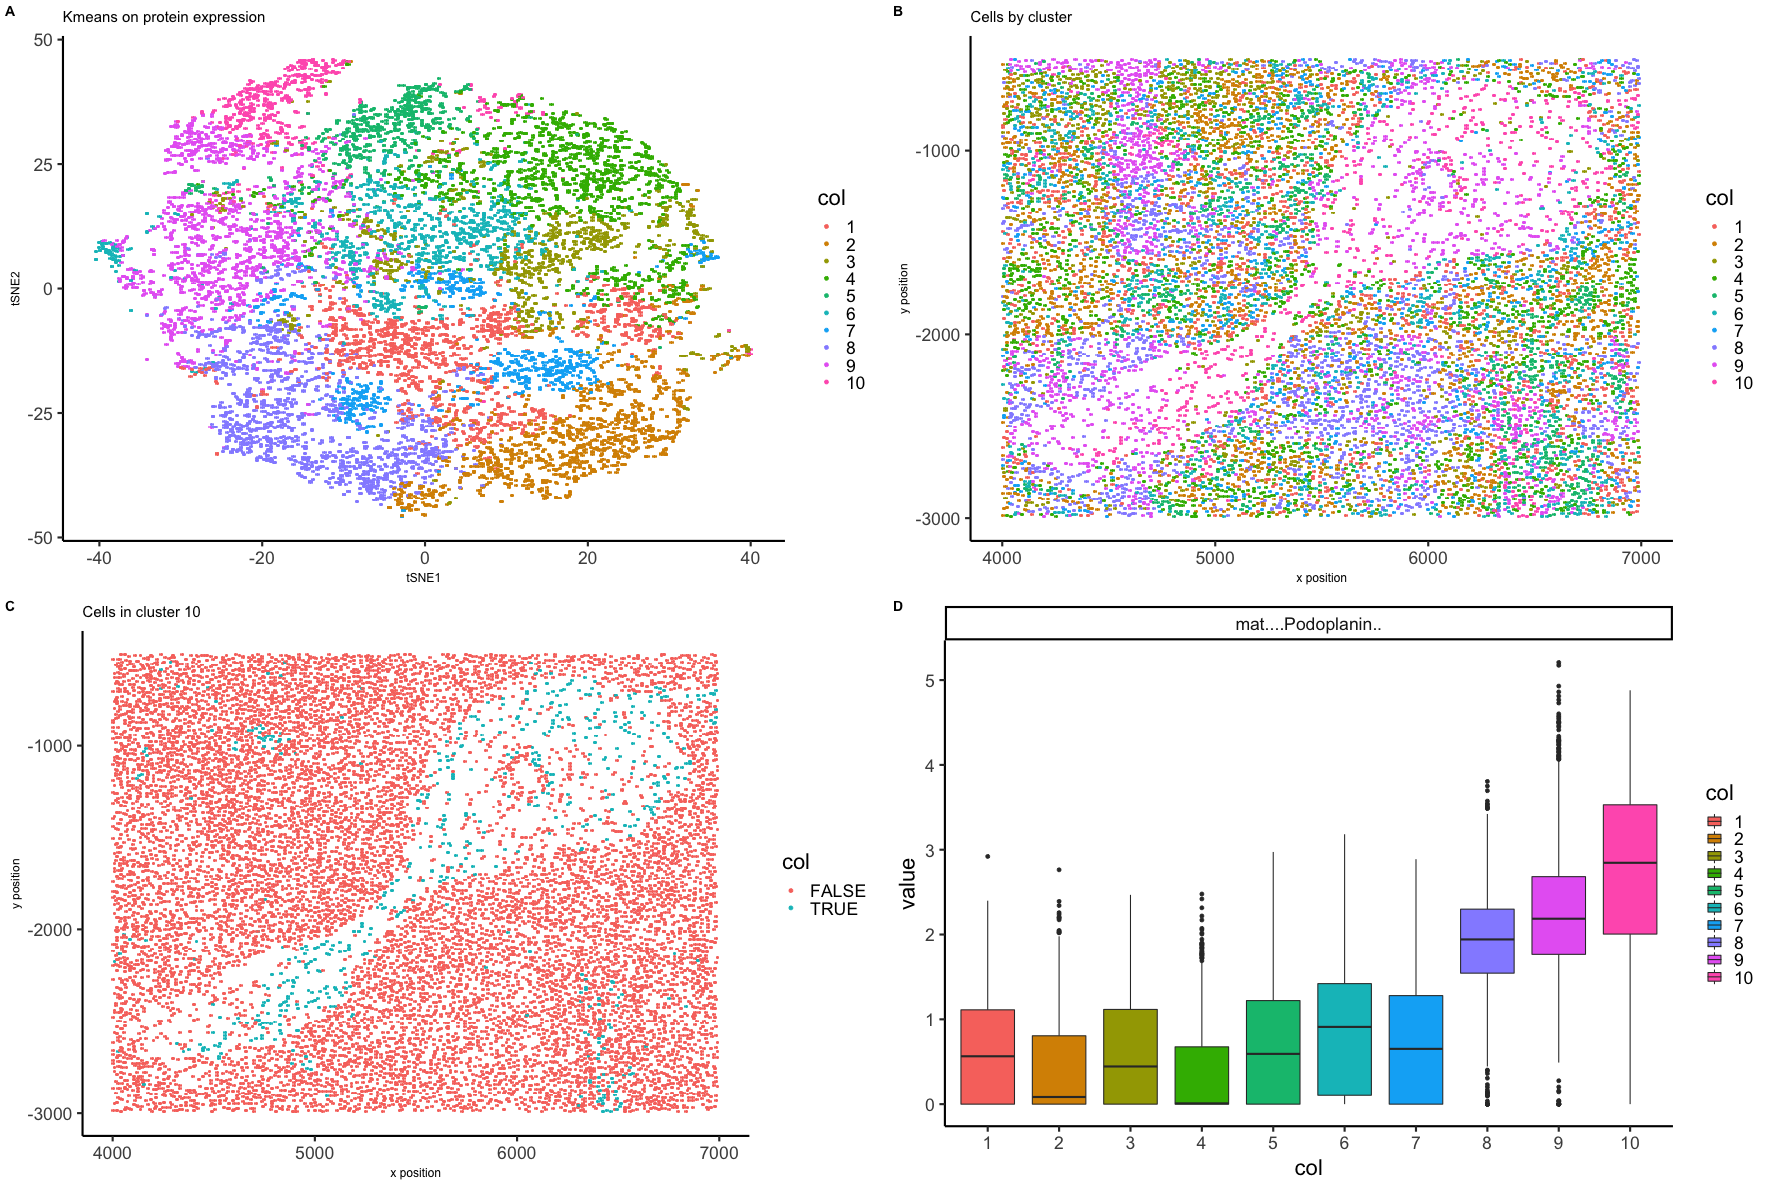
Homework 4 Yash Sonthalia
Figure schema as follows: A) Top left B) Top right C) Bottom left D) Bottom right

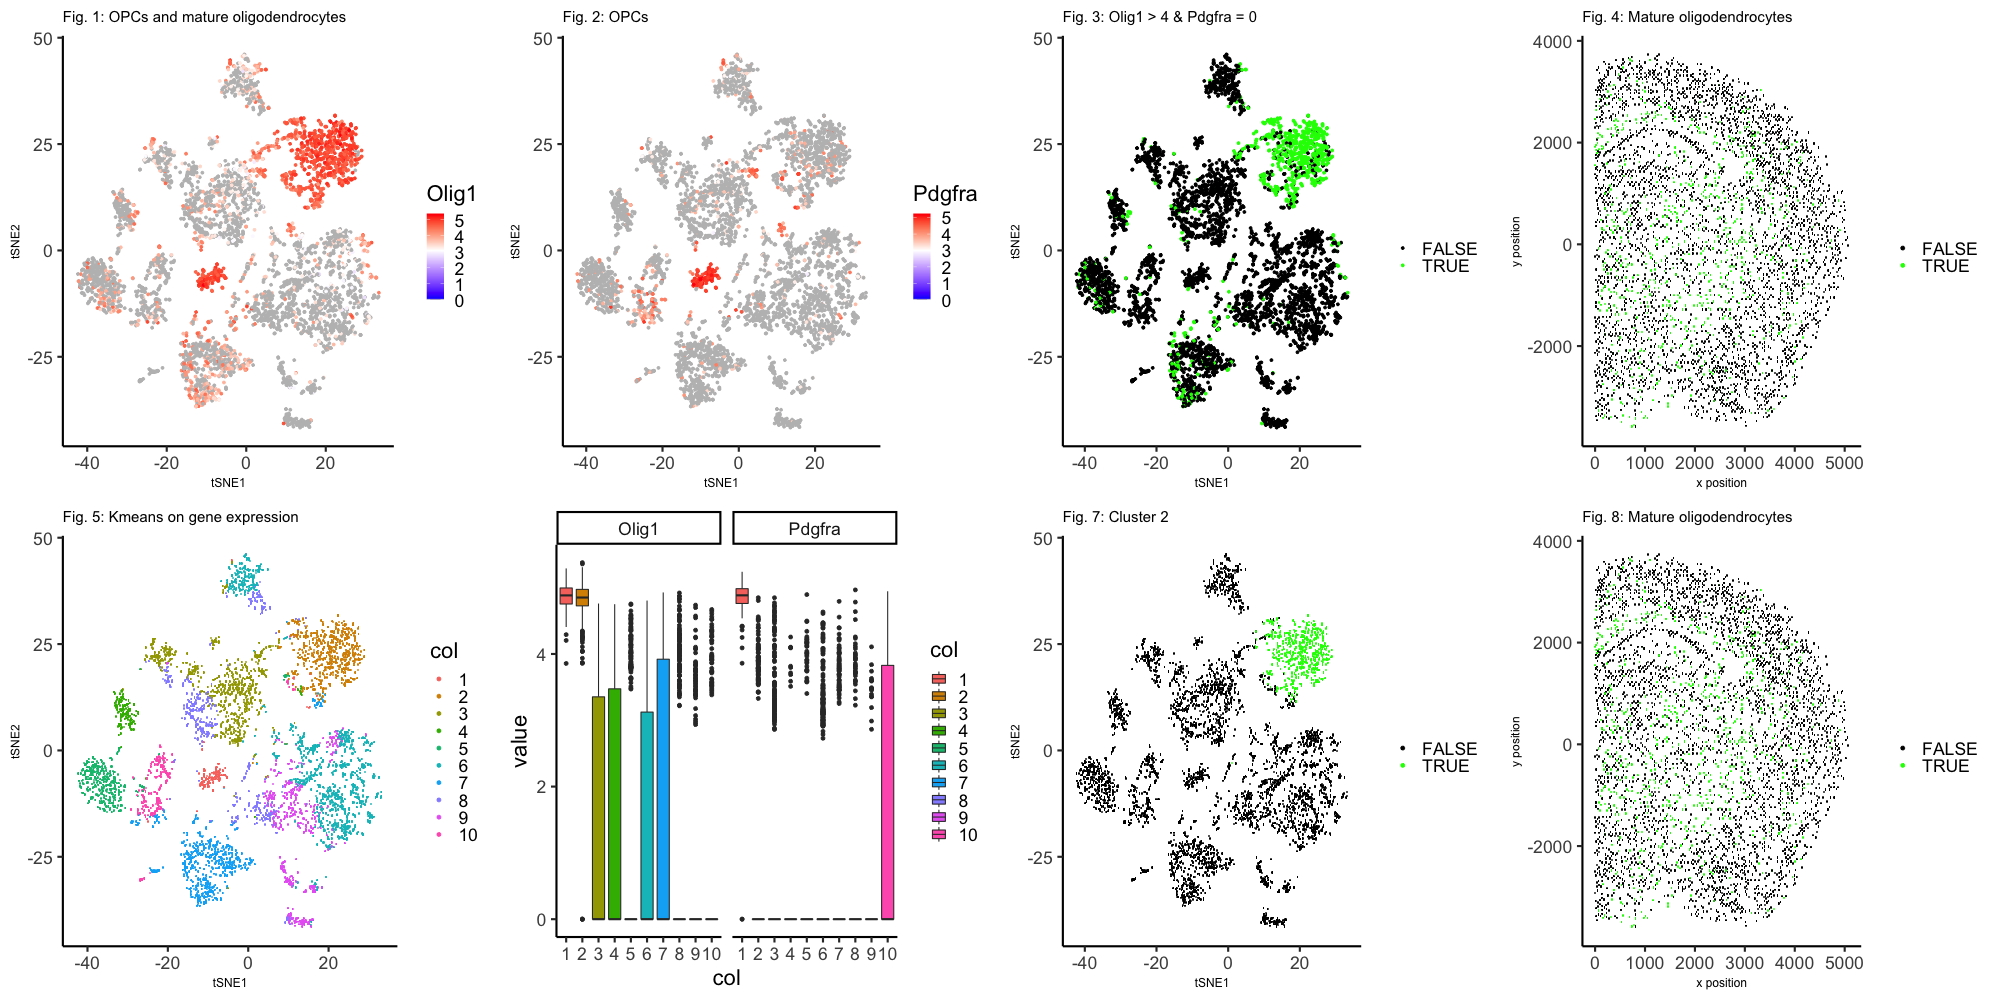
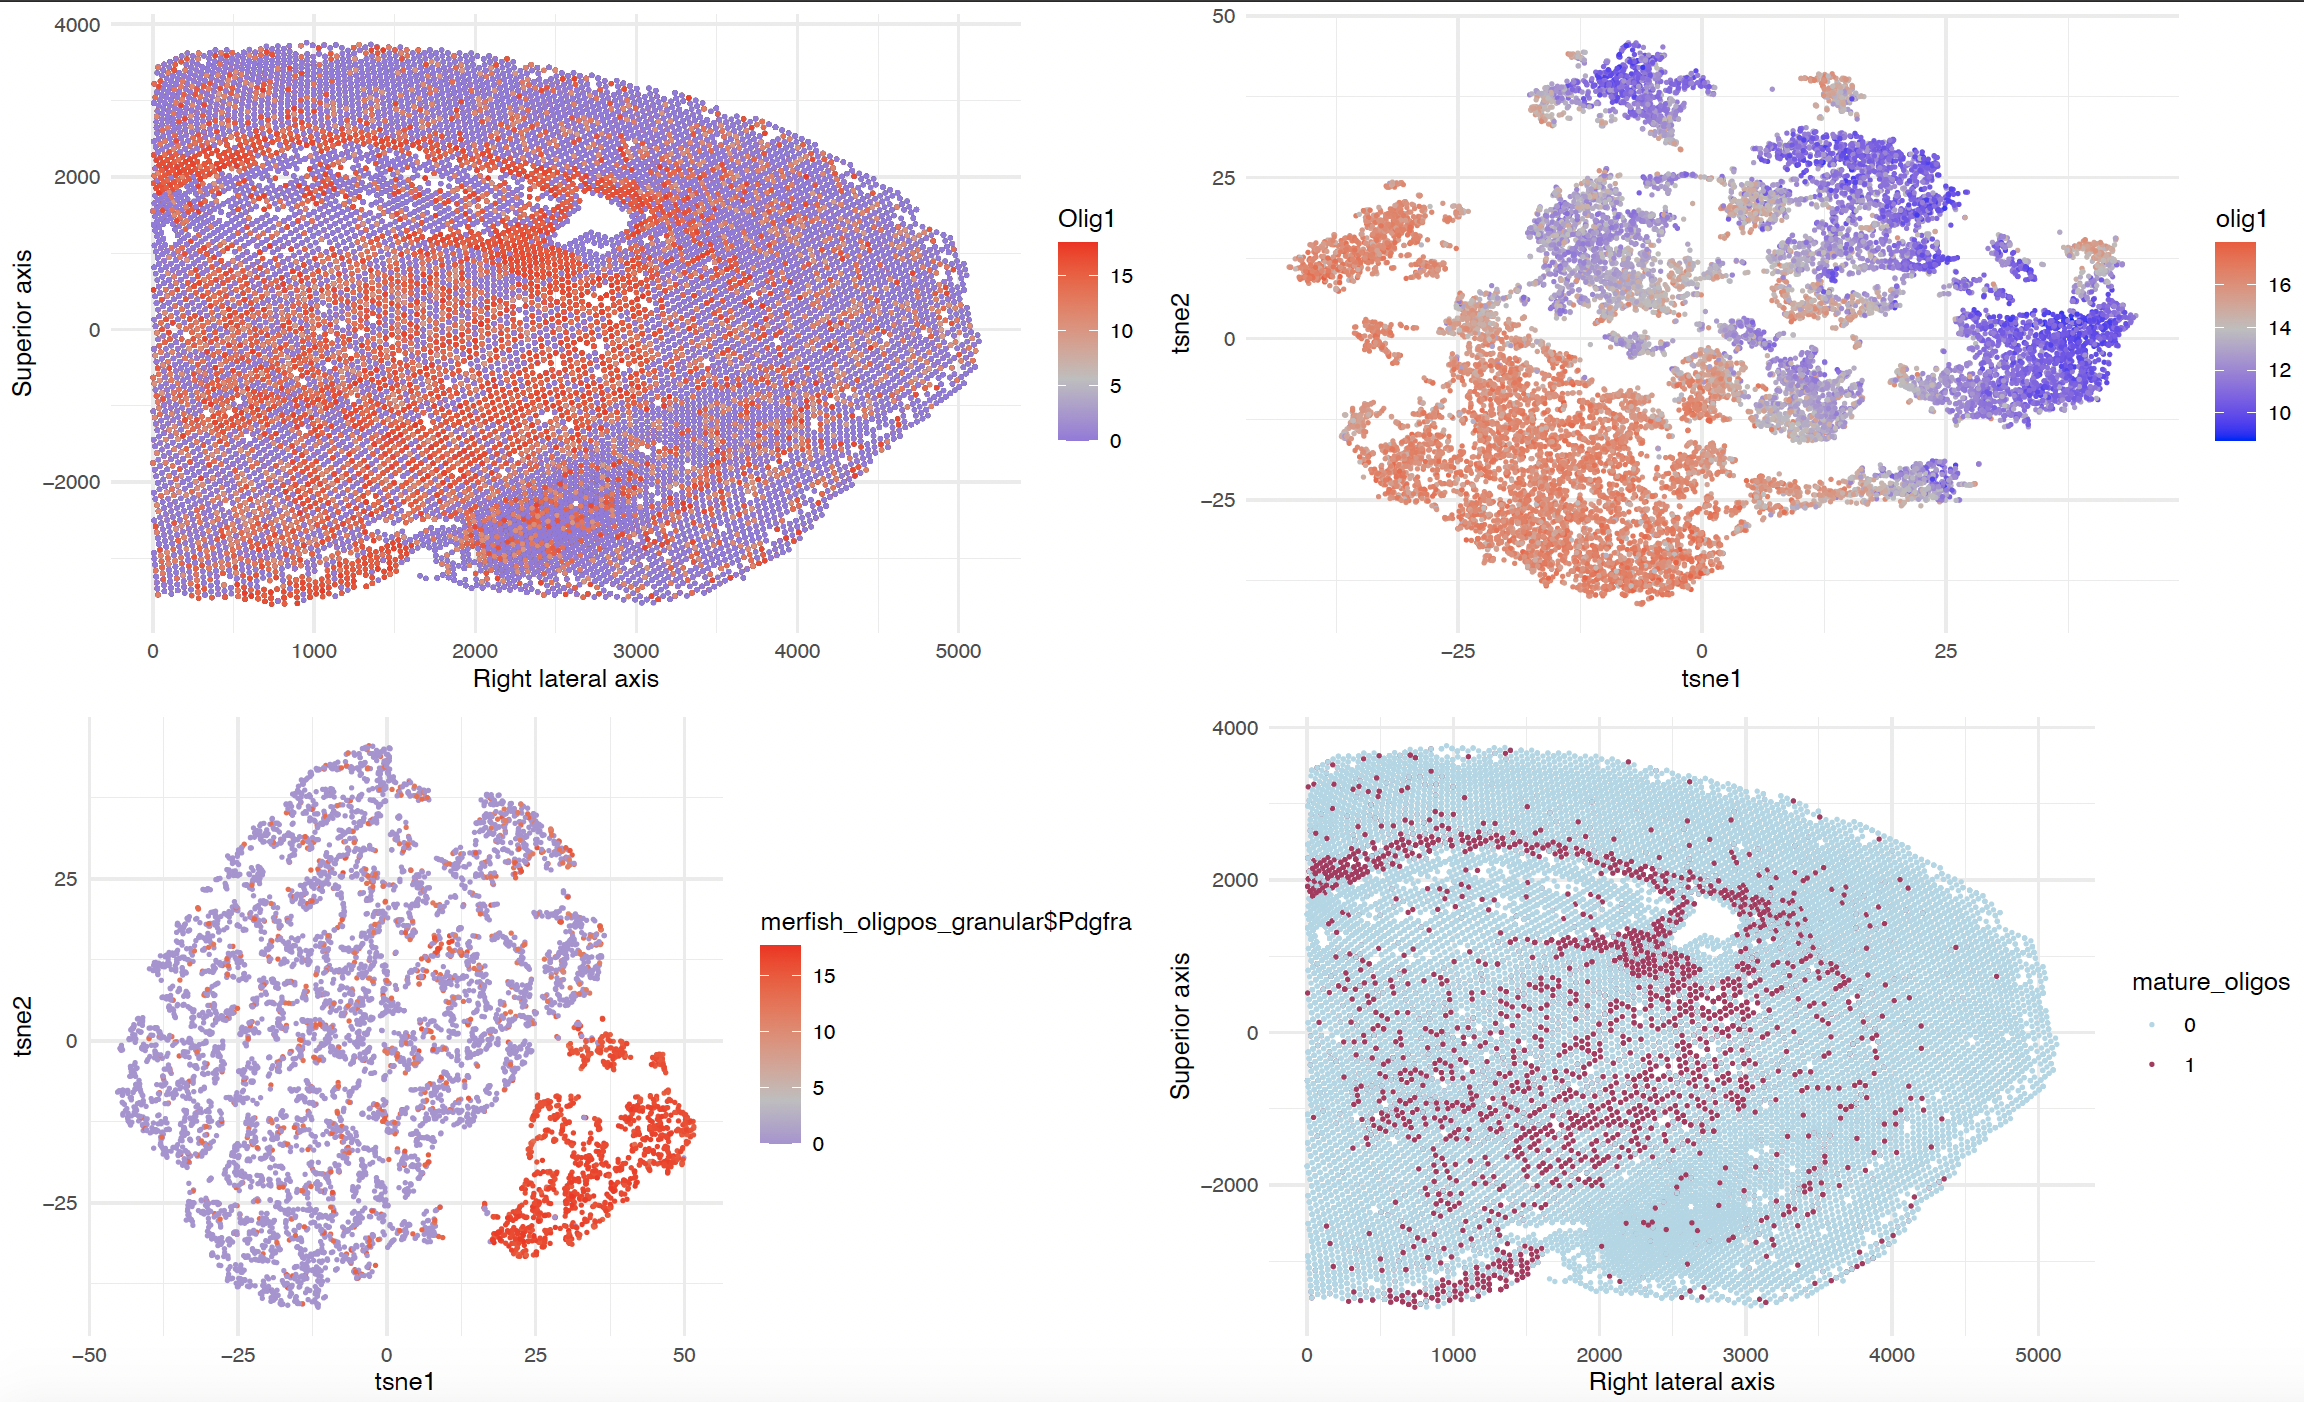
Mature Oligodendrocytes in MERFISH Data Predicted by high Olig1 expression and low or no Pdgfra expression
Gene expression of 5000 cells was measured by MERFISH. Initially, populations were grouped by the first thirty principle components and visualized in two dimensions by...

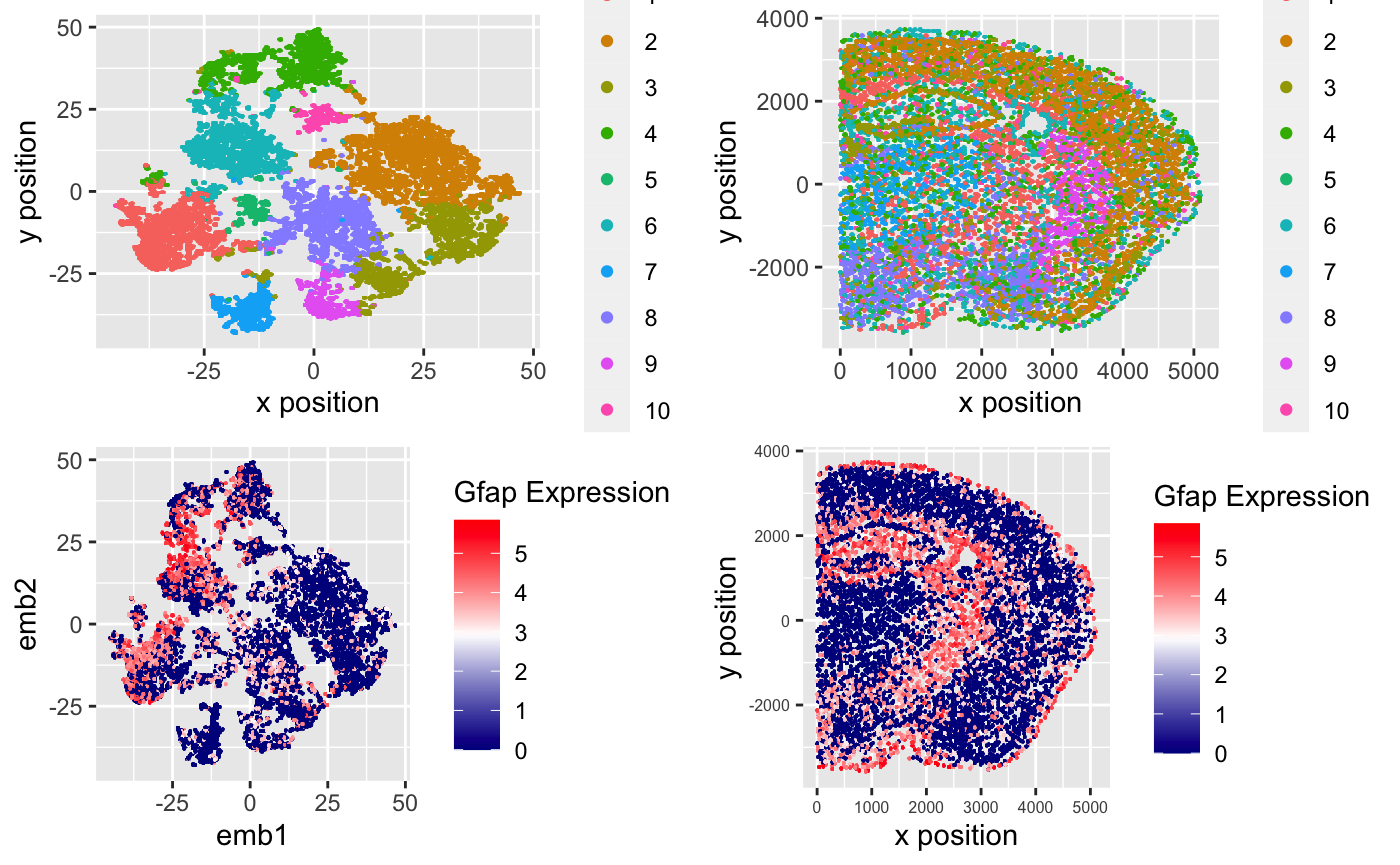
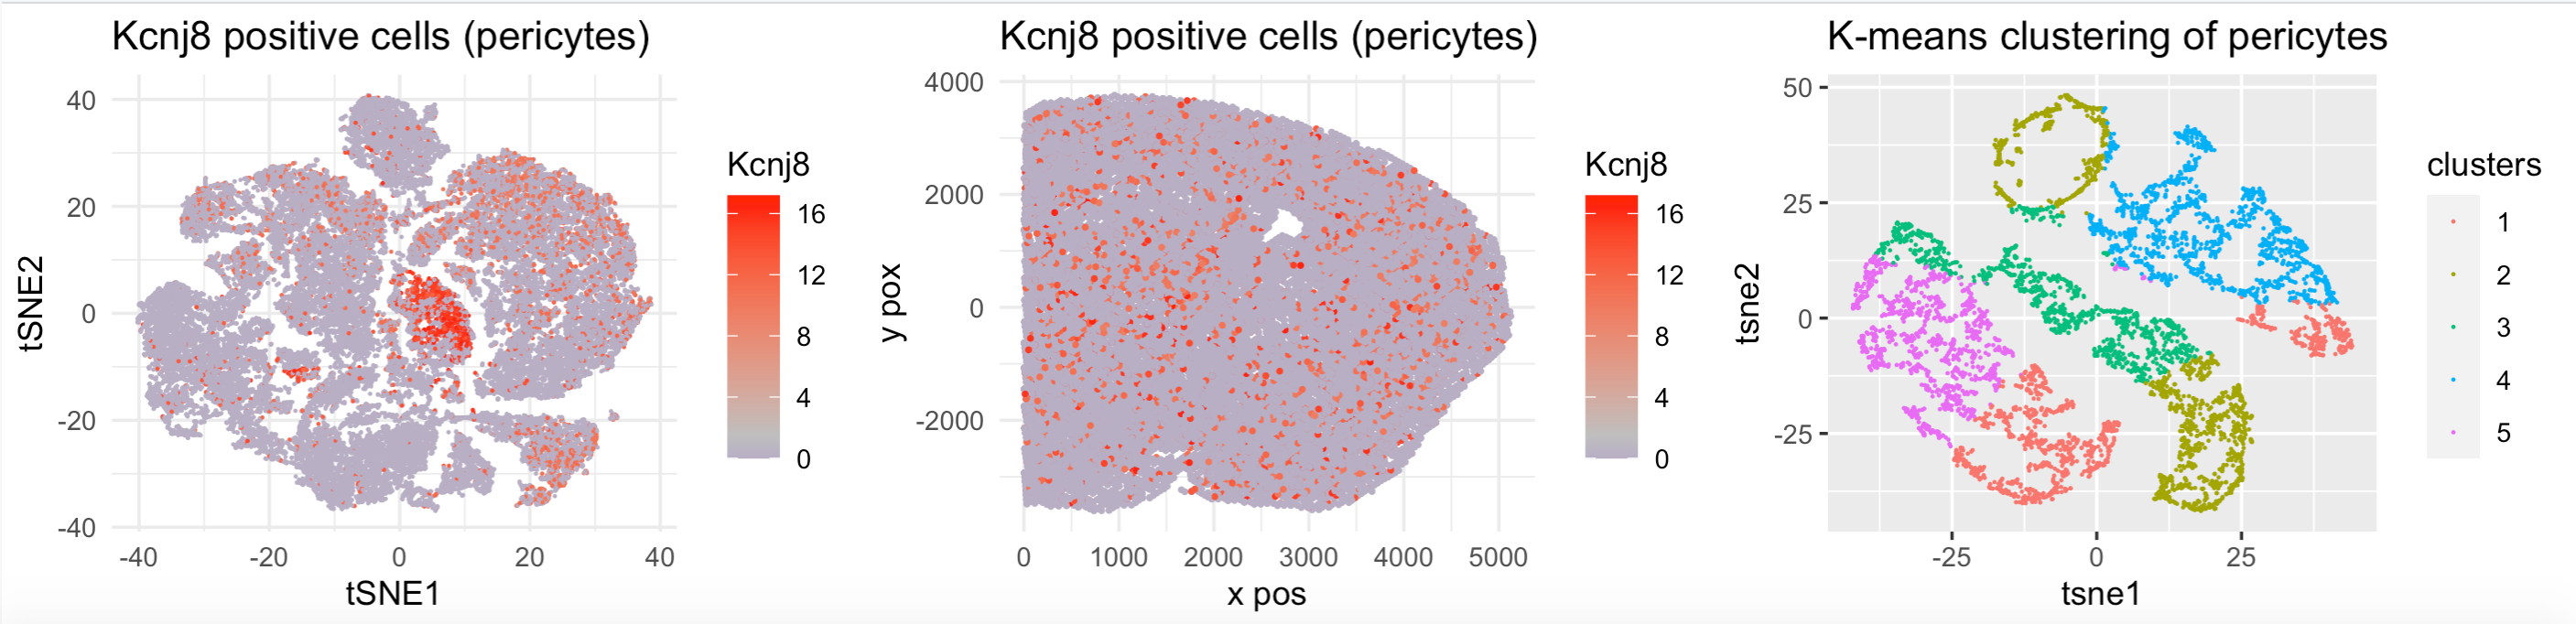
Exploration of GFAP expression in Kmeans Clustering of MERFISH data
I am visualizing quantitative data of the expression level after TSNE embedding and kmeans clustering based on that in the MERFISH dataset.

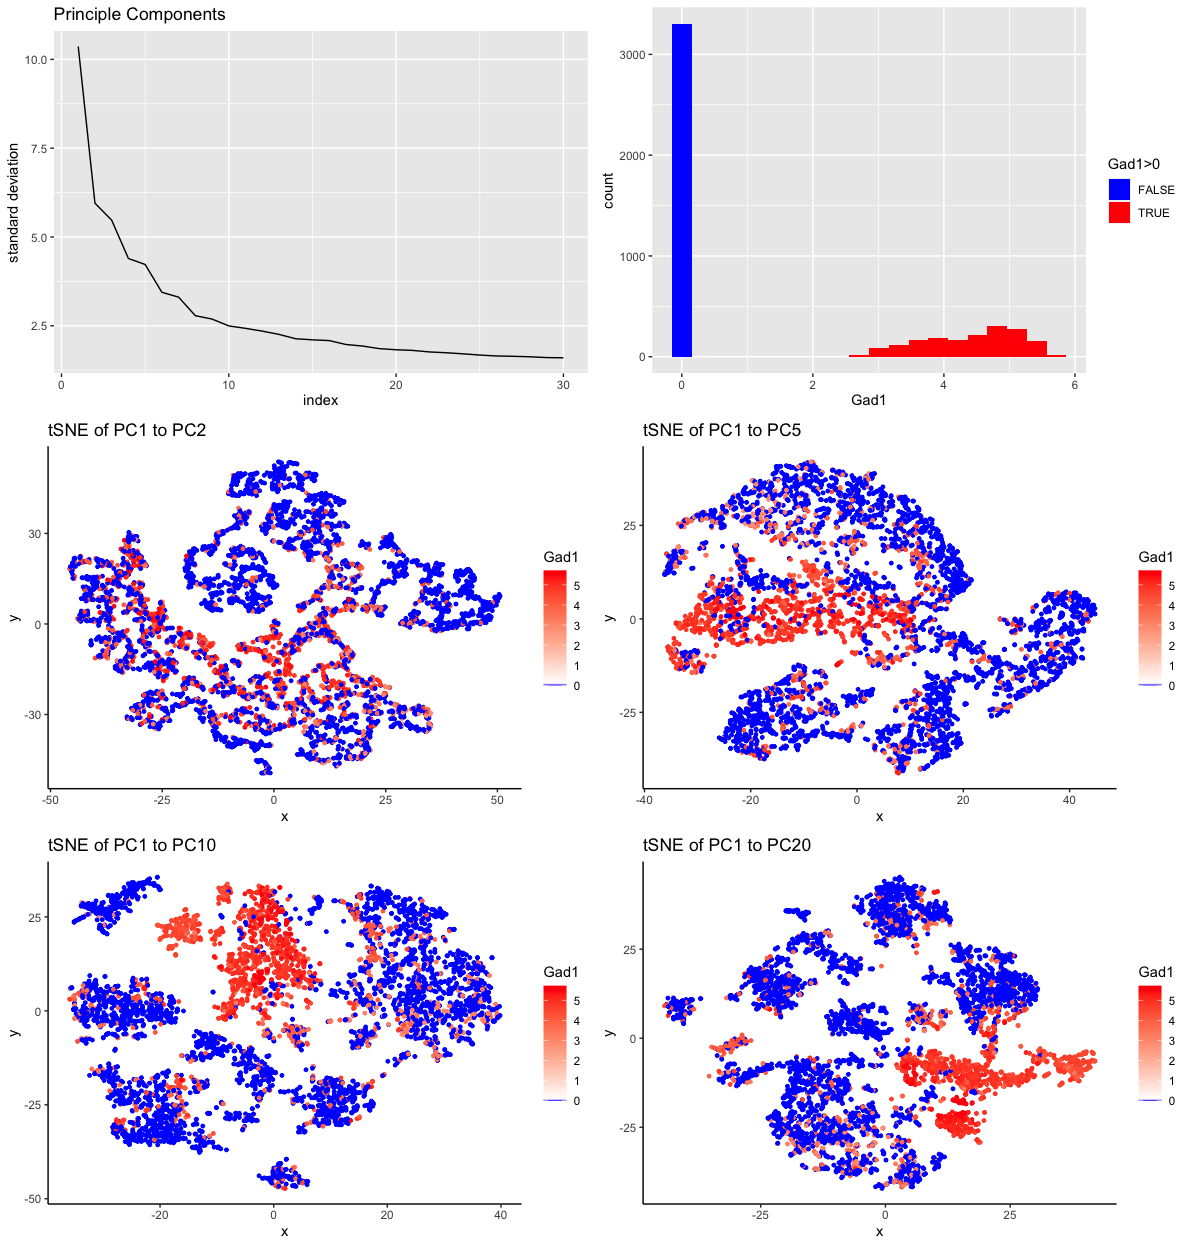
Cells Expressing Gad1 in MERFISH Data Grouped by PCA
My multipanel visualization includes six individual plots. The origin of the data for all plots is the MERFISH dataset (42519 cells x 486 genes) which...

Comparing tSNE and PCA in Visium Data
I am visualizing PC1 and PC2 from PCA in Visium Data as well as tSNE Dimension 1 in Visium. PC1, PC2, and tSNE Dimension 1...

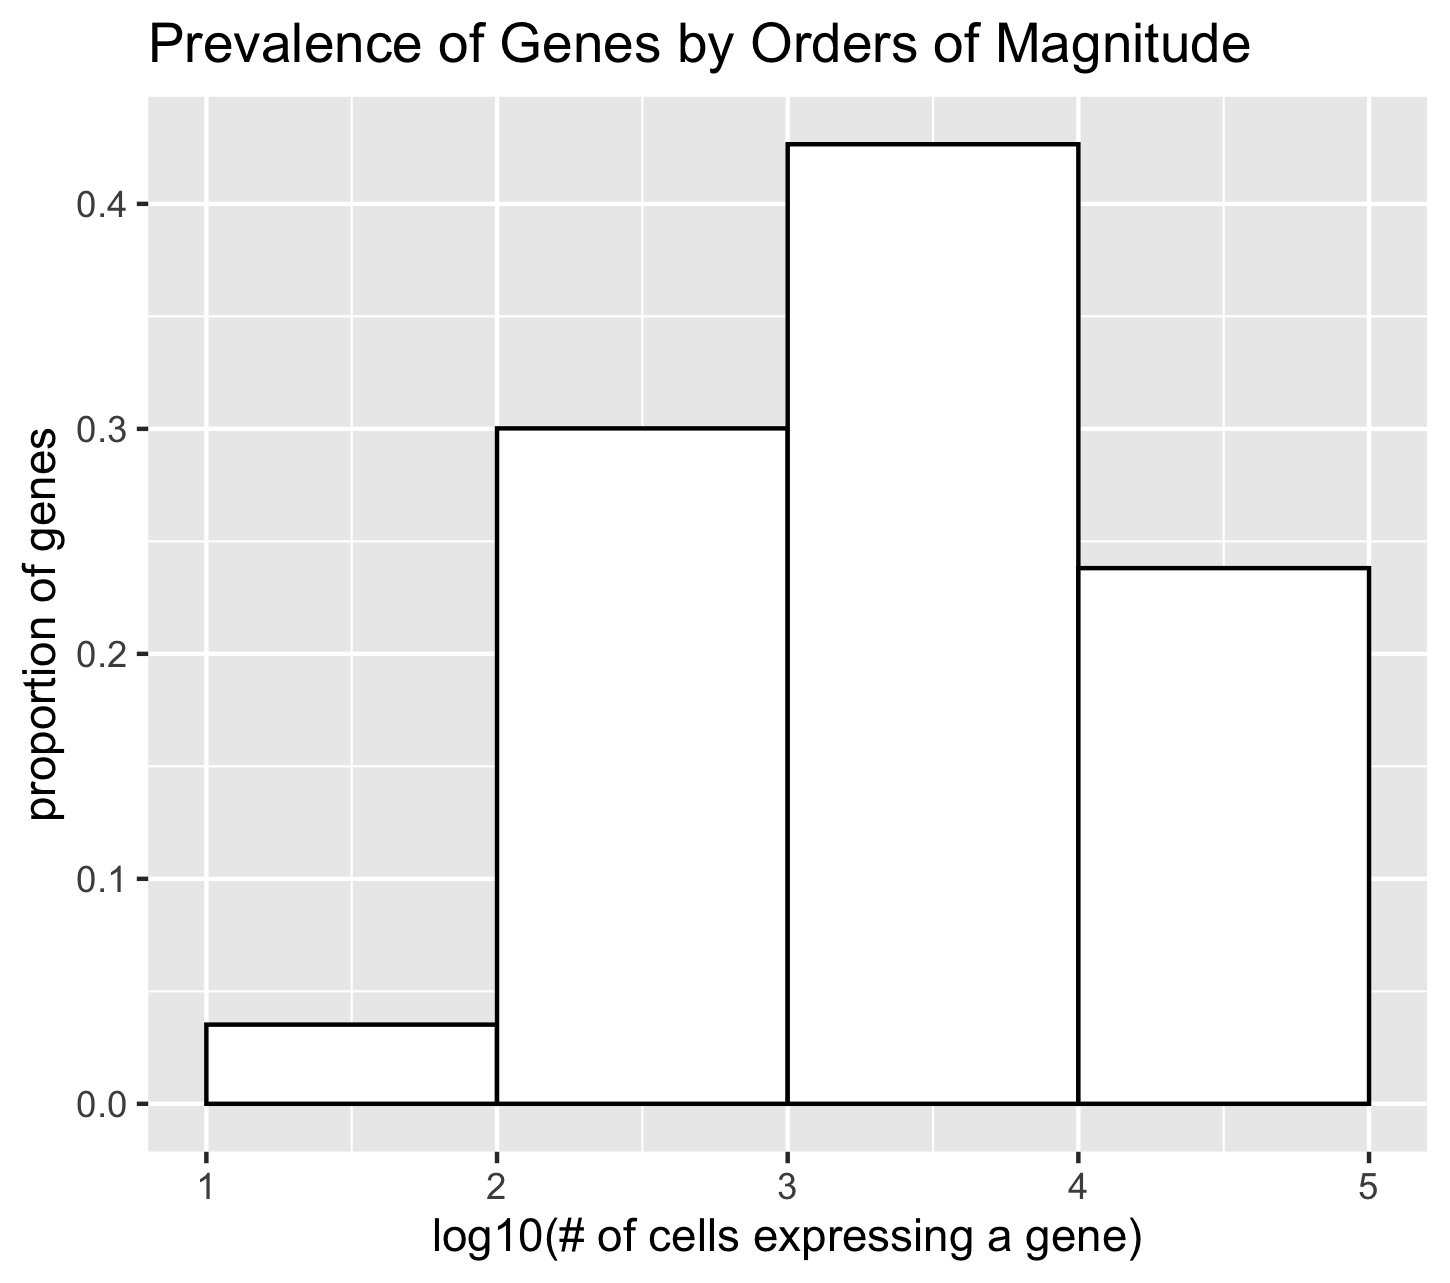
Prevalence of Genes in MERFISH by Order of Magnitude
I am visualizing the genes in the MERFISH dataset proportioned by the number of cells expressing each gene, which is quantitative data.
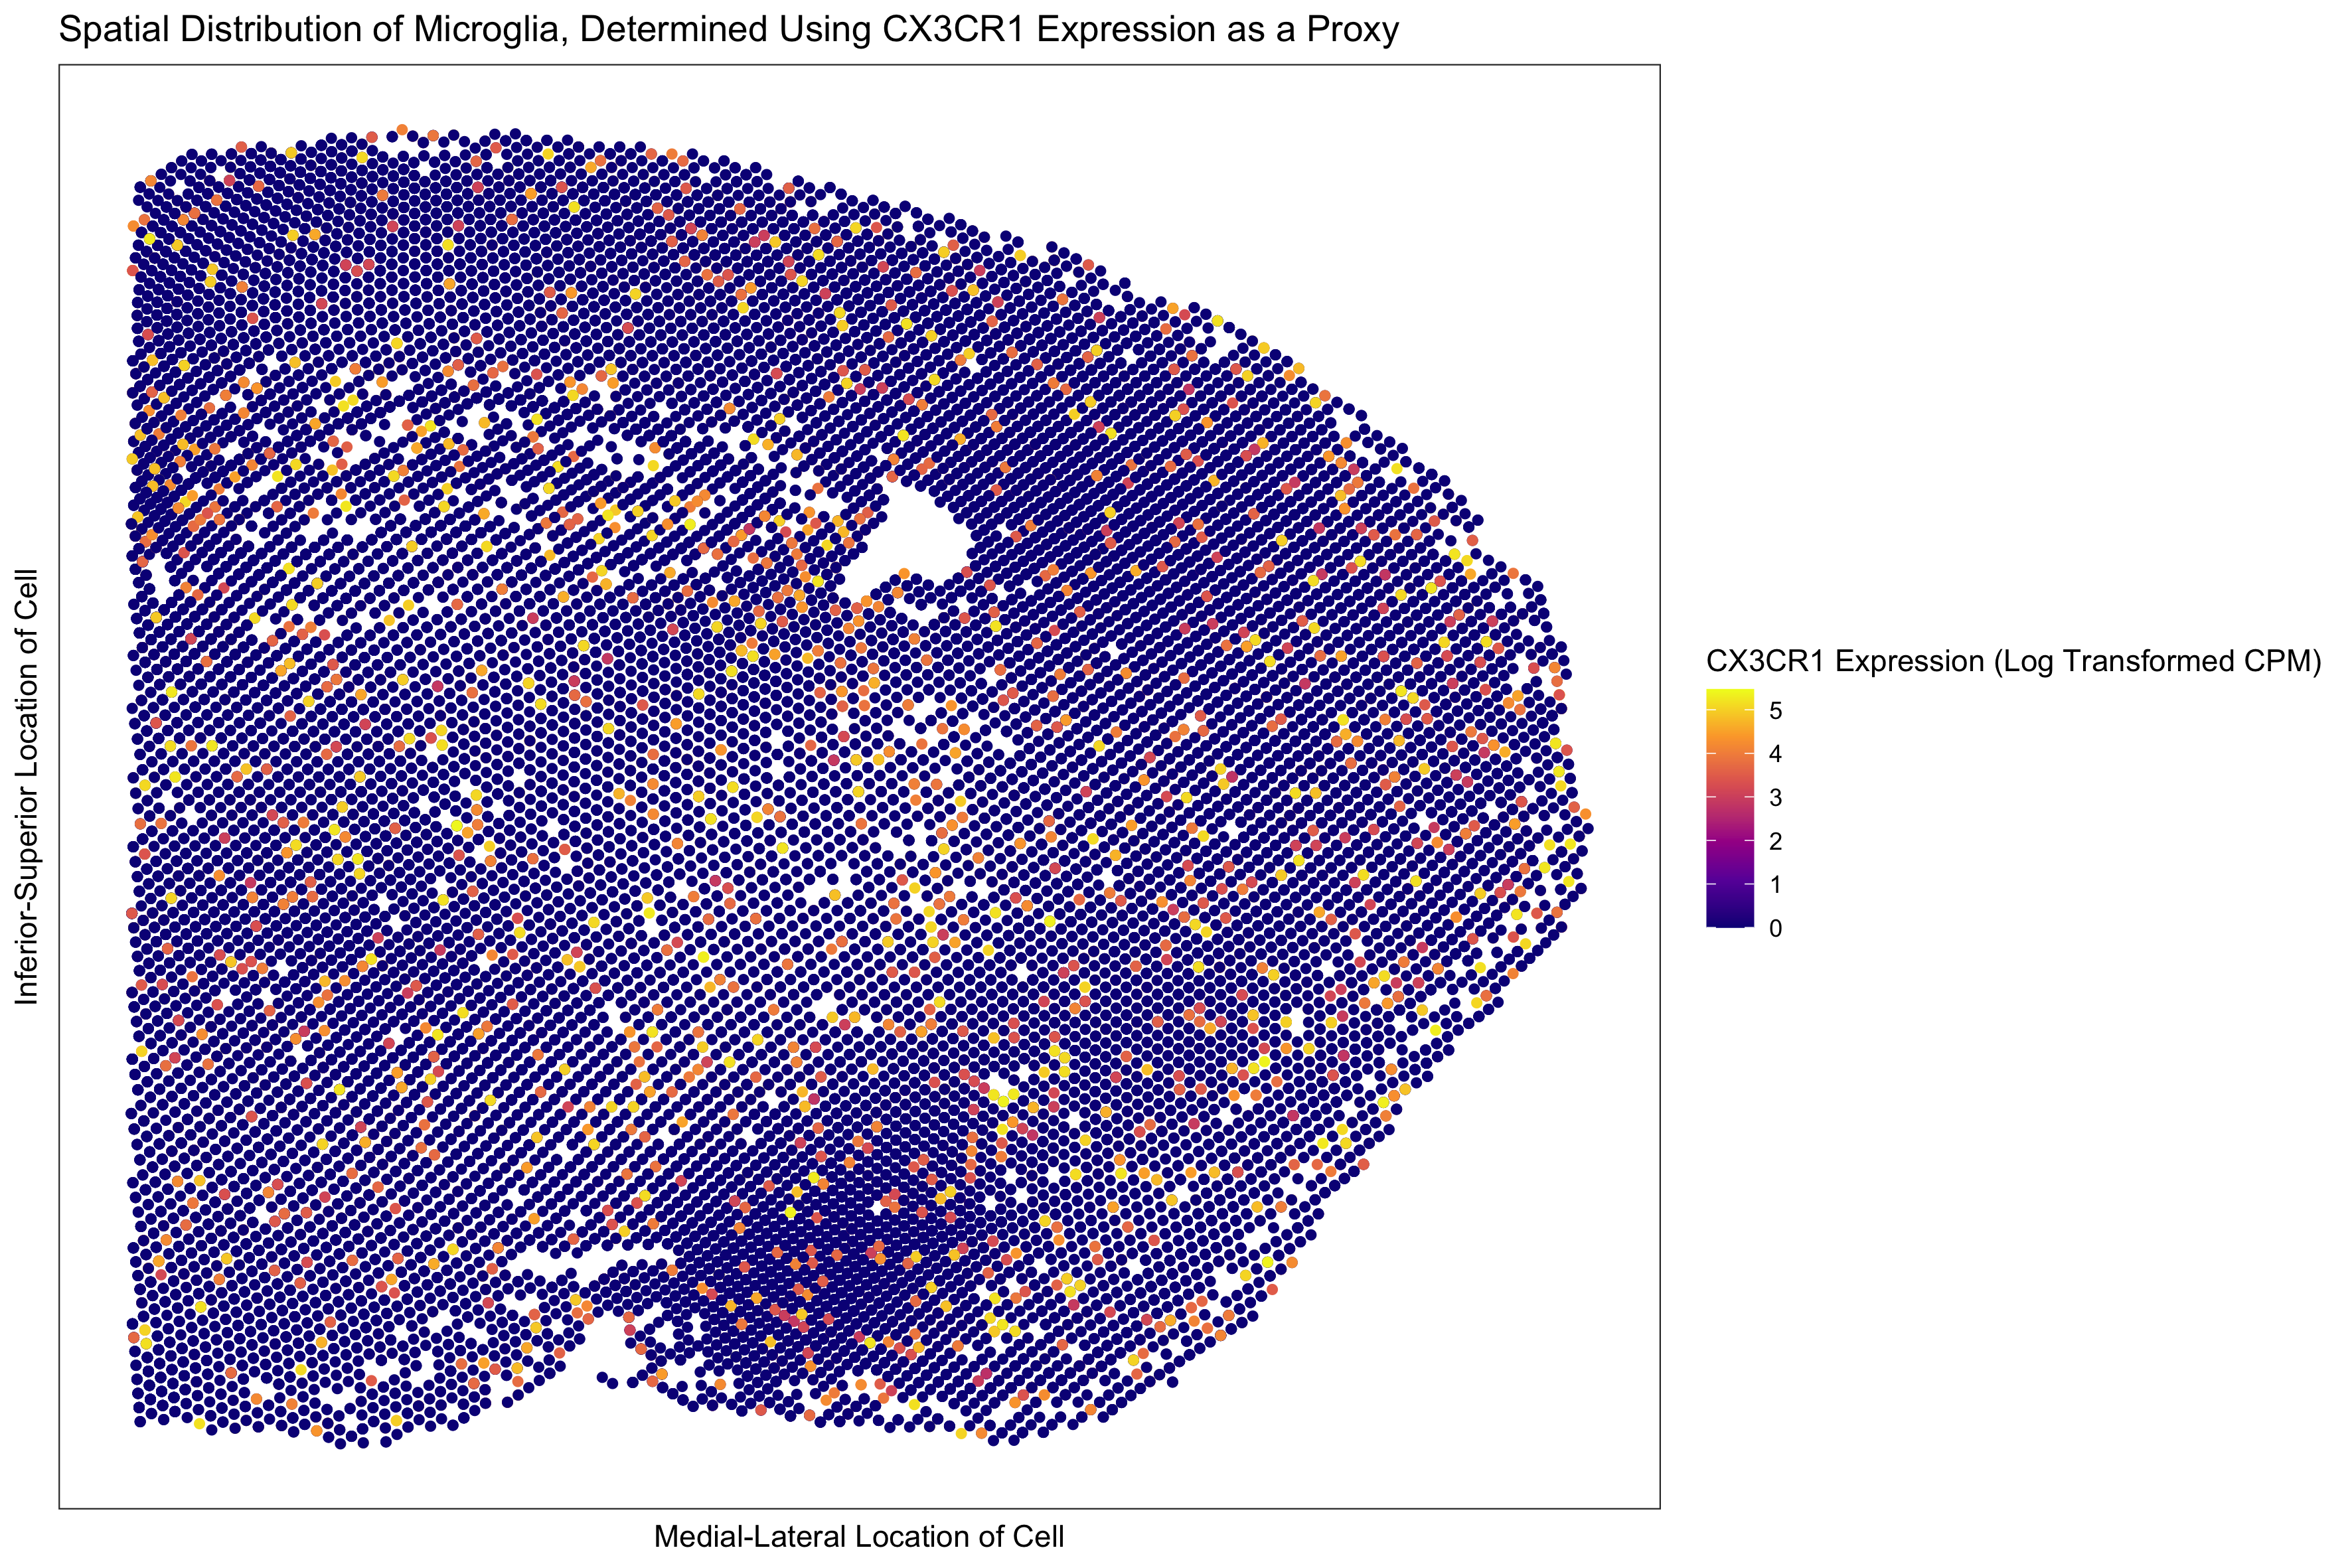
Spatial Distribution of Microglia, Determined Using CX3CR1 Expression as a Proxy
For homework 1, I chose to visualize quantitative data regarding the levels of expression of CX3CR1 (a marker whose expression I am using as a...
All Visualizations
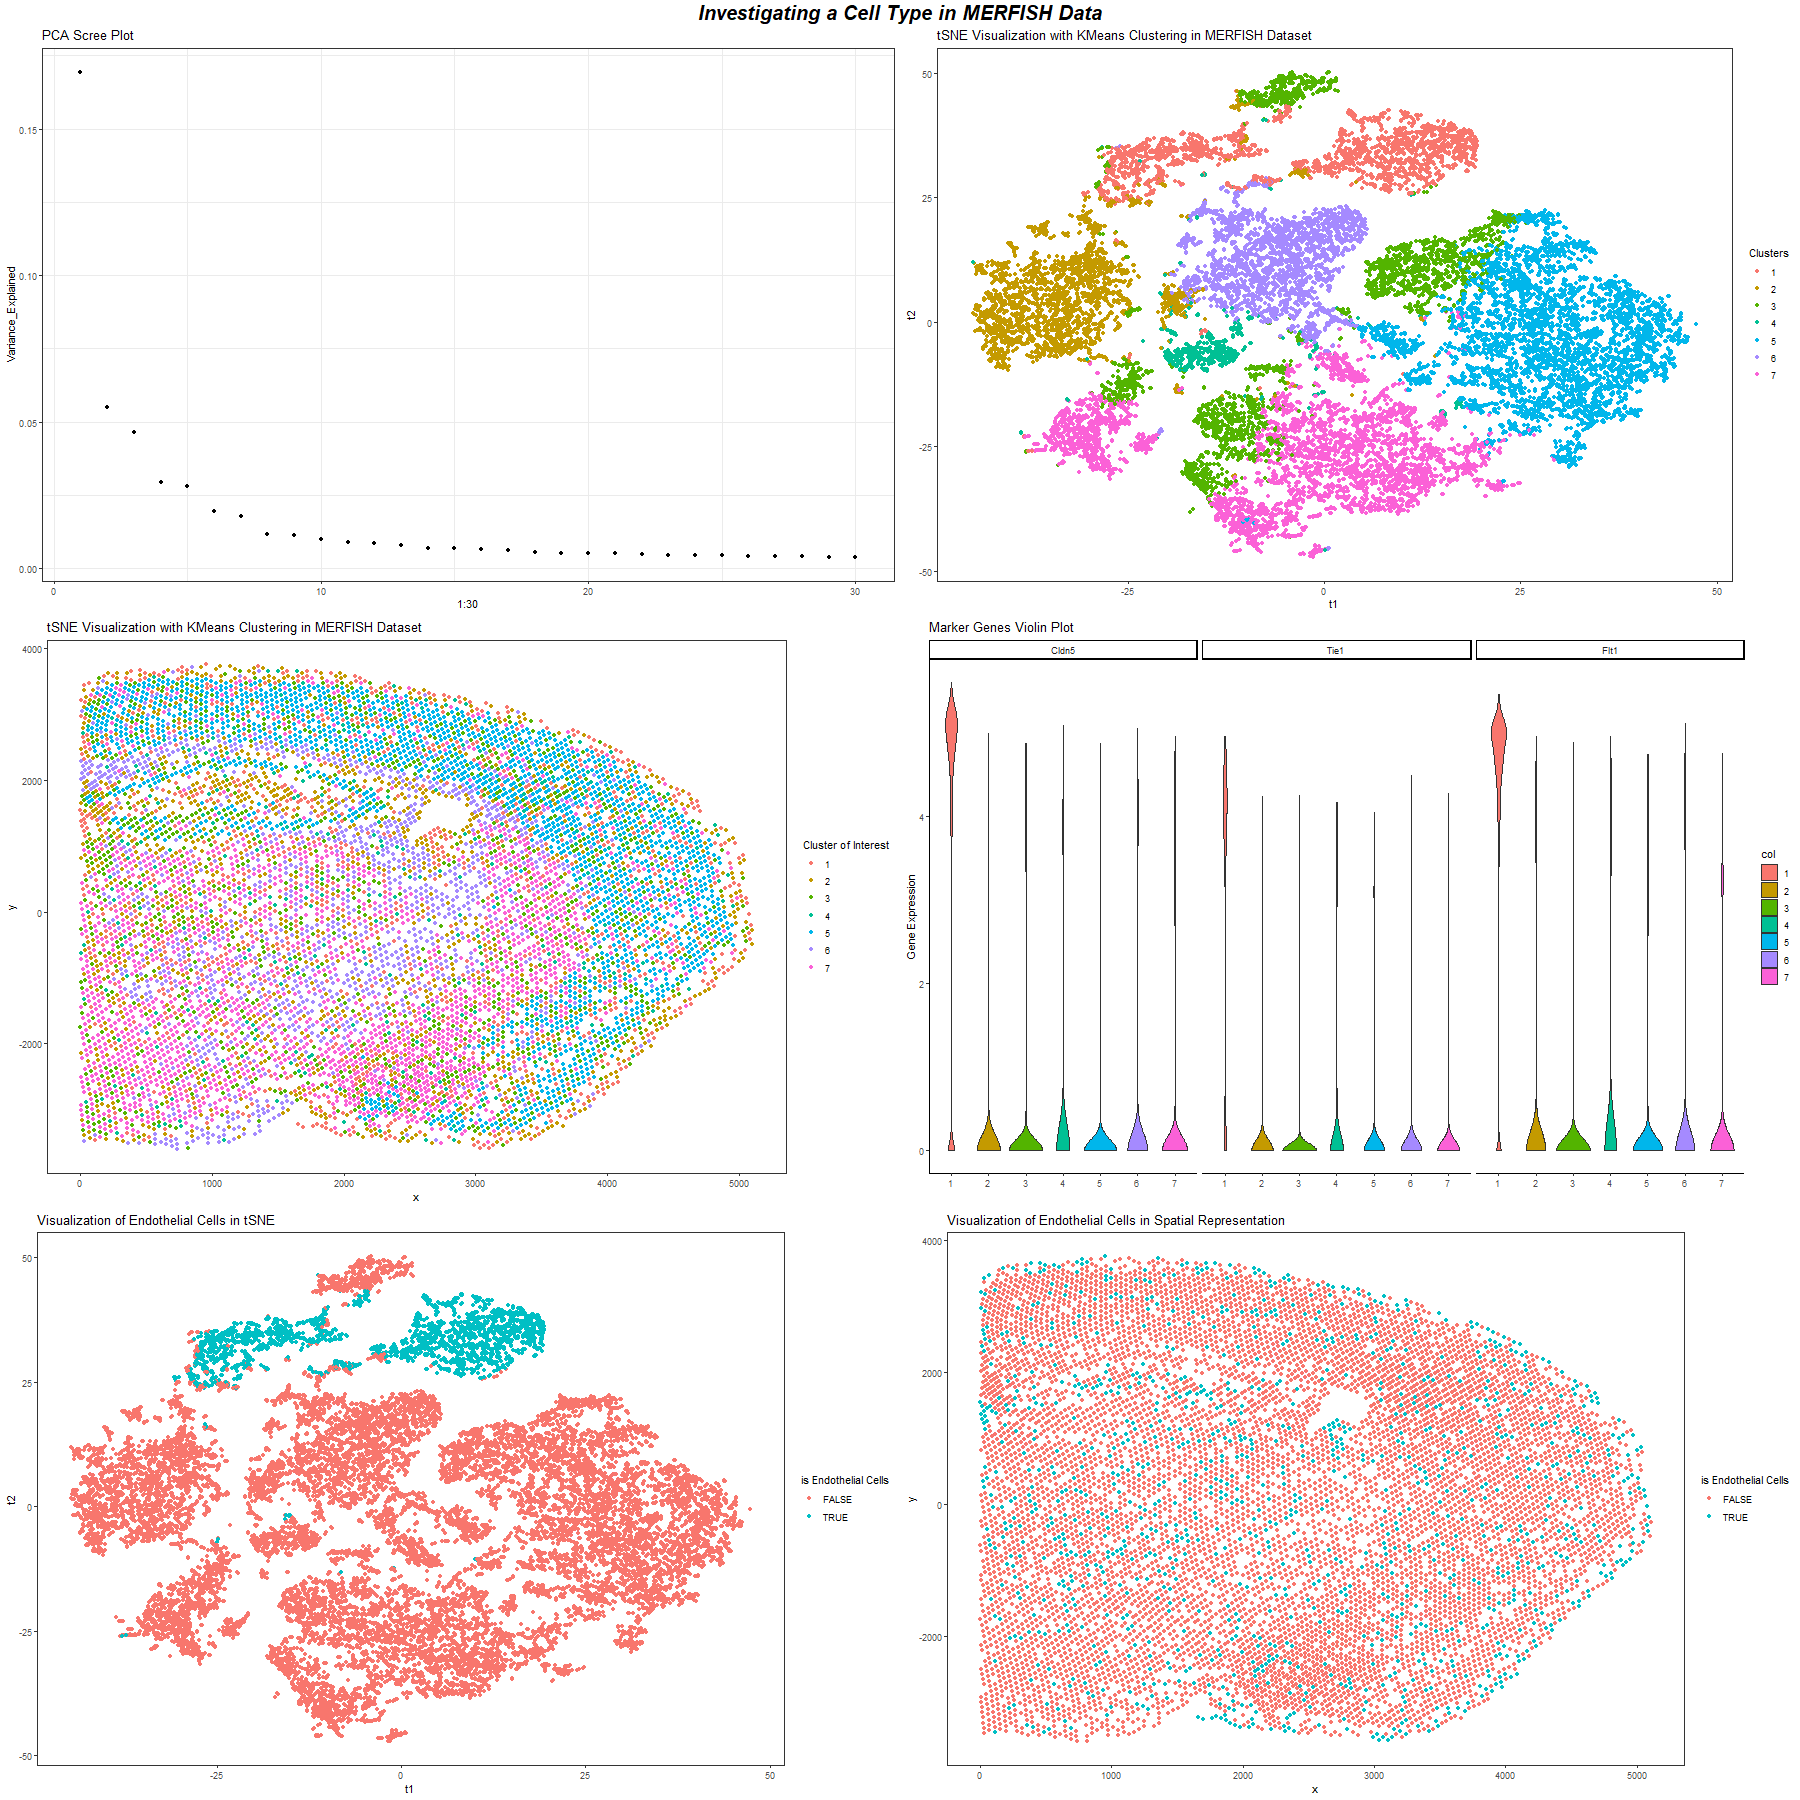
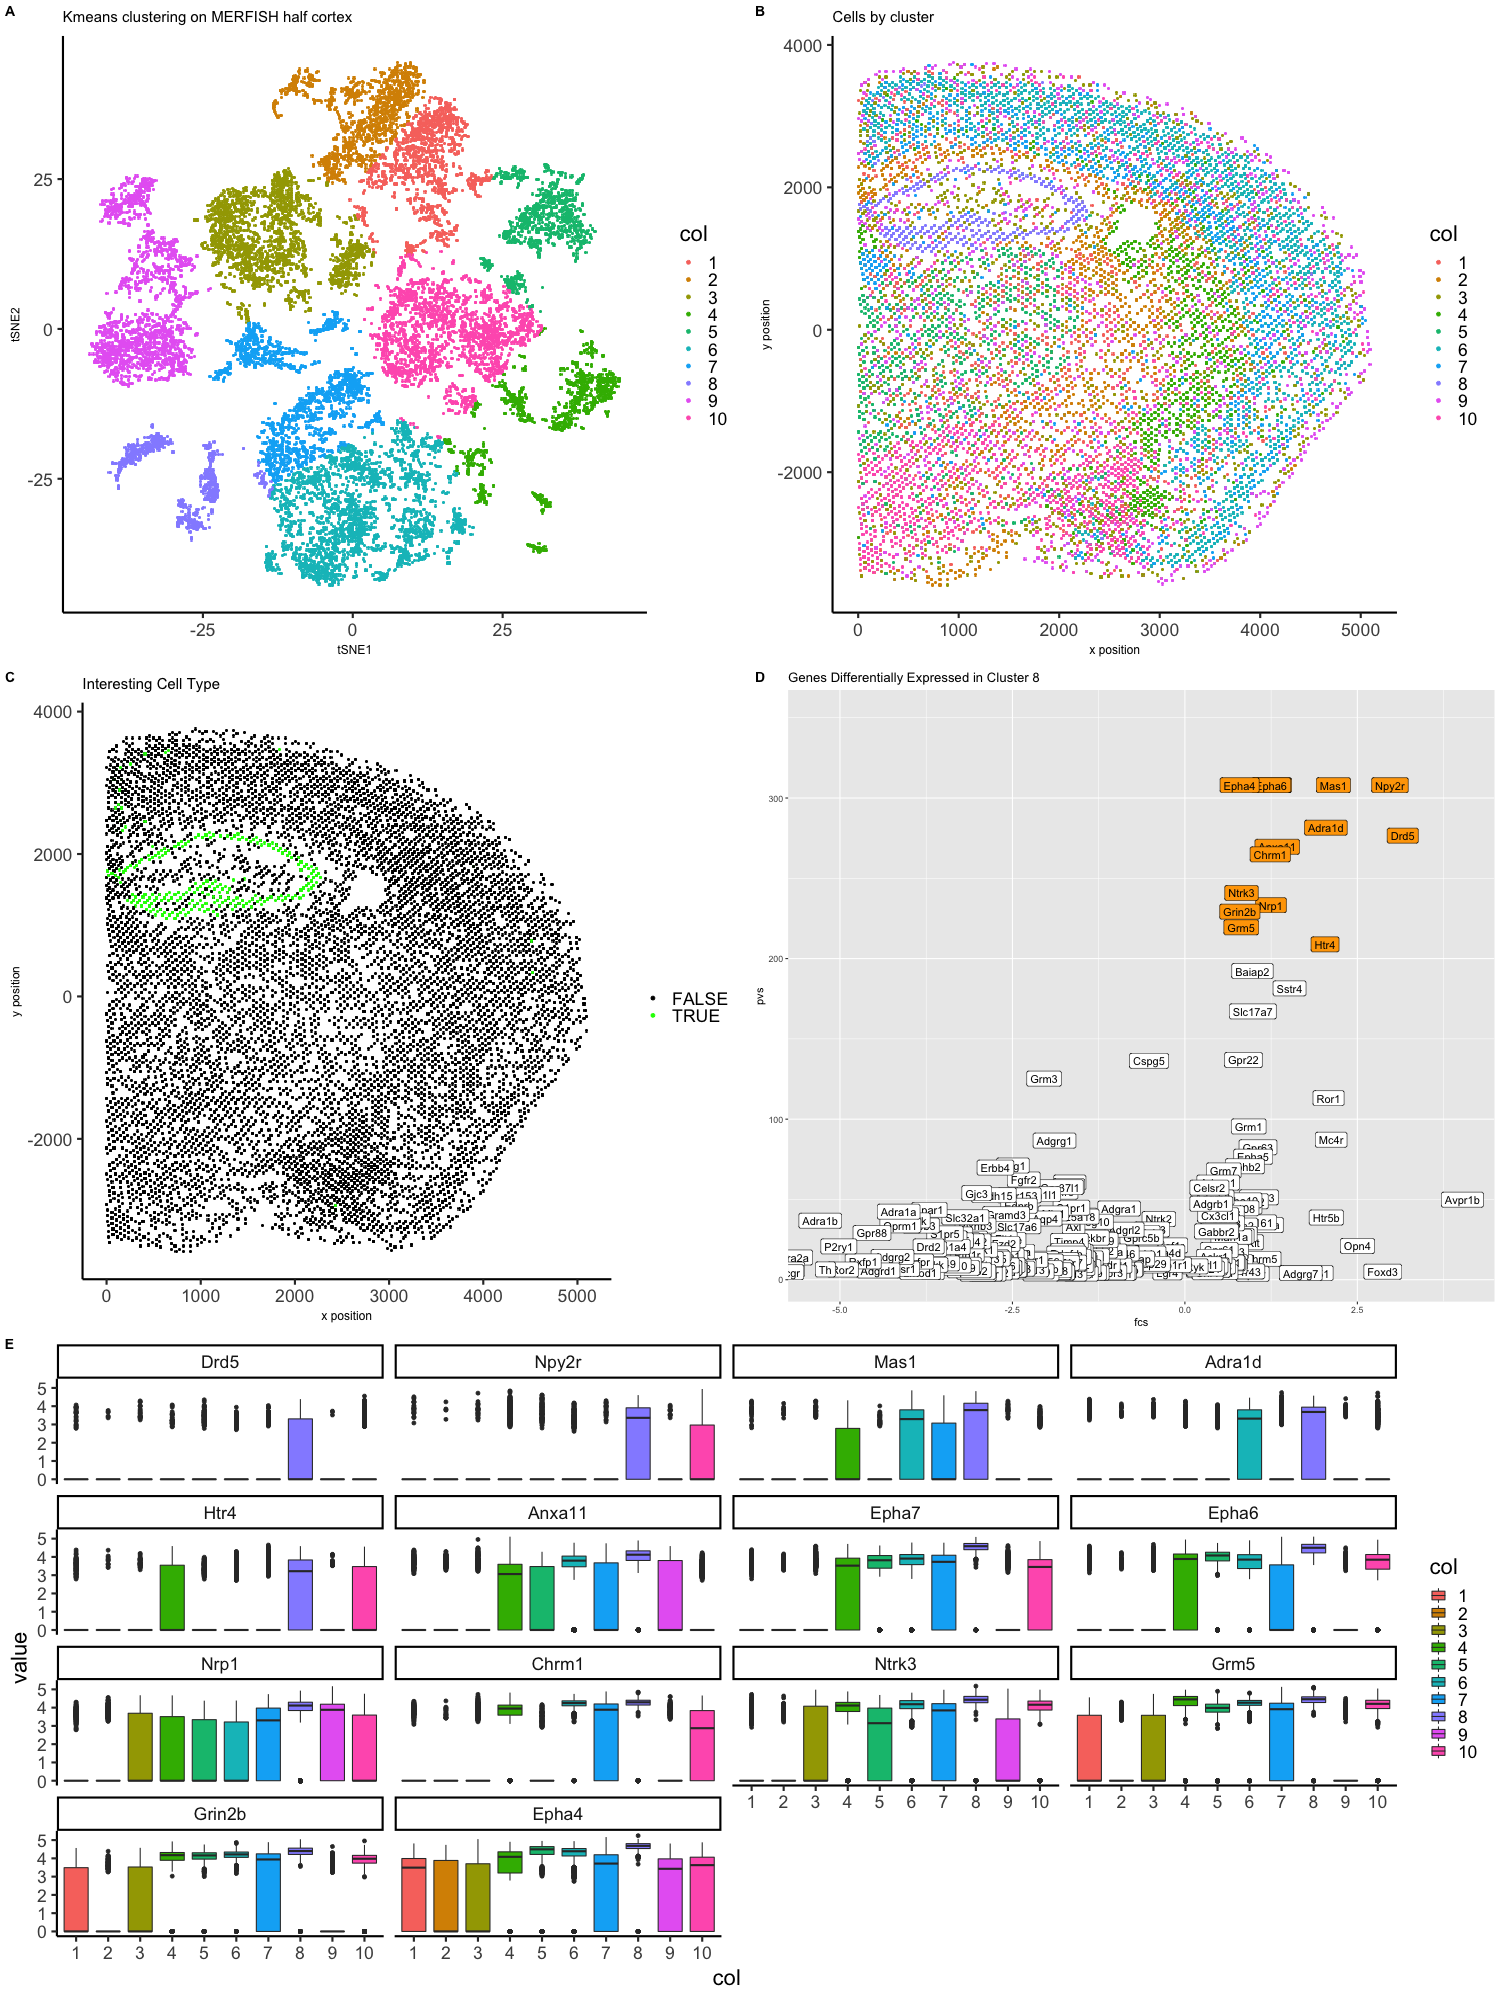
Investigating a Cell Type in MERFISH Dataset
We are given a spatial gene expression dataset with MERFISH technology. We will cluster the cells and try to identify a group of cells to understand their cell type based...
EC Yash Sonthalia
library(tidyverse) merfish=read.csv(‘/Users/yashsonthalia/Documents/JHUCourses/Spring2022/gdv_yash/data/MERFISH_Slice2Replicate2_halfcortex.csv.gz’) rownames(merfish)=merfish$X merfish$X=NULL x_coord=merfish$x y_coord=merfish$y merfish$x=NULL merfish$y=NULL
Identifying Interesting Cells By Spatial Transcriptomics
Expression of 483 genes has been measured in 42519 cells in a segment of brain tissue via MERFISH. Each cell position in the tissue sample has also been recorded. Fluorescence...
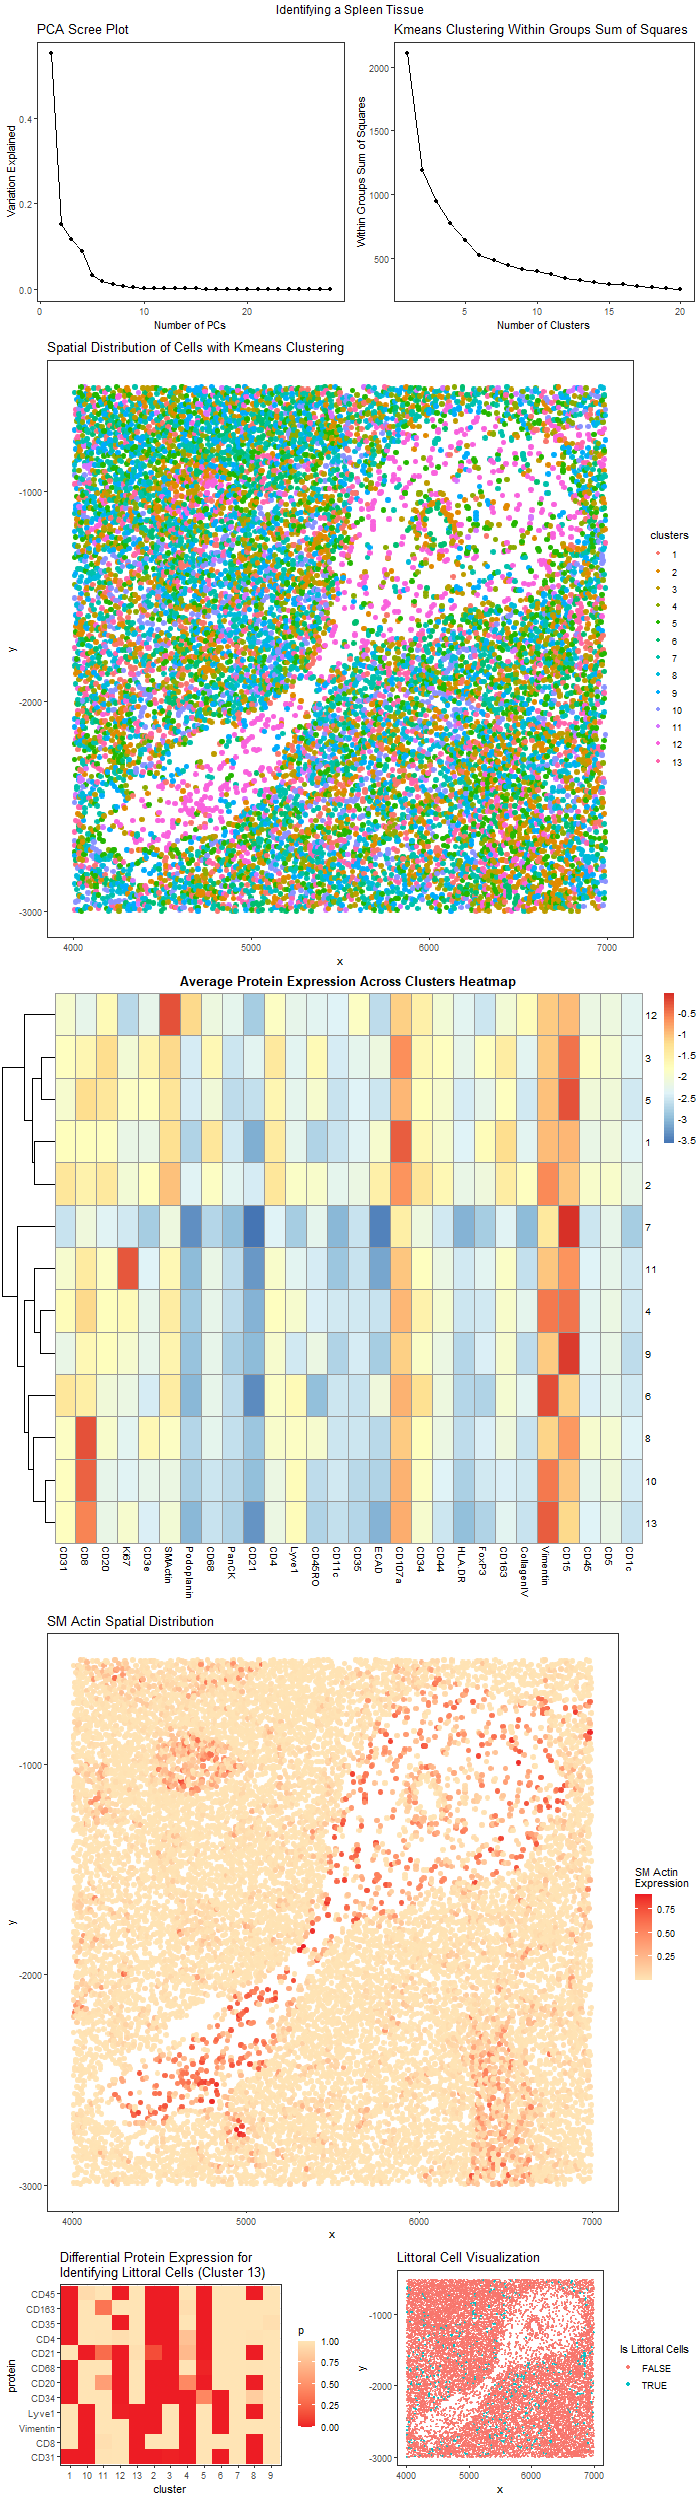
Visualization of a Spleen Tissue and is Identification
We are given a spatial protein expression dataset identify its originality. The figures shown above should be labeled A to G from left to right and from top to bottom....
Identifying Splenic Tissue By Spatial Proteomics
Expression of 28 proteins has been measured in 11512 spleen cells by fluorescence intensity. Each cell area and position in the tissue sample has also been recorded. Fluorescence intensity has...

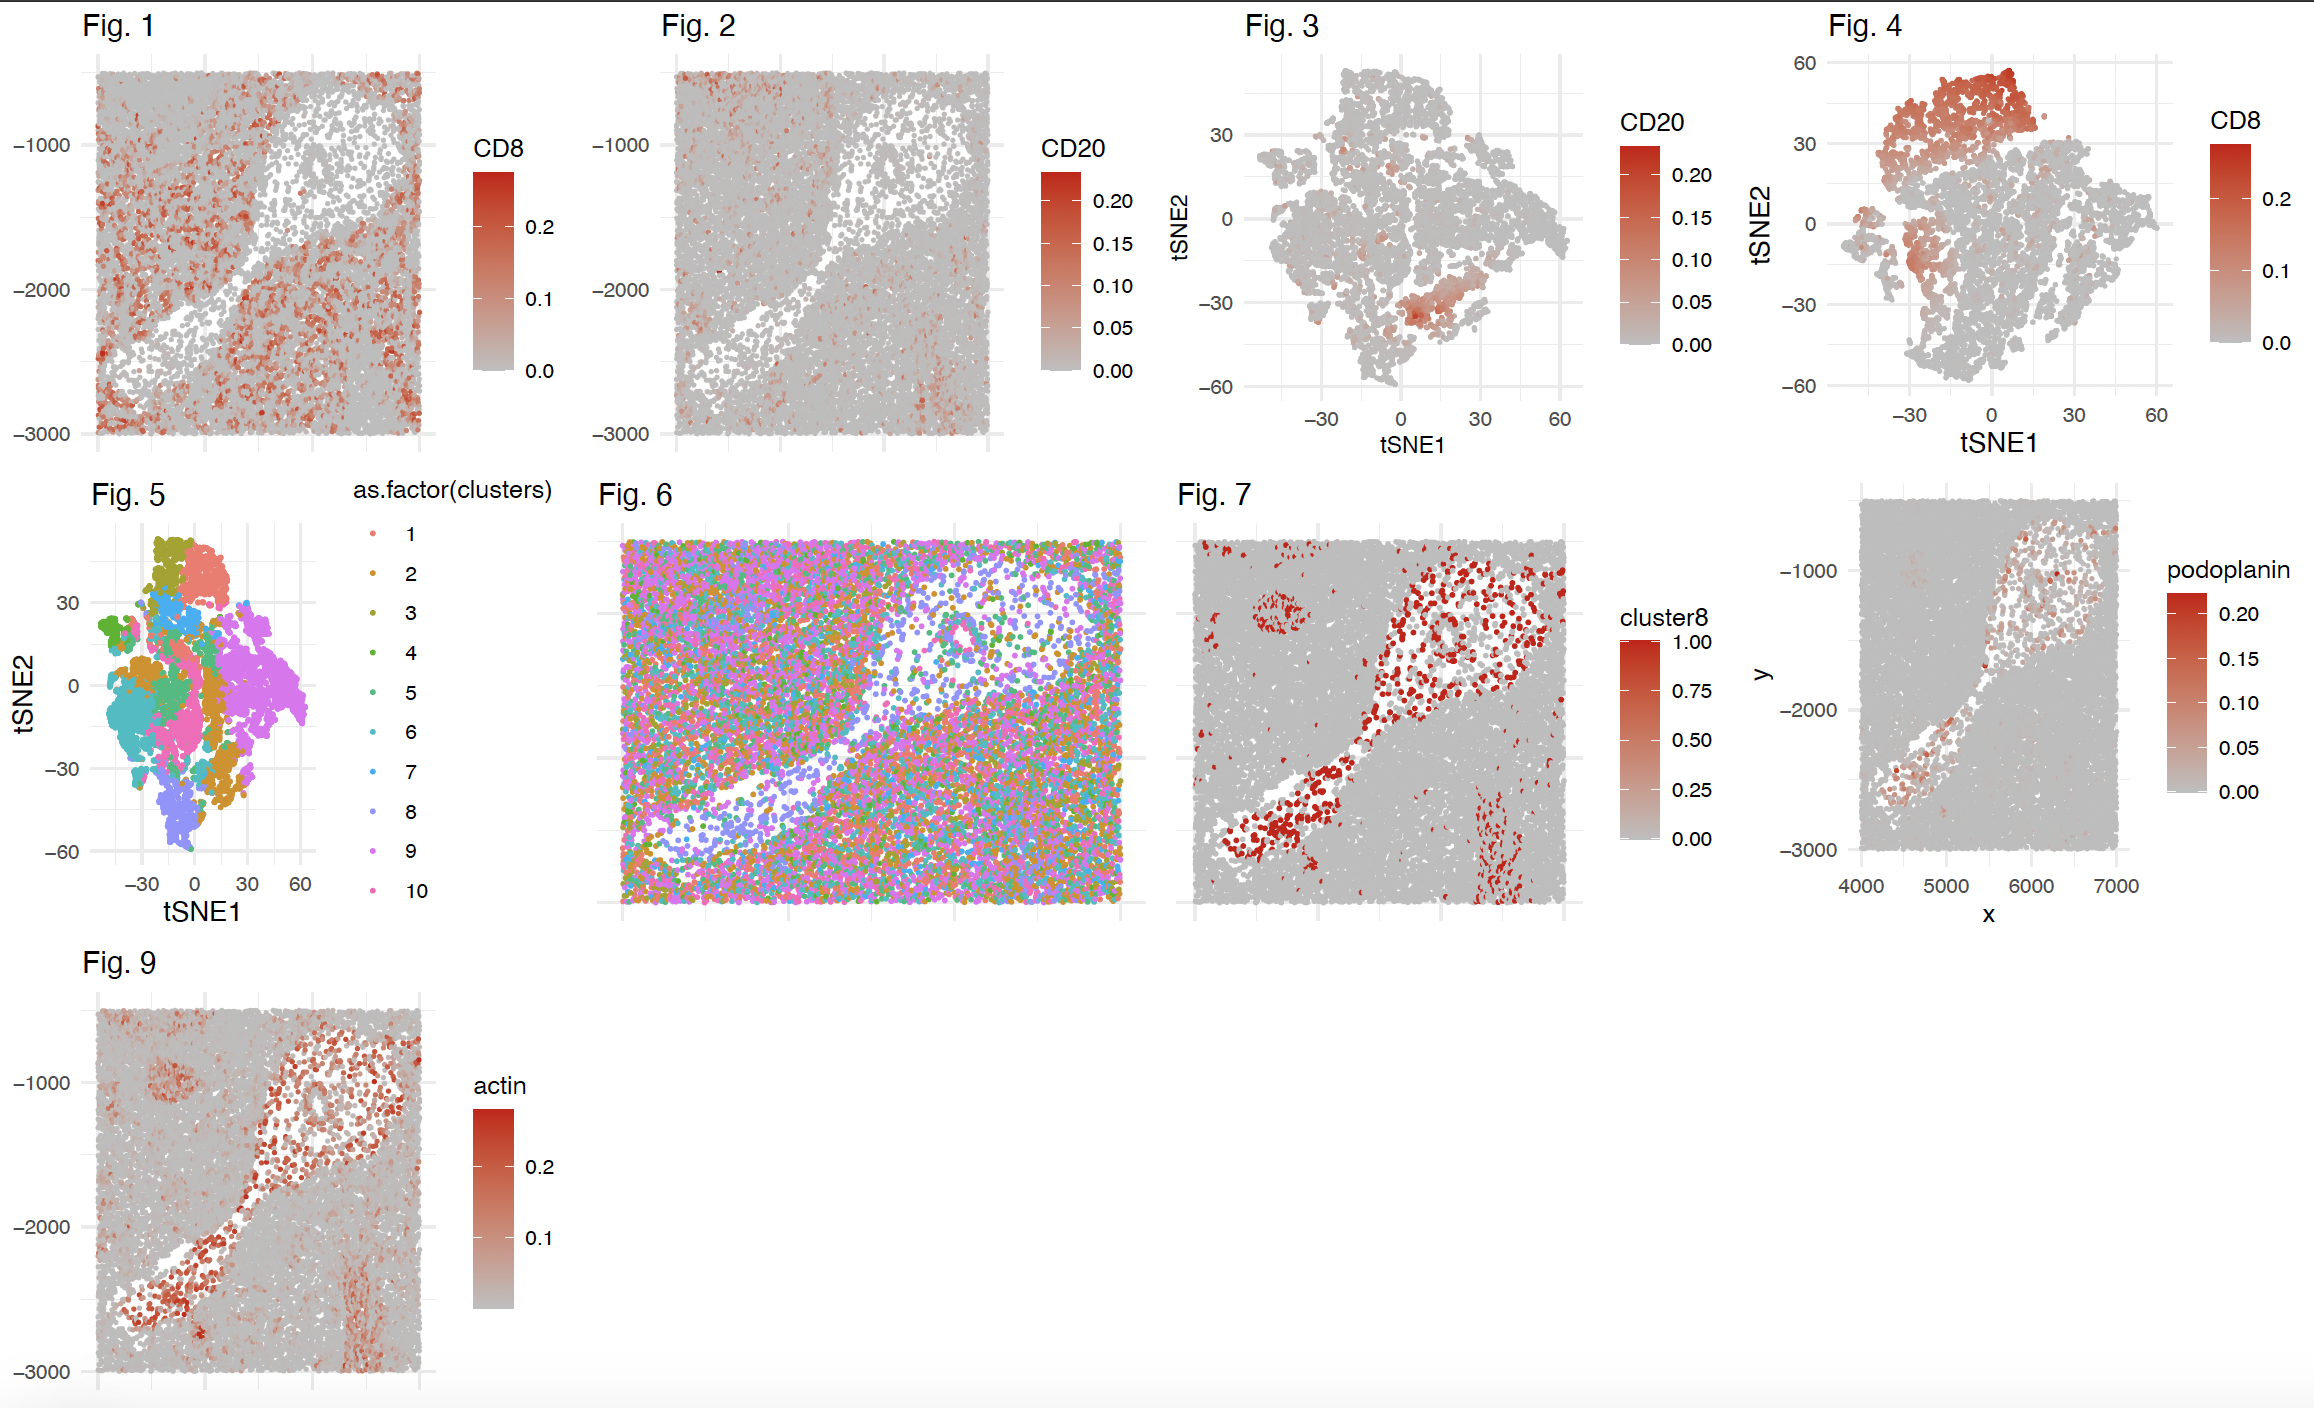
Deciphering the Identity of a Biological Structure Using Proteomics Data
In Figure 1, I chose to visualize quantitative positional data regarding the spatial organization of cells within the proteomics data set. I used the geometric primitive of points to represent...
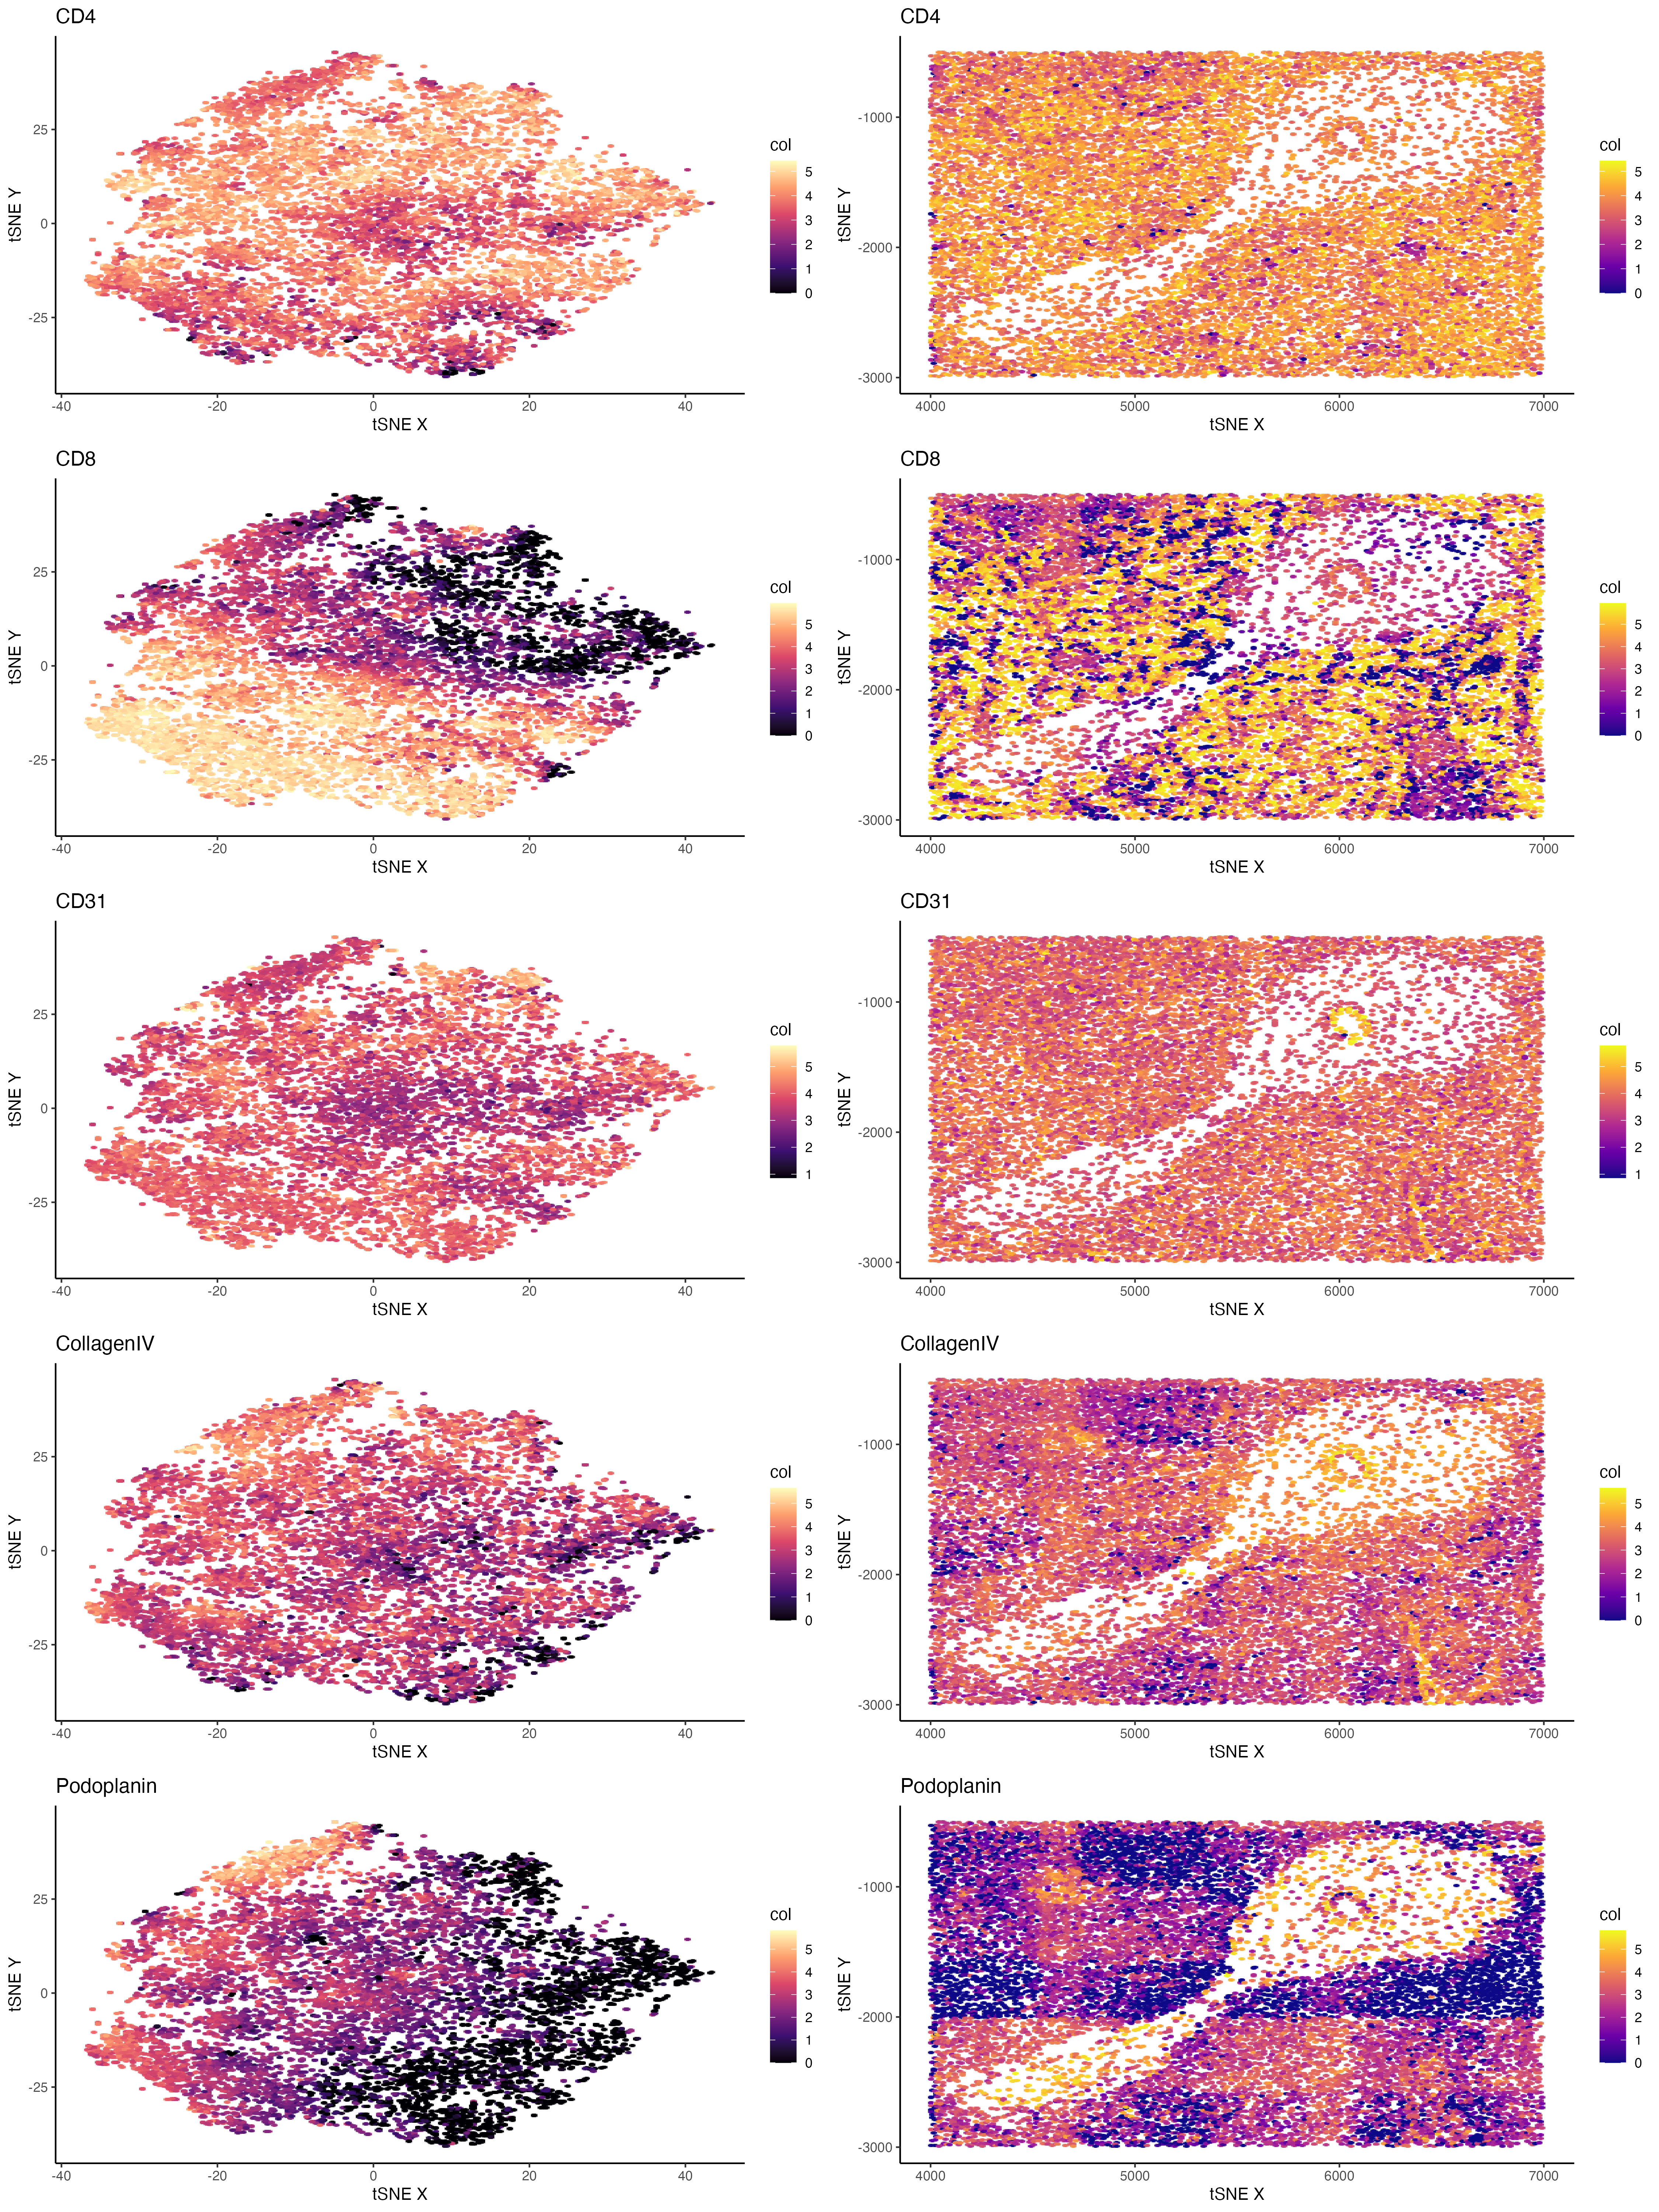
Analyze the CODEX dataset
I tried to plot the protein expression in clusters and spatial organizations side by side for better comparison. I noticed a large proportion of genes sequenced are immune cell marker...
Identifying the Cell-type of a Random Cell Cluster
In Figure 1, I have plotted the spatial distribution of cells within our MERFISH data set, after down-sampling the data. I used the geometric primitive of points to represent single...
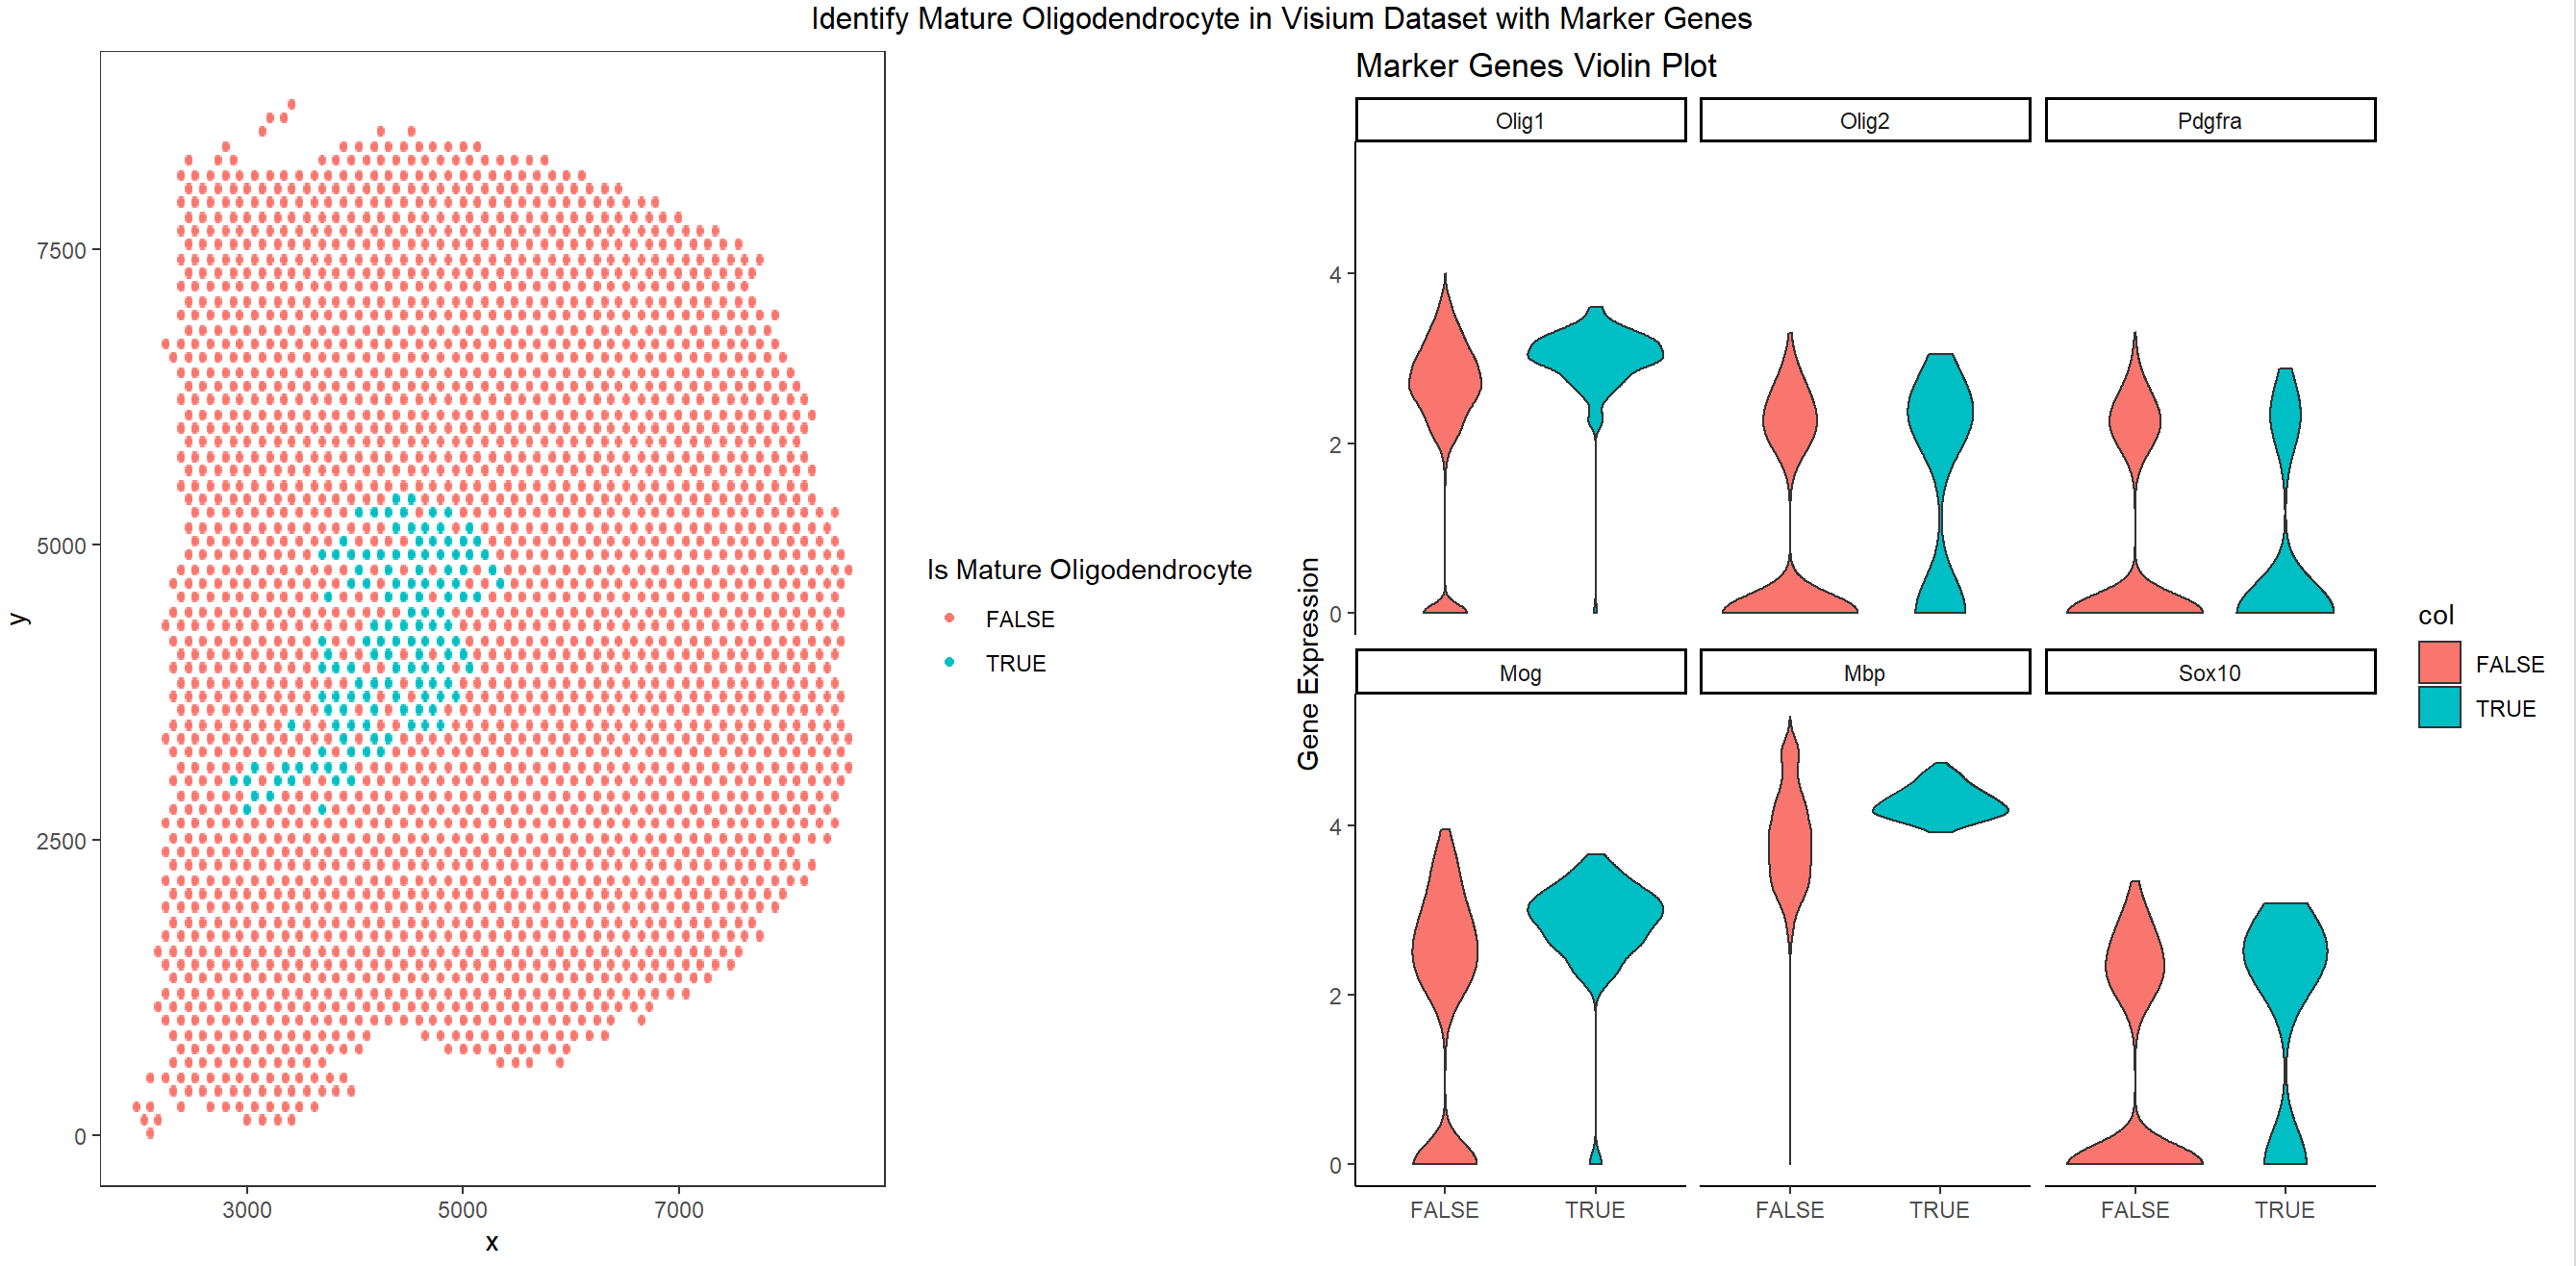
Visualization of Spatial Distribution of Mature Oligodendrocyte with Marker Genes
This code tries to find optimal k that clusters the gene so that one cluster has differential expression of marker gene. We need Oligo1, and Oligo2 to be highly expressed,...
Homework 4 Yash Sonthalia
Figure schema as follows: A) Top left B) Top right C) Bottom left D) Bottom right