Spatial distribution of expression of Ptpn4 in Visium dataset

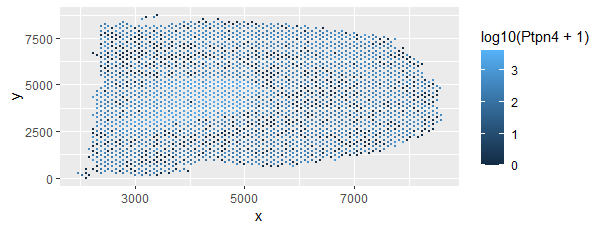
I am visualizing quantitative data of spatial distribution of the expression level of the Ptpn4 gene in the Visium dataset.
I am using the geometric primitive of points to encode the information of the points.
I am using the visual channel of position on the x axis to encode the x coordinate of the particular location variable.
I am using the visual channel of position on the y axis to encode the y coordinate of the particular location variable.
I am also using the visual channel of hue to encode the data of expression of the Ptpn4 gene quantified as log10(value + 1)
THis visualization would provid information on the spatial distribution of the expression of gene giving insights into the location it is being expressed in the brain.
# reading the data
data <- read.csv('~/../genomic-data-visualization/data/Visium_Cortex_varnorm.csv.gz')

# selecting the gene expression columns adn the position columns
gexp <- data[, 4:ncol(data)]
rownames(gexp) <- data[,1]
positions <- data[,c(2, 3)]

# normalizing the genes to counts per million
numgenes <- rowSums(gexp)
normgexp <- gexp/rowSums(gexp)*1e6

# binding the positions to normalized gene expression
df <- as.data.frame(cbind(positions, normgexp))

# plotting the spatial distribution of expression of gene Ptpn4
ggplot(df, aes(x, y, color = log10(Ptpn4 +1)))+
  geom_point(size = 0.5)