Homework 3 Yash Sonthalia

*I used some of Dr. Fan’s inclass plotting code as reference on running tSNE
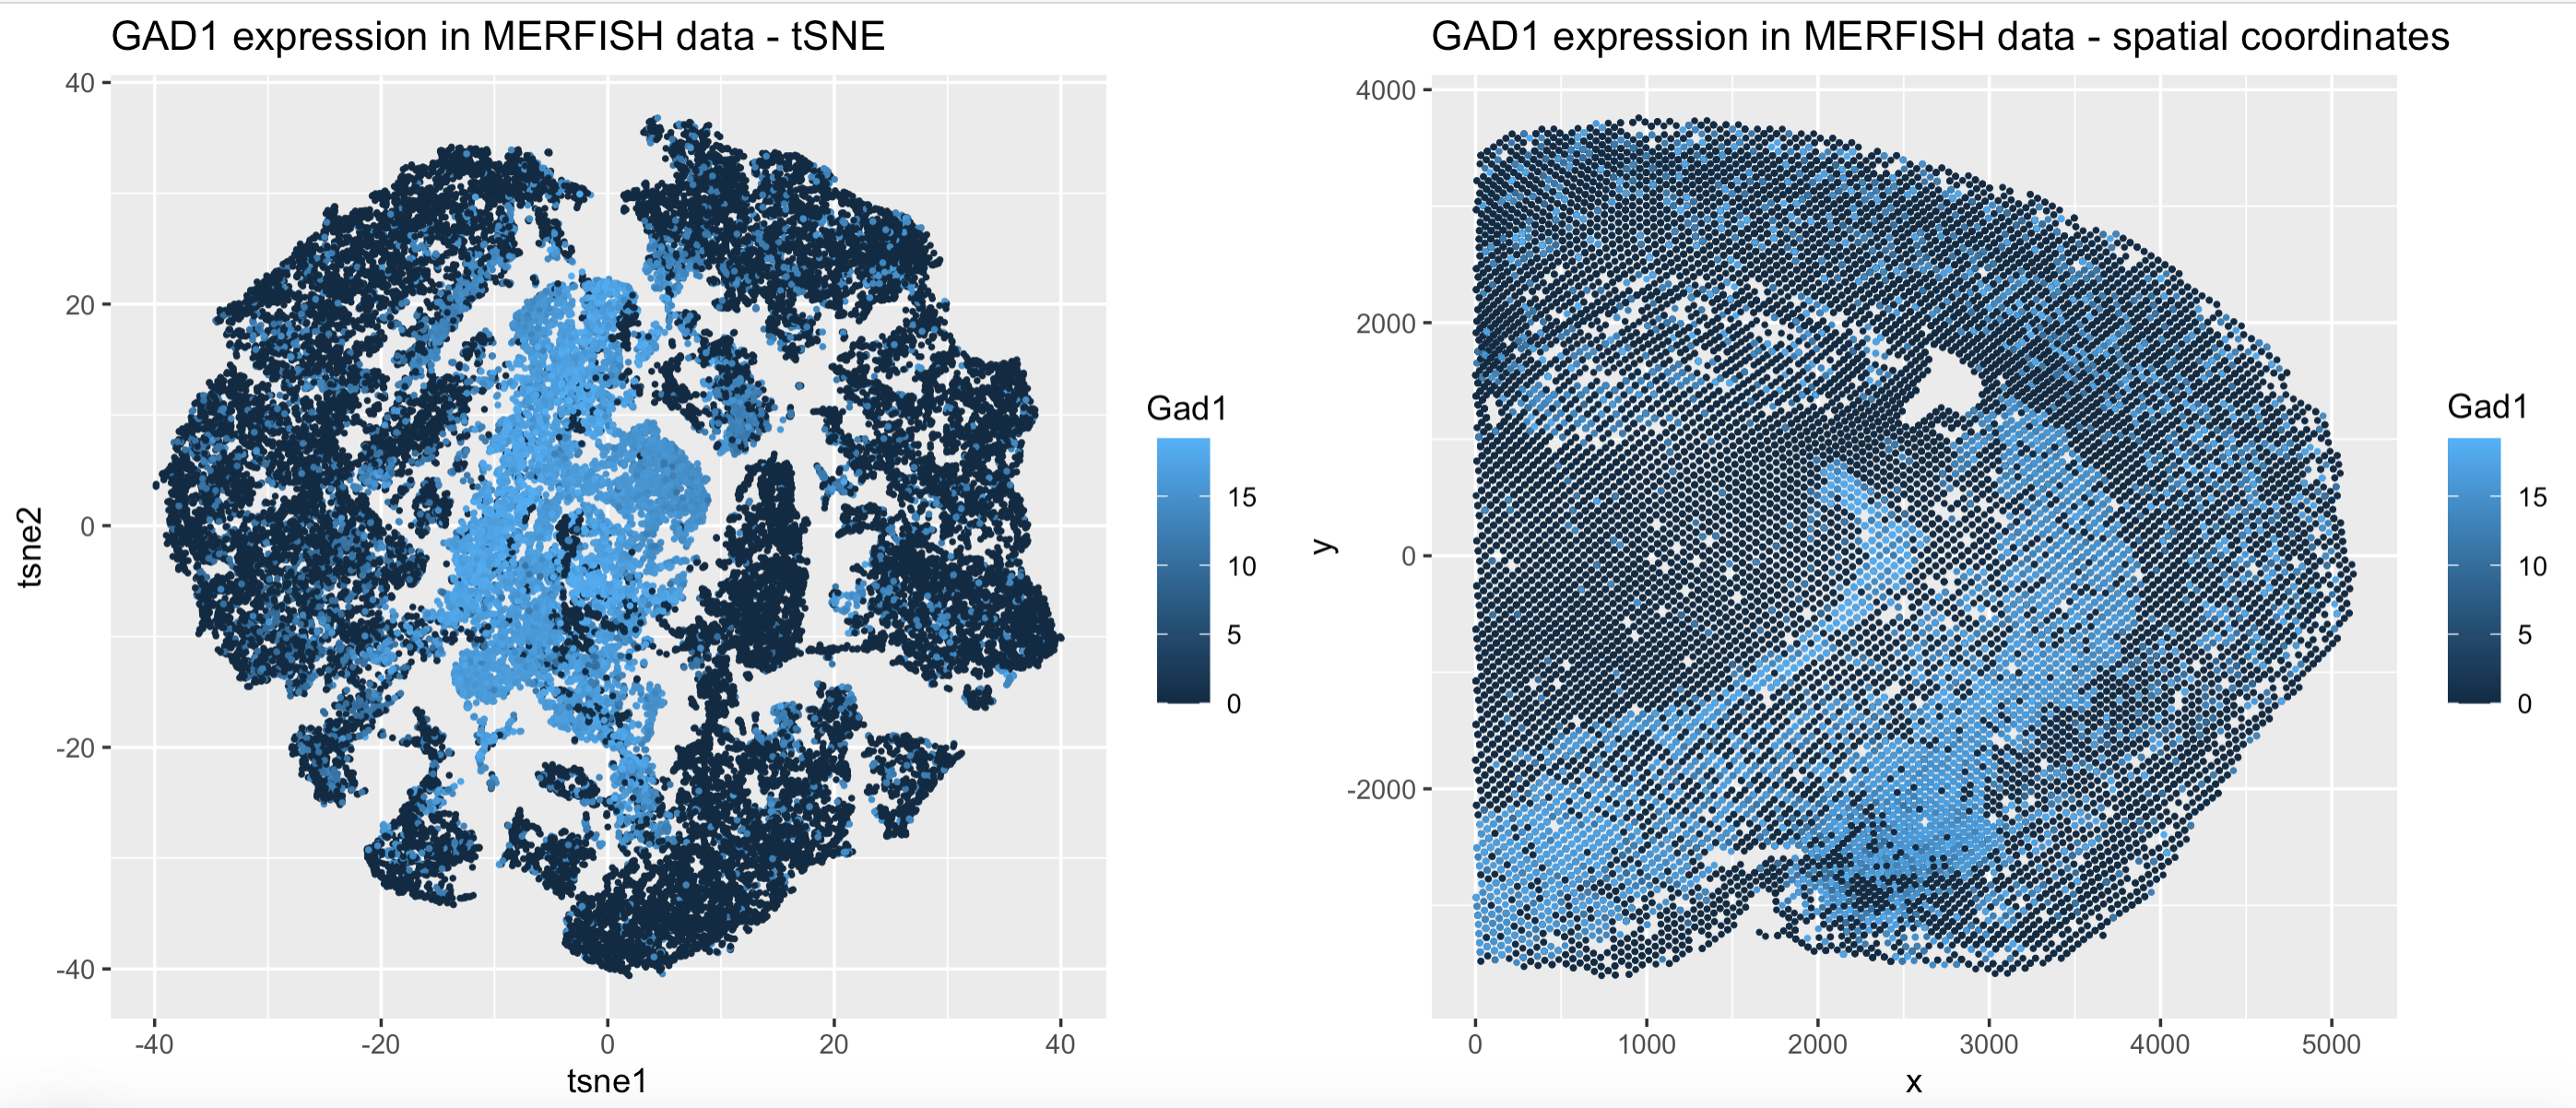
In the left panel, I am visualizing quantitative gene expression data from the brain generated using the MERFISH technology. To make this visual, I first ran PCA on the normalized gene expression matrix, and used the first 8 PC’S to further reduce the dimensions of the data using tSNE.
I am using points as the geometric primitive, which aggregate and form areas that are cell clusters. I am using the visual channel of HUE to encode the expression of GAD1 in the cells.
The gestalt principles I am applying to the left panel visualization is similarity, which is encoded by cell clusters on the tSNE plot. This further leads into the rationale behind this visualization, which was to show that GAD1 expressing cells are similar.
I am coloring the points by expression of GAD1. Here, I am trying to show that cells that express GAD1 are of a similar cell class, which is shown on the tSNE plot since there seems to be a unique cluster that expresses GAD1, and this is visible through the large light blue patch in the middle of the plot.
In the right panel, I am visualizing quantiative data of gene expression of GAD1 in a plot of our cells in spatial coordinates. I am using the geometric primitive of points to denote each cell. I am using the visual channel of HUE to encode GAD1 expression in the cells in spatial coordinates. I am again using the gestalt principle of similarity, as cells that express GAD1 are similar. Although in the tsne plot GAD1 cells mostly clustered together, I am showing in the right panel that they seem to be spatially ditributed in the brain. So although they are transcriptionally similar, they are distributed in the brain. The purpose for the right panel was to show the spatial distribution of GAD1 expressing cells, whereas the left panel shows that these cells are transcriptionally similar.
library(tidyverse)
library(gridExtra)
merfish=read.csv('/Users/yashsonthalia/Documents/JHUCourses/Spring2022/gdv_yash/data/MERFISH_Slice2Replicate2_halfcortex.csv.gz')
merfish=data.frame(merfish)
merfish_data=merfish[,4:486]

cell_counts=rowSums(merfish_data)
merfish_data_norm=log2(merfish_data/cell_counts*1e6+1)
merfish_data_norm$x=merfish$x
merfish_data_norm$y=merfish$y

gad1_spatial=ggplot(merfish_data_norm,aes(x,y))+geom_point(size=0.4,mapping=aes(color=Gad1))+ggtitle('GAD1 expression in MERFISH data - spatial coordinates')

merfish_data_norm=log2(merfish_data/cell_counts*1e6+1)

pca=prcomp(merfish_data_norm)
plot(pca$sdev[1:30], type="l")
#8 dimensions seems good

library(Rtsne)
embedding=Rtsne(pca$x[,1:8], dims=2, perplexity=30)$Y
colnames(embedding)=c('tsne1','tsne2')
embedding=data.frame(x = embedding[,1],
                 y = embedding[,2],
                 col = merfish_data_norm[,'Gad1'])
tsne_gad1=ggplot(data = embedding,
       mapping = aes(x = x, y = y)) +
  geom_point(size=0.4,aes(col=col))+xlab('tsne1')+ylab('tsne2')+ggtitle('GAD1 expression in MERFISH data - tSNE')
grid.arrange(tsne_gad1,gad1_spatial, ncol=2)