Homework 4 Yash Sonthalia

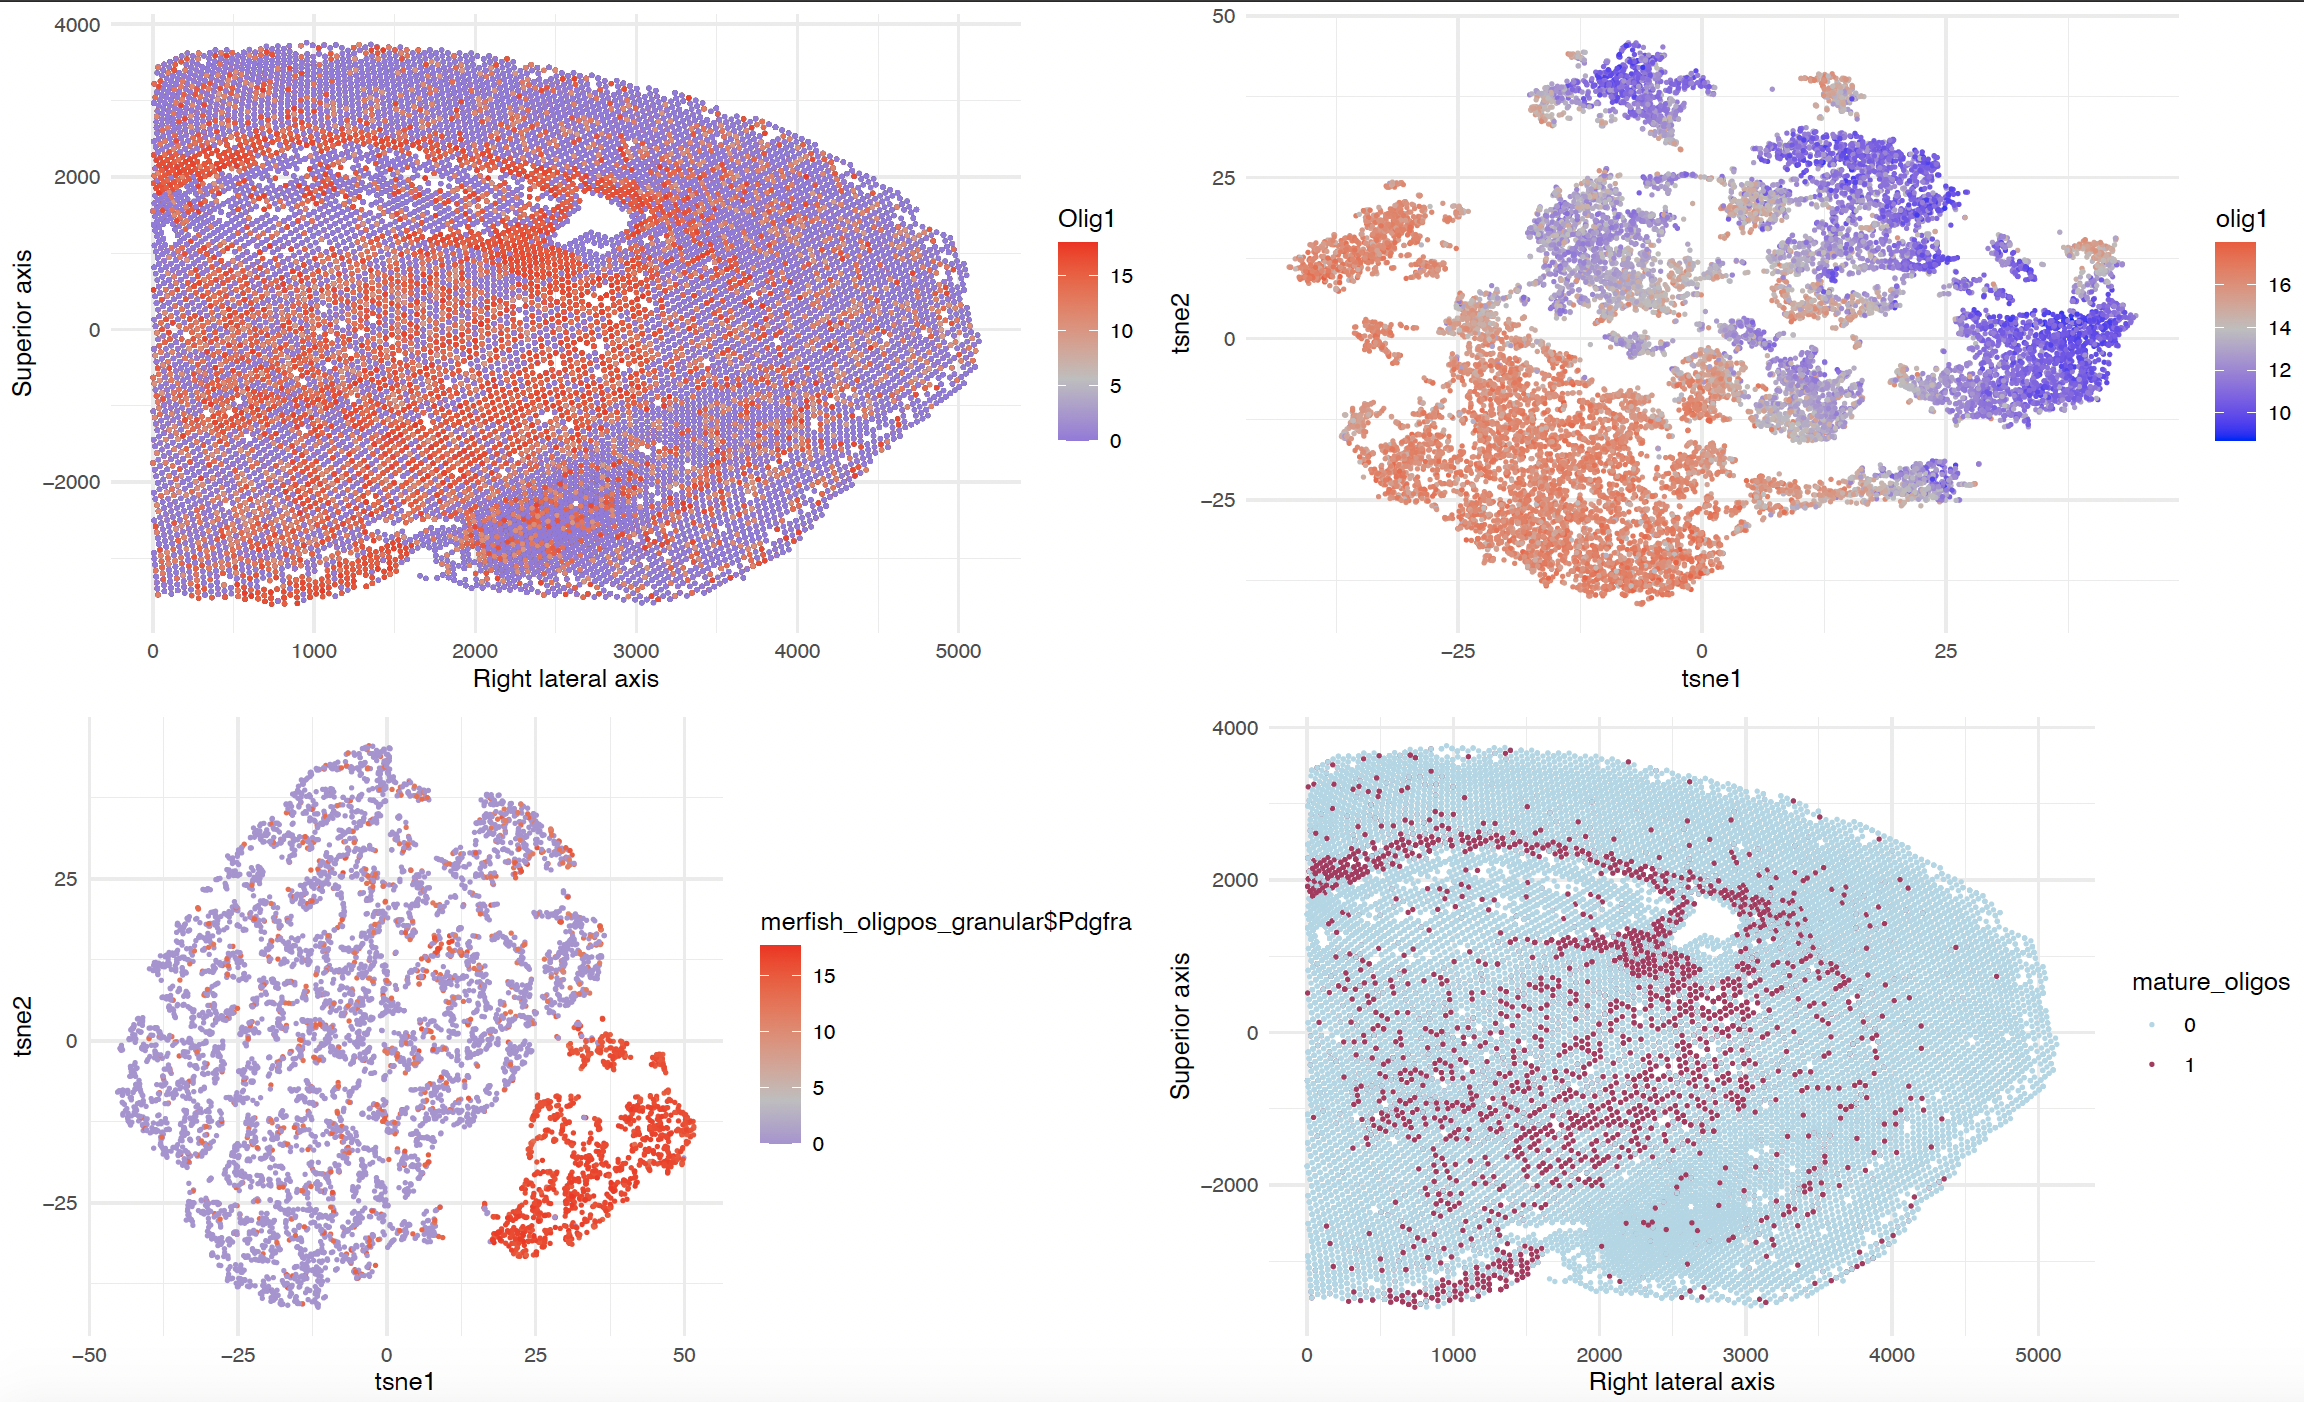
Figure schema as follows: A) Top left B) Top right C) Bottom left D) Bottom right
A) Spatial plot of MERFISH data of Coronal Section of Mouse Brain colored by normalized Olig1 expression. Olig1 expression is highlighted to indicate spatial locations of Oligodendrocytes.
B) t-Stochastic Neighbor Embedding (tSNE) plot on cells with non-zero Olig1 expression.
C) tSNE plot on clusters of cells in B that are relatively higher in Olig1 expression determined by k-means clustering (not shown). Colored by normalized Pdgfra expression level. Cells with nonzero expressin of Pdgfra may be mature oligodendrocytes.
D) Spatial plot of Mature oligodendrocytes as identified by cells with zero expression of Pdgfra in Figure C.
```{r setup, include=FALSE} #working directory is just the genomic_data_visualization directory
#I’m going to comment my strategy
library(tidyverse) library(gridExtra)
#I’m using merfish because I’m unsure how oligo’s #are distributed in the brain. i want to try #with visium too since I haven’t used it much #but will see if visium would makes sense #for this analysis
#setting seed as we have some stochastic algorithms set.seed(0)
merfish=read.csv(‘/Users/yashsonthalia/Documents/JHUCourses/Spring2022/gdv_yash/data/MERFISH_Slice2Replicate2_halfcortex.csv.gz’)
merfish=data.frame(merfish) merfish_data=merfish[,4:486]
#cpm and log normalize expression data cell_counts=rowSums(merfish_data) merfish_data_norm=log2(merfish_data/cell_counts*1e6+1) merfish_data_norm_spatial=merfish_data_norm merfish_data_norm_spatial$x=merfish$x merfish_data_norm_spatial$y=merfish$y
#plotting spatial distribution of several canonical oligodendrocyte markers. was making a function for this but there was constantly an error so I am just doing it brute force olig1=ggplot(merfish_data_norm_spatial,aes(x,y))+geom_point(size=0.4)+geom_point(size=0.4,mapping=aes(color=Olig1))+xlab(‘Right lateral axis’)+ylab(‘Superior axis’)+theme_minimal()+ scale_color_gradient2(midpoint=mean(merfish_data_norm$Olig1),low=”blue”, mid=”grey”,high=”red”)
pdgfra=ggplot(merfish_data_norm_spatial,aes(x,y))+geom_point(size=0.4)+geom_point(size=0.4,mapping=aes(color=Pdgfra))+xlab(‘Right lateral axis’)+ylab(‘Superior axis’)+theme_minimal()+ scale_color_gradient2(midpoint=mean(merfish_data_norm$Pdgfra),low=”blue”, mid=”grey”,high=”red”)
#i chose these two because olig1 was in the merfish dataset and i wanted to see if pdgfra was also similarly distributed expressed in the mouse brain. they both are somewhat densely expressed in the brain, so I will stick with merfish :(
#initially will do PCA only on cells that are positive for olig1, and then k-means cluster in PC space merfish_data_norm_olig1pos=merfish_data_norm[merfish_data_norm$Olig1>0,] pca=prcomp(merfish_data_norm_olig1pos) #will keep 8 dimensions for tsne, as determined in last HW! #might revisit this later
library(Rtsne)
embedding=Rtsne(pca$x[,1:8], dims=2, perplexity=50)$Y colnames(embedding)=c(‘tsne1’,’tsne2’)
embedding=data.frame(x = embedding[,1], y = embedding[,2], olig1 = merfish_data_norm_olig1pos[,’Olig1’])
tsne_olig1_initial=ggplot(data = embedding, mapping = aes(x = x, y = y)) + geom_point(size=0.4,aes(col=olig1))+xlab(‘tsne1’)+ylab(‘tsne2’)+theme_minimal()+ scale_color_gradient2(midpoint=mean(merfish_data_norm_olig1pos$Olig1),low=”blue”, mid=”grey”,high=”red”)
#from this figure, it seems like Olig1 is expressed quite highly in certain clusters. lets do a k means clustering in pc space to get well defined clusters. will use k=9 as it seems to give good results on this data
clusters=kmeans(merfish_data_norm_olig1pos,centers = 9)
embedding[‘clusters’]=as.factor(clusters$cluster)
tsne_olig1_wclusters=ggplot(data = embedding, mapping = aes(x = x, y = y)) + geom_point(mapping = aes(col = as.factor(clusters)),size=0.4)+xlab(‘tsne1’)+ylab(‘tsne2’)+theme_minimal()
#if we look at our previous tsne that had expression of olig1 as the red hue, I will isolate the clusters that I think may be oligodendrocytes and do a subclustering. I am (visually) choosing the clusters that express olig1 most highly (the red ones). They are clusters 2,4,6
merfish_data_norm_olig1pos[‘clusters’]=as.factor(clusters$cluster)
| merfish_oligpos_granular=merfish_data_norm_olig1pos[merfish_data_norm_olig1pos[‘clusters’]==2 | merfish_data_norm_olig1pos[‘clusters’]==6 | merfish_data_norm_olig1pos[‘clusters’]==4,] |
merfish_oligpos_granular$clusters=NULL pca_granular_oligos=prcomp(merfish_oligpos_granular) plot(pca_granular_oligos$sdev[1:30], type=”l”) #will take first 4 dimensions by scree plot
embedding_granular=Rtsne(pca_granular_oligos$x[,1:4], dims=2, perplexity=30)$Y colnames(embedding_granular)=c(‘tsne1’,’tsne2’) embedding_granular=data.frame(x = embedding_granular[,1], y = embedding_granular[,2])
tsne_olig1_granular=ggplot(data=embedding_granular,mapping = aes(x = x, y = y)) + geom_point(size=0.4)+theme_minimal()+ xlab(‘tsne1’)+ylab(‘tsne2’)
#now will look at other genes #will look at pdgfra
tsne_olig1_granular_pdgfra=ggplot(data = embedding_granular, mapping = aes(x = x, y = y)) + geom_point(size=0.4,aes(col=merfish_oligpos_granular$Pdgfra))+theme_minimal()+scale_color_gradient2(midpoint=mean(merfish_oligpos_granular$Pdgfra),low=”blue”, mid=”grey”,high=”red”)+xlab(‘tsne1’)+ylab(‘tsne2’)
#from this plot, I will keep the cells that DO NOT EXPRESS PDGFRA, and I am going to say for this preliminary analysis, these are mature oligos. I’m not sure how sensitive my analysis is, but I feel like it may be quite precise!
hist(merfish_oligpos_granular$Pdgfra) #here was just looking at histogram of pdgfra in this smaller dataset. Will now keep cells that have 0 expression of pdgfra
#could have done DEG, but this is quite striking so I don’t think I need to!
#histogram showed that many are at 0 indeces_of_mature_oligos=rownames(merfish_oligpos_granular[merfish_oligpos_granular$Pdgfra==0,])
indeces_of_mature_oligos=as.numeric(indeces_of_mature_oligos) #indeces are the same as the original matrix
#this object below will be a list of the same length of the rows of the initial merfish dataset, which is a binary encoding of what is a mature oligo, based on the indeces previously determined mature_oligo_binary=rep(0,length(rownames(merfish_data_norm))) for (i in seq(length(mature_oligo_binary))){ if (i %in% indeces_of_mature_oligos){ mature_oligo_binary[i]=1 } }
merfish_data_norm_spatial[‘mature_oligos’]=as.factor(mature_oligo_binary)
mature_oligos_spatial=ggplot(merfish_data_norm_spatial,aes(x,y))+geom_point(size=0.4,mapping=aes(color=mature_oligos))+theme_minimal()+scale_color_manual(values=c(“light blue”, “maroon”))
#all figures I want to include olig1 pdgfra tsne_olig1_initial tsne_olig1_wclusters=tsne_olig1_wclusters+xlab(‘tsne1’)+ylab(‘tsne2’) tsne_olig1_granular_pdgfra mature_oligos_spatial=mature_oligos_spatial+xlab(‘Right lateral axis’)+ylab(‘Superior axis’)
grid.arrange(olig1,tsne_olig1_initial,tsne_olig1_granular_pdgfra,mature_oligos_spatial,ncol=2) ```