EC Yash Sonthalia

library(tidyverse) merfish=read.csv(‘/Users/yashsonthalia/Documents/JHUCourses/Spring2022/gdv_yash/data/MERFISH_Slice2Replicate2_halfcortex.csv.gz’) rownames(merfish)=merfish$X merfish$X=NULL x_coord=merfish$x y_coord=merfish$y merfish$x=NULL merfish$y=NULL
merfish=log2(merfish/rowSums(merfish)*1e6+1)
merfish$x=x_coord merfish$y=y_coord
spatial=ggplot(merfish,aes(x,y))+geom_point(size=0.01)
merfish$x=NULL merfish$y=NULL
pca=prcomp(merfish) plot(pca$sdev[1:30], type=”l”) #8 pcs contains most of the variation in the data
library(Rtsne) set.seed(0) ## reproducibility emb <- Rtsne(pca$x[,1:8], dims=2, perplexity=30)$Y dim(emb) rownames(emb) <- rownames(merfish)
emb=data.frame(emb)
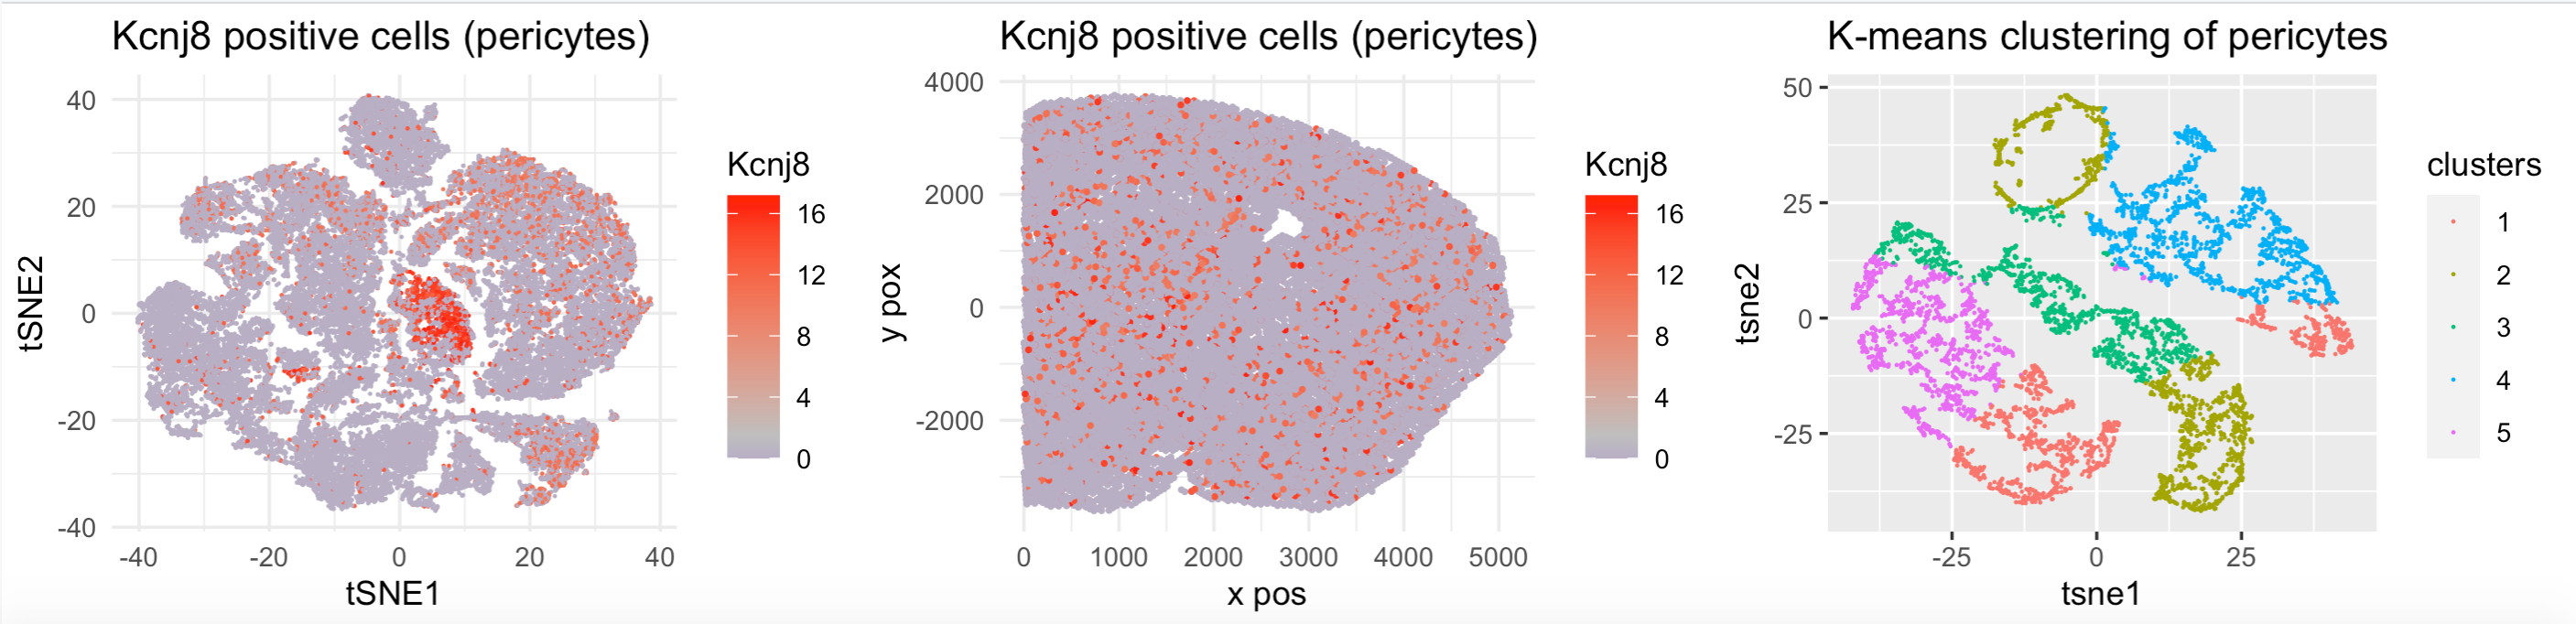
colnames(emb)=c(‘tSNE1’,’tSNE2’) emb$Kcnj8=merfish$Kcnj8
pericytes_tsne=ggplot(emb,aes(tSNE1,tSNE2))+geom_point(size=0.01,aes(col=Kcnj8))+labs(x = “tSNE1” , y = “tSNE2”,title=’Kcnj8 positive cells (pericytes)’)+theme_minimal()+ scale_color_gradient2(midpoint=mean(merfish$Kcnj8),low=”blue”, mid=”grey”,high=”red”)
#I want to find pericytes in this data. will do iterative clustering #the population of cells that have positive expression of a common #pericye marker gene, Kcnj8
merfish$x=x_coord merfish$y=y_coord
kcnj8_positive=ggplot(merfish,aes(x,y))+geom_point(size=0.4,mapping=aes(color=Kcnj8))+theme_minimal()+ scale_color_gradient2(midpoint=mean(merfish$Kcnj8),low=”blue”, mid=”grey”,high=”red”)+labs(x = “x pos” , y = “y pox”,title=’Kcnj8 positive cells (pericytes)’)
merfish_kcnj8=merfish[merfish$Kcnj8>0,] pca=prcomp(merfish_kcnj8) plot(pca$sdev[1:30], type=”l”) #3 pcs contains most of the variation in the data
library(Rtsne) set.seed(0) ## reproducibility emb <- Rtsne(merfish_kcnj8, dims=2, perplexity=40)$Y dim(emb) rownames(emb) <- rownames(merfish_kcnj8)
emb=data.frame(emb)
clusters=kmeans(merfish_kcnj8,5)
colnames(emb)=c(‘tSNE1’,’tSNE2’) emb[‘clusters’]=as.factor(clusters$cluster) clusterplot_kcnj8_positive=ggplot(emb,aes(tSNE1,tSNE2))+geom_point(size=0.01,aes(color=clusters))+labs(x = “tsne1” , y = “tsne2”,
1
                                                                                                                                                                 title='K-means clustering of pericytes') library(gridExtra) grid.arrange(pericytes_tsne,kcnj8_positive,clusterplot_kcnj8_positive,ncol=3)