Homework 1 Yash Sonthalia

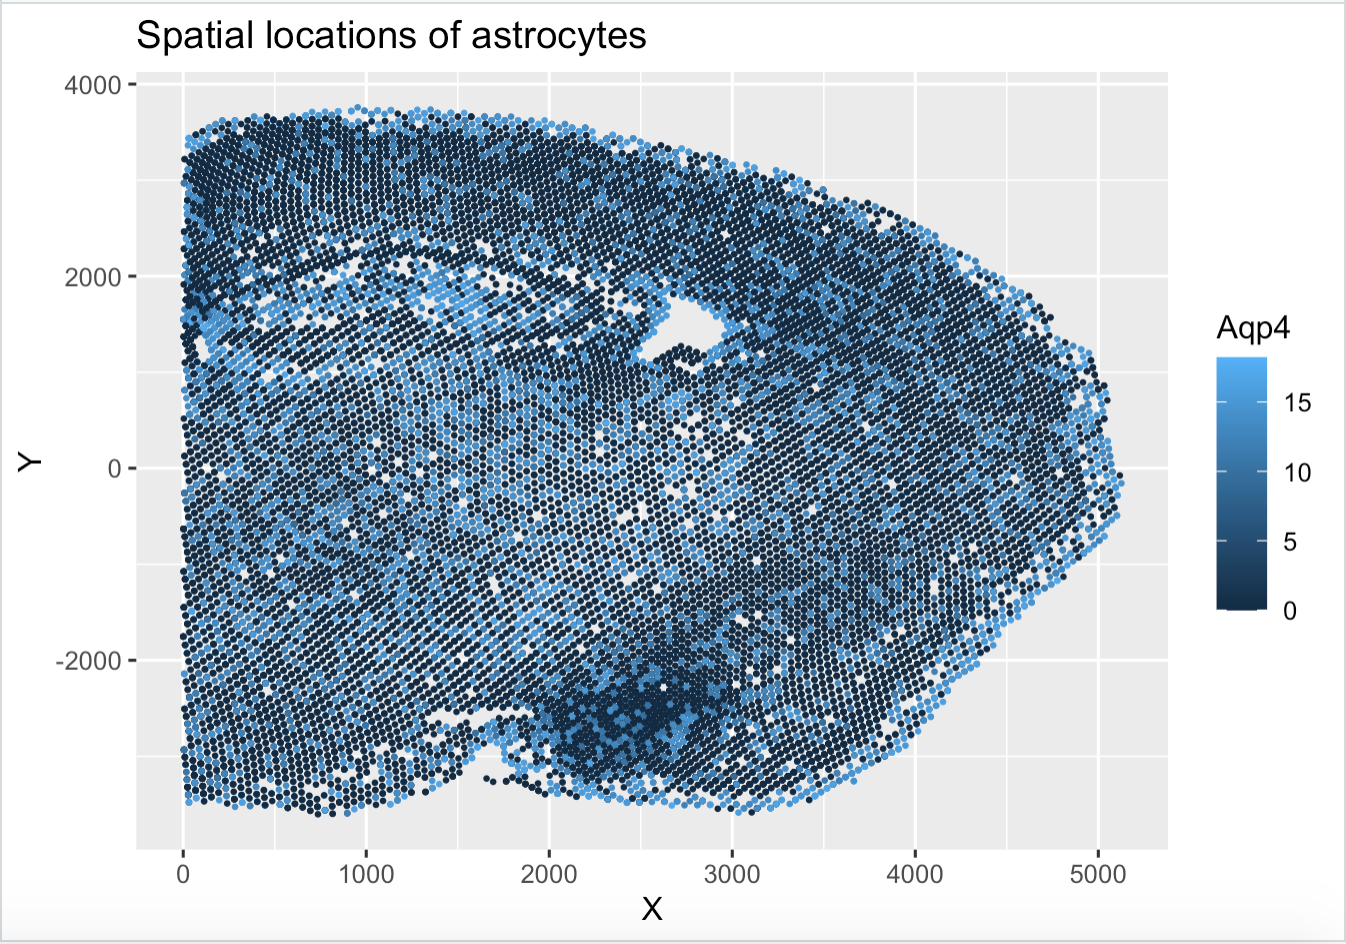
I am making a visualization of the relationship between the spatial location (quantitative) and the expression (quantitative) of Aqp4, a common marker gene for astrocytes in the merfish dataset. The merfish dataset is composed of spatial transcriptomics data from the mouse brain.
The geometric primitive I used is points to depict each sample. I am also using the geometric primitive of areas to highlight the positions of the astrocytes. Position is the visual channel encoded by the axes.
Aqp4 expression is encoded by color, which is the visual channel I used to depict which cells may be astrocytes.
My visualization hopefully makes the distribution of astrocytes in the mouse brain more clear. It is clear that astrocytes seem to be distributed evenly across the tissue, making more salient both how astrocyte-dense the brain is and how evenly spread out they are.
library(tidyverse)
merfish=read.csv('/Users/yashsonthalia/Documents/JHUCourses/Spring2022/genomic-data-visualization/data/MERFISH_Slice2Replicate2_halfcortex.csv.gz',row.names = 1)
merfish=data.frame(merfish)
merfish_data=merfish[,3:485]

cell_counts=rowSums(merfish_data)
merfish_data_norm=log2(merfish_data/cell_counts*1e6+1)
merfish_data_norm$x=merfish$x
merfish_data_norm$y=merfish$y


astrocytes=ggplot(merfish_data_norm,aes(x,y))+geom_point(mapping=aes(color=Aqp4),size=0.4)+
  xlab('X')+ylab('Y')+ggtitle('Spatial locations of astrocytes')
ggsave(filename = 'yashsonthalia_hw1_gdv.png')