I use R to (try to) figure out which hospital I should go to for shoppable medical services by comparing costs through analyzing Hospital Price Transparency data
As part of my teaching philosophy, I aim to demonstrate by example to my students how coding is an immensely useful and transferable skill for lots of other fun things beyond the spatial transcriptomics data analysis and research we do in lab. In this blog post, I use coding in R to (try to) figure out which hospital I should go to for shoppable medical services by comparing costs through analyzing hospital data from a for-profit hospital system, an integrated managed care consortium, and a non-profit academic medical center.
Background
In a previous blog post, I used coding in R to (try and failed to) figure out the cost of medical services by analyzing in-network provider negotiated rates, historical out-of-network and allowed amounts from insurance data made available when the Transparency in Coverage Final Rule went into effect.
According to the CMS website, the Transparency in Coverage Final Rule actually “builds upon previous actions the Administration has taken to increase price transparency by giving patients access to hospital pricing information. The Administration has already finalized requirements for hospitals to disclose their standard charges, including negotiated rates with third-party payers.” In both instances, the hope is that “making this information available to the public will drive innovation, support informed, price-conscious decision-making, and promote competition in the health care industry.”
So once again, I, as a “price-conscious” consumer, will go on a journey to (try to) figure out which hospital I should go to for my shoppable medical services of interest, this time, by analzying hospital pricing information.
Downloading the data
Thanks to the CMS, every hospital is required by law to provide a “pricing transparency CMS required file of standard charges” for shoppable services, which are services that can be scheduled in advance by a patient. Each hospital appears to have their own website and own page for distributing this information (I have yet to find a central repository), so in order to compare across hospitals, we must first identify hospitals of interest and search through their website to download the appropriate information.
I identified 3 hospitals near me and downloaded their prices for shoppable services, which I was generally able to find on a page about “federal price transparency regulations”:
-
The Johns Hopkins Hospital, a non-profit academic medical center associated with Johns Hopkins University: https://www.hopkinsmedicine.org/patient-care/patients-visitors/billing-insurance/pay-bill/charges-fees
-
Kaiser Permenante, an American integrated managed care consortium with its own insurance, hospitals, and integrated medical records: https://healthy.kaiserpermanente.org/washington/doctors-locations/price-transparency
-
Dominion Hospital, part of HCA Health System, which is America’s largest for-profit hospital system: https://www.hcavirginia.com/patient-resources/patient-financial-resources/pricing-transparency-cms-required-file-of-standard-charges
Inspecting the standard hospital charges files
Let’s download and read these files into R to see what we’re working with. Note, although these files are all machine-readable as required by law, it appears they use different delimiters and have differing numbers of header lines (requiring various skipped lines), demanding some level of manual intervention.
## HCA for-profit hospital
hca <- read.csv('621410313_dominion-hospital_standardcharges.csv', sep=",", skip = 1) # skip 1 header
head(hca)
  Procedure.ID HCPCS.CPT.Code              Description Gross.Charge
1          800                ADOLESCENT UNIT ROOMS         3926.52
2          803                CHILD UNIT ROOMS              3926.52
3          809                ADULT UNIT ROOMS              3829.53
4          815                EDU D686                      4129.34
5        37369 086689         HIV AB WESTERN BLOT            770.63
6        53190                GLIMEPIRIDE 2MG TAB             32.12
  Discounted.Cash.Price..Gross.Charges.
1                               3926.52
2                               3926.52
3                               3829.53
4                               4129.34
5                                770.63
6                                 32.12
## JHU
jhu <- read.csv('520591656_JohnsHopkinsHospital_standardcharges.csv', sep="|") # some reason uses | as the delimiter?
head(jhu) # super large file
  CodeType Code               Facility Gross_Charge Exp_Reimbursement CashPrice
1      EAP      Johns Hopkins Hospital       609.35            609.35    609.35
2      EAP      Johns Hopkins Hospital       609.35            597.16    609.35
3      EAP      Johns Hopkins Hospital       609.35            530.44    609.35
4      EAP      Johns Hopkins Hospital       609.35            544.15    609.35
5      EAP      Johns Hopkins Hospital       609.35            531.96    609.35
6      EAP      Johns Hopkins Hospital       609.35            597.16    609.35
  CashPrice_At_Disch CashPrice_Within_Thirty_Days Min_XR Max_XR
1             597.16                       603.26 508.75 609.35
2             597.16                       603.26 508.75 609.35
3             597.16                       603.26 508.75 609.35
4             597.16                       603.26 508.75 609.35
5             597.16                       603.26 508.75 609.35
6             597.16                       603.26 508.75 609.35
                                      Payer          Proc_Descr Procedure Rev.Code NDC
1                            TRICARE [2401] HC Admission Charge  22100001      221
2                     BLUE CR/SH FEP [1102] HC Admission Charge  22100001      221
3           MARYLAND PHYSICIANS CARE [1805] HC Admission Charge  22100001      221
4 MEDSTAR FAMILY CHOICE MARYLAND MCO [1807] HC Admission Charge  22100001      221
5     KAISER PERMANENTE MARYLAND MCO [1811] HC Admission Charge  22100001      221
6                              CIGNA [1200] HC Admission Charge  22100001      221
## Kaiser
kp <- read.csv('910511770-central-hospital-standard-charges-wa-en.csv', skip=2) # skip 2 header
head(kp)
description code..i. code..i..type code..ii. code..ii..type
1 HB PRIVATE ROOM AND BOARD (ONE BED) 0110 RC NA
2 HB SEMI-PRIVATE ROOM AND BOARD (TWO BEDS) 0120 RC NA
3 HB SEMI-PRIVATE ROOM AND BOARD OB 0122 RC NA
4 HB NURSERY ROOM & BOARD 0170 RC NA
5 HB PREEMIE ROOM & BOARD 0172 RC NA
6 CESAREAN SURGICAL SUPPLIES 0270 RC NA
modifiers setting drug_unit_of_measurement drug_type_of_measurement standard_charge.gross
1 inpatient NA 2457.69
2 inpatient NA 2457.69
3 inpatient NA 2112.19
4 inpatient NA 1567.65
5 inpatient NA 2988.81
6 both NA 136.00
standard_charge.discounted_cash
1 1327.15
2 1327.15
3 1140.58
4 846.53
5 1613.96
6 73.44
standard_charge..KAISER.FOUNDATION.HEALTH.PLAN.OF.WASHINGTON...COMMERCIAL..negotiated_dollar
1 NA
2 NA
3 NA
4 NA
5 NA
6 NA
standard_charge..KAISER.FOUNDATION.HEALTH.PLAN.OF.WASHINGTON...COMMERCIAL..negotiated_percentage
1 70.2
2 70.2
3 70.2
4 70.2
5 70.2
6 70.2
standard_charge..KAISER.FOUNDATION.HEALTH.PLAN.OF.WASHINGTON...COMMERCIAL..negotiated_algorithm
1 NA
2 NA
3 NA
4 NA
5 NA
6 NA
estimated_amount..KAISER.FOUNDATION.HEALTH.PLAN.OF.WASHINGTON...COMMERCIAL.
1 1725.30
2 1725.30
3 1482.76
4 1100.49
5 2098.14
6 95.47
standard_charge..KAISER.FOUNDATION.HEALTH.PLAN.OF.WASHINGTON...COMMERCIAL..methodology
1 percent of billed charges
2 percent of billed charges
3 percent of billed charges
4 percent of billed charges
5 percent of billed charges
6 percent of billed charges
additional_payer_notes..KAISER.FOUNDATION.HEALTH.PLAN.OF.WASHINGTON...COMMERCIAL.
1 NA
2 NA
3 NA
4 NA
5 NA
6 NA
standard_charge..KAISER.FOUNDATION.HEALTH.PLAN.OF.WASHINGTON...MEDICARE..negotiated_dollar
1 NA
2 NA
3 NA
4 NA
5 NA
6 NA
standard_charge..KAISER.FOUNDATION.HEALTH.PLAN.OF.WASHINGTON...MEDICARE..negotiated_percentage
1 70.2
2 70.2
3 70.2
4 70.2
5 70.2
6 70.2
standard_charge..KAISER.FOUNDATION.HEALTH.PLAN.OF.WASHINGTON...MEDICARE..negotiated_algorithm
1 NA
2 NA
3 NA
4 NA
5 NA
6 NA
estimated_amount..KAISER.FOUNDATION.HEALTH.PLAN.OF.WASHINGTON...MEDICARE.
1 1725.30
2 1725.30
3 1482.76
4 1100.49
5 2098.14
6 95.47
additional_payer_notes...KAISER.FOUNDATION.HEALTH.PLAN.OF.WASHINGTON...MEDICARE.
1 NA
2 NA
3 NA
4 NA
5 NA
6 NA
standard_charge..KAISER.FOUNDATION.HEALTH.PLAN.OF.WASHINGTON...MEDICARE..methodology
1 percent of billed charges
2 percent of billed charges
3 percent of billed charges
4 percent of billed charges
5 percent of billed charges
6 percent of billed charges
standard_charge.min standard_charge.max additional_generic_notes
1 1725.30 1725.30
2 1725.30 1725.30
3 1482.76 1482.76
4 1100.49 1100.49
5 2098.14 2098.14
6 95.47 95.47
Likewise, it looks like these files all have different column names, demanding additional manual intervention to identify common information. There does not appear to be a README or description of these columns, so I am making a number of assumptions here based on my expert domain knowledge.
I am going to assume that the Description column from hca matched the Proc_Descr column from jhu matches the description column from kp.
Likewise, because I am interested the cost of medical services, I am going to assume that the number in the Gross.Charge column from hca is the actual price of the service, for example. However, keep in mind that as a patient with health insurance, the amount that I pay is largely determined by my health insurance coverage. Side note: it looks like JHU has a different entry for each different ‘payer’ (ie. insurance provider) along with their associated expected reimbursement Exp_Reimbursement.
For the sake of comparison, let’s consider a patient that does not have health insurance and paying in cash. So their financial liability will be determined by the uninsured discount, which I am assuming is associated with the Discounted.Cash.Price..Gross.Charges. column in hca, the CashPrice column for jhu, and the standard_charge.discounted_cash column for kp.
Let’s subset to these columns for the sake of browsing the data.
hca_sub <- hca[, c('Description', 'Discounted.Cash.Price..Gross.Charges.')]
jhu_sub <- jhu[, c('Proc_Descr', 'CashPrice')]
kp_sub <- kp[, c('description', 'standard_charge.discounted_cash')]
colnames(hca_sub) <- colnames(jhu_sub) <- colnames(kp_sub) <- c('Service', 'Price')

# make rows distinct to remove repeats
hca_sub <- dplyr::distinct(hca_sub)
jhu_sub <- dplyr::distinct(jhu_sub)
kp_sub <- dplyr::distinct(kp_sub)
Now, we can more readily look at the most expensive procedures offered at each hospital.
head(hca_sub[order(as.numeric(hca_sub$Price), decreasing=TRUE),])
                      Service    Price
822  INVEGA SUSTEN 234 MG INJ 16004.95
853  INVEGA SUSTEN 156 MG INJ  7645.19
238  HUMATE-P 1200 U VWF:RCO   6936.00
1114 INVEGA SUSTEN 117 MG INJ  5522.27
237  ECT WITH MONITORING       4490.55
201  CHROM BREAKAGE 50 100     4341.60
head(jhu_sub[order(as.numeric(jhu_sub$Price), decreasing=TRUE),])
                                                                    Service    Price
6640 TISAGENLECLEUCEL 0.2 X10EXP6 TO 2.5X10EXP8 CELL INTRAVENOUS SUSPENSION 551327.5
6645 CILTACABTAGENE AUTOLEUCEL 0.5 X 10EXP6 TO 1X 10EXP8 CELL IV SUSPENSION 486450.0
6641 TISAGENLECLEUCEL 0.6 X 10EXP8 TO 6 X10EXP8 CELL INTRAVENOUS SUSPENSION 434547.7
6639                         AXICABTAGENE CILOLEUCEL INTRAVENOUS SUSPENSION 431500.0
6644    BREXUCABTAGENE AUTOLEUCEL 2X 10EXP6 TO 2X 10EXP8 CELL IV SUSPENSION 431500.0
67                               HC Heart/Lung Transplant Organ Acquisition 150000.0
head(kp_sub[order(as.numeric(kp_sub$Price), decreasing=TRUE),])
                                               Service     Price
5379                      AXICABTAGENE CILOLEUCEL CAR+ 345208.17
4990 HB YTTRIUM Y-90 IBRITUMOMAB TIUXETAN TX TO 40 MCI  55324.20
4741       histrelin 50 mg (65 mcg/day) Kit 1 each KIT  37251.42
585            HB INSERT DEFIB W/CARDIO-DEFIB GENE.FAC  36834.26
972                                   HB MOR CPT 64582  33713.29
582        "HB INSERT IMPLANTABLE CARDIOVERTER-DEFIB,"  26202.92
Note, the set of shoppable services provided seems to vary from hospital to hospital, but hopefully there will be sufficient overlap for us to compare services of interest and identify the best hospital to provide us with the most affordable care.
However, even if we are able to assume that these columns all refer to the description of the shoppable medical service, it looks like the actual description text used is different from hospital to hospital…
## need to match terms
head(kp_sub$Service, n=5)
[1] "HB PRIVATE ROOM AND BOARD (ONE BED)"       "HB SEMI-PRIVATE ROOM AND BOARD (TWO BEDS)"
[3] "HB SEMI-PRIVATE ROOM AND BOARD OB"         "HB NURSERY ROOM & BOARD"
[5] "HB PREEMIE ROOM & BOARD"
"HB PRIVATE ROOM AND BOARD (ONE BED)" %in% jhu_sub$Service
[1] FALSE
"HB PRIVATE ROOM AND BOARD (ONE BED)" %in% hca_sub$Service
[1] FALSE
So we will need to semi-manually identify shared descriptions of shoppable medical service in order to compare their prices across these hospitals.
Finding and comparing similar shoppable medical services across hospitals
Through manually perusing the service descriptions across all 3 hospitals, I was able to identify some (what I am interpreting to be) similar descriptions.
My approach is based on greping for similar terms. For example:
hca_sub[grep('CHROM', hca_sub$Service),]
                     Service   Price
168 CHROM & KARY 15-20 2 KAR 4054.07
201 CHROM BREAKAGE 50 100    4341.60
jhu_sub[grep('Chrom Analy', jhu_sub$Service),]
                                         Service  Price
2179                HC Chrom Analy; 50-100 Cells 953.49
2180                 HC Chrom Analy; 15-20 Cells 762.80
2181                    HC Chrom Analy; 45 Cells 953.49
2182                 HC Chrom Analy; 20-25 Cells 953.49
2183              HC Chrom Analy; Af/Cv 15 Cells 715.12
2184 HC Chrom Analy; Situ Af Cells From 6-12 Col 715.12
2189       HC Chrom Analy; Addtl Karyot Ea Study  47.66
2190               HC Chrom Analy; Addtl Banding 178.76
2191           HC Chrom Analy; Addtl Cell Counts  47.66
2192             HC Chrom Analy; Addtl Hi Resoln 238.37
kp_sub[grep('CHROMOSOME', kp_sub$Service),]
                                             Service  Price
2932        TISSUE CULTURE CHROMOSOME ANALYSIS LYMPH 226.69
2941                CHROMOSOME ANALYSIS FOR BREAKAGE 337.00
2942          "CHROMOSOME ANALYSIS, SCORE 100 CELLS" 337.00
2943        CHROMOSOME ANALYSIS CT 4 CELLS I KAROTYP 514.38
2944        CHROMOSOME ANALYSIS 15-20 CELLS 2 KARYOT 244.16
2945          CHROMOSOME ANALYSIS 45 CELLS MOSAICISM 292.46
2946               "CHROMOSOME ANALYSIS,20-25 CELLS" 281.38
2947      "CHROMOSOME ANALYSIS,20-25 CELLS (HC) BKR" 281.38
2948           CHROMOSOME ANALYSIS AMNIOTIC FLUID 15 366.92
2949        CHROMOSOME ANALYSIS IN SITU AMNIOTIC FLU 337.92
2955          CHROMOSOME ANALYSIS ADDL KARYOTYPES EA  65.08
2956 CHROMOSOME ANALYSIS ADDL KARYOTYPES EA (HC) BKR  65.08
2957           CHROMOSOME ANALYSIS ADDL SPEC BANDING 133.46
2958          CHROMOSOME ANALYSIS ADDL CELLS COUNTED  52.31
2959        CHROMOSOME ANALYSIS ADDL HIGH RESOLUTION  67.00
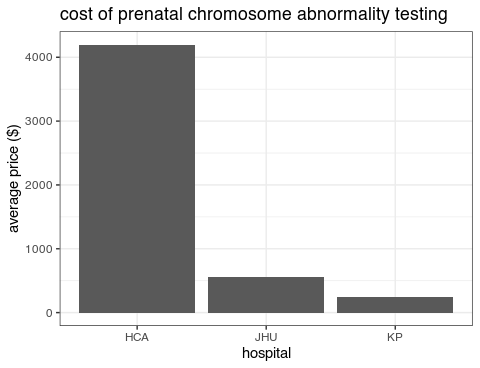
Based on my expert knowledge, I assume that these are likely all associated with prenatal chromosome abnormality testing. There are likely slight variations in terms of testing for specific things like breakages or aneuploidy versus karyotyping versus how many cells analyzed.
Do note that even greping requires many tests and iterations as chrom* in JHU’s descriptions also includes chromatography and chromium, which is not related to prenatal chromosome abnormality testing.
For the sake of comparison, let’s simply identify the average price I may expect to pay at each hospital.
hca_price <- mean(as.numeric(hca_sub[grep('CHROM', hca_sub$Service),]$Price))
jhu_price <- mean(as.numeric(jhu_sub[grep('Chrom Analy', jhu_sub$Service),]$Price))
kp_price <- mean(as.numeric(kp_sub[grep('CHROMOSOME', kp_sub$Service),]$Price))
And let’s make a data visualization of the results!
library(ggplot2)
df1 <- reshape2::melt(data.frame('HCA'=hca_price, 'JHU'=jhu_price, 'KP'=kp_price))
ggplot(data=df, aes(x=variable, y=value)) +
  geom_bar(stat="identity") +
  xlab('hospital') +
  ylab('average price ($)') +
  ggtitle('cost of prenatal chromosome abnormality testing') +
  theme_bw()
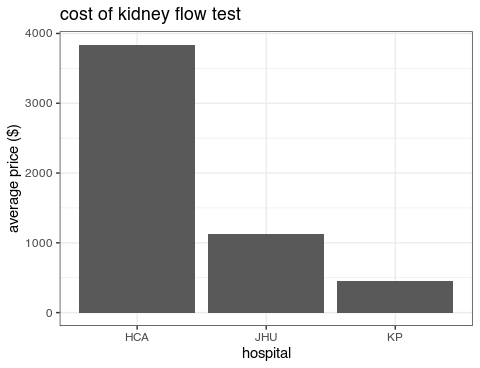
Let’s try with another medical procedure. What about a kidney (renal) nuclear medicine scan ie. imaging test to look at the blood (vascular) flow in your kidney? Again, there is a lot of expert domain knowledge and assumptions needed to just match up these descriptions.
hca_price <- mean(as.numeric(hca_sub[grep('KDNEY FLW', hca_sub$Service),]$Price))
jhu_price <- mean(as.numeric(jhu_sub[grep('Kidney Flow', jhu_sub$Service),]$Price))
kp_price <- mean(as.numeric(kp_sub[grep('KIDNEY IMAGING WITH VASCULAR FLOW', kp_sub$Service),]$Price))

df2 <- reshape2::melt(data.frame('HCA'=hca_price, 'JHU'=jhu_price, 'KP'=kp_price))
ggplot(data=df, aes(x=variable, y=value)) +
  geom_bar(stat="identity") +
  xlab('hospital') +
  ylab('average price ($)') +
  ggtitle('cost of kidney flow test') +
  theme_bw()
What about a cocaine drug screening test? Or at least, I’m assuming a description of COCAINE refers to a drug screening test and not the illicit substance; again a lot of expert domain knowledge and assumptions here.
hca_price <- mean(as.numeric(hca_sub[grep('COCAINE', hca_sub$Service),]$Price))
jhu_price <- mean(as.numeric(jhu_sub[grep('Cocaine', jhu_sub$Service),]$Price))
kp_price <- mean(as.numeric(kp_sub[grep('COCAINE', kp_sub$Service),]$Price))

df3 <- reshape2::melt(data.frame('HCA'=hca_price, 'JHU'=jhu_price, 'KP'=kp_price))
ggplot(data=df, aes(x=variable, y=value)) +
  geom_bar(stat="identity") +
  xlab('hospital') +
  ylab('average price ($)') +
  ggtitle('cost of cocaine drug screening') +
  theme_bw()
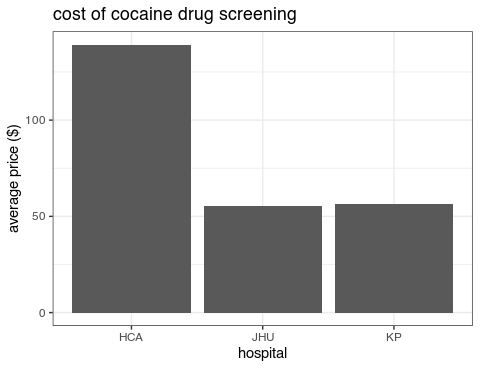
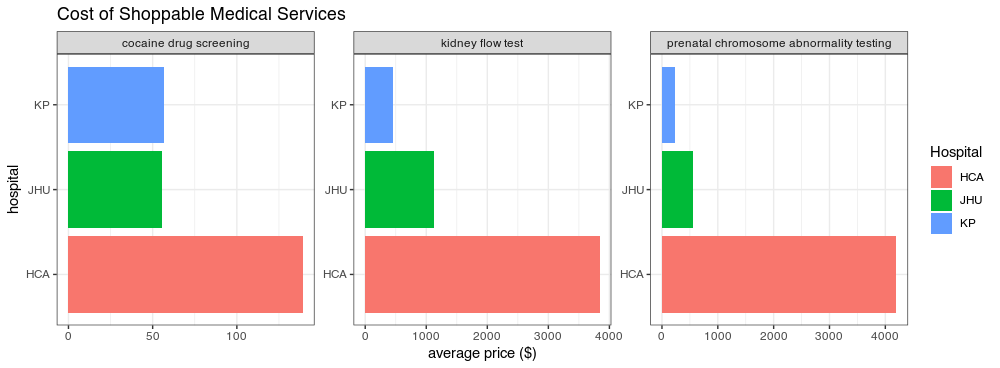
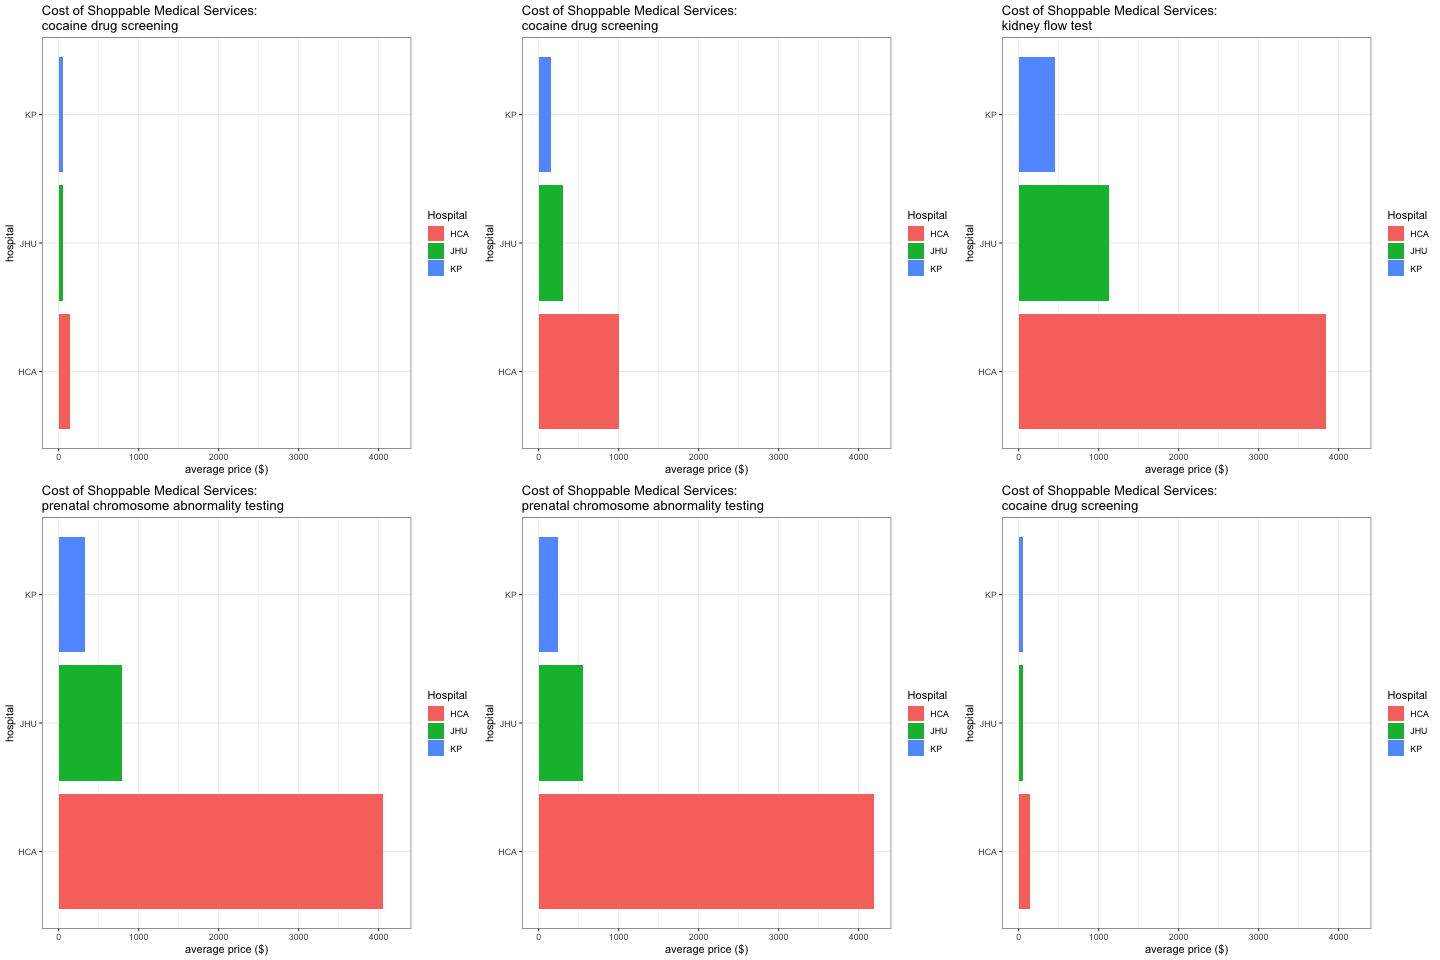
One result is notable though: for all the services I was able to compare across these 3 hospitals, the for-profit hospital seems consistently the most expensive. Let’s make a data visualization to summarize our findings.
dfall <- rbind(
  cbind(service='prenatal chromosome abnormality testing', df1),
  cbind(service='kidney flow test', df2),
  cbind(service='cocaine drug screening', df3)
)
ggplot(data=dfall, aes(x=variable, y=value, fill=variable)) +
  facet_wrap(vars(service), scales = 'free', ncol = 4) +
  geom_bar(stat="identity", position = "dodge") +
  xlab('hospital') +
  ylab('average price ($)') +
  theme_bw() + guides(fill=guide_legend(title="Hospital")) +
  coord_flip() + ggtitle('Cost of Shoppable Medical Services')
Just for fun, let’s use gganimate to make an animation.
library(gganimate)
anim <- ggplot(data=dfall, aes(x=variable, y=value, fill=variable)) +
  geom_bar(stat="identity", position = "dodge") +
  xlab('hospital') +
  ylab('average price ($)') +
  theme_bw() + guides(fill=guide_legend(title="Hospital")) +
  coord_flip() +
  transition_states(service) +
  labs(title = 'Cost of Shoppable Medical Services:\n{closest_state}')
animate(anim)
Challenges to keep in mind
While these trends are interesting, keep in mind that we are making a lot of assumptions in matching up service descriptions in order to compare across hospitals.
I found medications in particular to be very difficult to compare across hospitals because the prices are often in different units. See what happens when I try to compare the price for insulin:
hca_sub[grep('INSULIN', hca_sub$Service),]
                     Service   Price
117 INSULIN TOTAL             527.82
651 INSULIN ASPART/ASP PROT   444.05
931 INSULIN 20 U INJ           63.30
932 INSULIN 20 U INJ          191.79
933 INSULIN 20 U INJ          437.43
934 INSULIN 20 U INJ          525.93
935 INSULIN 20 U INJ          664.82
936 INSULIN PEN DISP 3 ML    1303.80
jhu_sub[grep('Insulin', jhu_sub$Service),]
               Service Price
1584 HC Insulin; Total 35.75
1840     HC Insulin Ab 88.19
kp_sub[grep('INSULIN', kp_sub$Service),]
                                      Service  Price
1844 INSULIN INDUCED C-PEPTIDE SUPRESSION PAL 322.23
1845                  INSULIN TOLERANCE PANEL 554.69
1846 INSULIN TOLERANCE PANEL FOR G HORMONE DE 200.38
2141                                  INSULIN  22.23
2142                          "INSULIN, FREE"  25.15
2245                               PROINSULIN  51.92
2487                       INSULIN ANTIBODIES  41.62
5220      "INSULIN INJ, PER 5 UNITS, FAC FEE"   0.69
5221    "INSULIN ADMIN-DME PER 50 UNITS, FAC"   7.24
The same is true for rooming/housing since bills may vary by duration of stay or special equipment for example.
hca_sub[grep('ROOM', hca_sub$Service),]
                   Service   Price
1 ADOLESCENT UNIT ROOMS    3926.52
2 CHILD UNIT ROOMS         3926.52
3 ADULT UNIT ROOMS         3829.53
jhu_sub[grep('Room', jhu_sub$Service),]
                                Service  Price
88   HC Marburg Room Differential Rates 375.00
2518    HC Ionm in Operatng Room 15 Min  30.16
2770   HC Asam Residential Room & Board  45.84
kp_sub[grep('ROOM', kp_sub$Service),]
                                           Service   Price
1              HB PRIVATE ROOM AND BOARD (ONE BED) 1327.15
2        HB SEMI-PRIVATE ROOM AND BOARD (TWO BEDS) 1327.15
3                HB SEMI-PRIVATE ROOM AND BOARD OB 1140.58
4                          HB NURSERY ROOM & BOARD  846.53
5                          HB PREEMIE ROOM & BOARD 1613.96
8                           HB OR ROOM ADDL 15 MIN  321.22
11                         HB RECOVERY ROOM 1ST HR  385.23
15                                HB DELIVERY ROOM  795.81
26          "HB UC ROOM FEE,DRAINAGE SKIN ABSCESS"  207.37
27          "HB TX ROOM FEE,DRAINAGE SKIN ABSCESS"  207.37
29              "HB UC ROOM FEE,I&D ABCESS,COMPL."  428.40
30              "HB TX ROOM FEE,I&D ABCESS,COMPL."  428.40
46          "HB UC ROOM FEE,PUNCTURE DRAIN LESION"  428.40
115            "HB UC ROOM FEE,NAIL AVULSION,SIMP"  207.37
118         "HB UC ROOM FEE,EVAC SUBUNGUAL HEMATO"  133.34
121                  HB TX ROOM EXCISE NAIL/MATRIX  428.40
122                "HB UC ROOM FEE,NAILBED REPAIR"  667.13
123                   "HB ROOM FEE,NAILBED REPAIR"  667.13
127            "HB UC ROOM FEE,REPAIR SUPERFICIAL"  207.37
128               "HB ROOM FEE,REPAIR SUPERFICIAL"  207.37
130          "HB UC ROOM FEE,REPR SUPERFICIAL WND"  207.37
131             "HB ROOM FEE,REPR SUPERFICIAL WND"  207.37
142         "HB UC ROOM FEE,RPR SUPERFICIAL WOUND"  207.37
145          "HB UC ROOM FEE,REPR SUPERFICL WOUND"  207.37
173           "HB UC ROOM FEE,LAYER CLOSURE WOUND"  428.40
174                      "HB ROOM FEE, LAYER CLSR"  428.40
181             "HB UC ROOM FEE,LAYER CLOSE WOUND"  428.40
229            "HB UC ROOM FEE,TREATMENT OF BURNS"  207.37
230            "HB TX ROOM FEE,TREATMENT OF BURNS"  207.37
387    HB TX ROOM ARTHROTOMY FOR INFECTION JT EACH 1647.27
393       "HB TX ROOM FASCIECTOMY, PARTIAL PALMAR" 3418.18
405       "HB TX ROOM FEE, LENGTHEN TEND EXTENSOR" 3418.18
431            "HB TX ROOM FEE, AMPU FINGER/THUMB" 3418.18
436           "HB UC ROOM FEE,TREAT HIP DISLOCATE"  237.72
497  "HB UC ROOM FEE,APPLICATION SHOULDER TO HAND"  275.50
520                "HB UC ROOM FEE,STRAPPING KNEE"  133.34
528       "HB UC ROOM FEE,REPAIR BODY CAST/JACKET"  167.38
753                  HB TREATMENT ROOM COLONOSCOPY 1243.54
760         "HB PROC ROOM FEE,DIAGNOSTIC ANOSCOPY"  133.34
1018                   "HB ROOM FEE, REPAIR WOUND" 2427.81
1040                 "HB UC ROOM FEE,REMV CERUMEN"   66.00
Discussion and conclusion
I hope this blog tutorial helps provide an open-source resource to begin analyzing and comparing the costs of shoppable medical services made available thanks to the Hospital Price Transparency regulations by CMS. I’ve demonstrated a few examples of how I inferred medical services based on their associated descriptions and compared their cash costs without insurance across 3 hospitals. I would expect the same general approach to be readily adaptable to other hospitals.
Some additional questions I have that may be addressed by incorporating more data from more hospitals:
- What are all the hospitals in the United States? Can I automate the scraping of these price files?
- Is there a better, less manual approach for identifying putative matched medical services across hospitals?
- For a particular medical service, which hospital in the United States provides the best price? Which hospital within an hour-drive radius of me?
- For a particular medical service, what is the geographical distribution of prices by hospitals? Are some hospitals in certain states or counties/cities generally offering better prices for example?
- What is the geographical distribution of medical services by hospitals? Do hospitals in certain states or counties/cities not offer certain services for example?
- What is the price distribution of medical services by for-profit versus non-profit versus academic-affiliated versus government-affiliated hospitals?
And more philosophically:
- What is the level of agency I can exercise in this choice of the hospital I go to?
- What is the cost (in terms of my time) it takes to be able to make this choice?
- Who do we expect to be able to exercise this choice?
- Is it really a choice? Can it really be a choice? Should it be a choice?
Of course, with any set of summary statistics like averages, we should take a look back at the raw data and double check to ensure there have not been any misinterpretations of the data or propagation of errors such as typos from data entry and all the other caveats that come with data encoding.
Likewise, keep in mind that just because a hospital service is more expensive, that may not necessarily be bad if the more expensive service is associated with improved outcomes. However, this discrepancy of healthcare costs by for-profit versus non-profit hospitals has been the subject of much research. For example, Rosenau and Linder in their scientific manuscript “Two Decades of Research Comparing For-Profit and Nonprofit Health Provider Performance in the United States” in 2003 performed “a systematic review of data-based, peer-reviewed scientific assessments of performance differences between private for-profit and private nonprofit U.S. health care providers published since 1980” to find that “the nonprofits were judged superior 59 percent of the time, the for-profits superior only 12 percent of the time, and for the rest (29 percent), no difference was found or results were mixed.” In addition, Devereaux et al in their scientific manuscript “Payments for care at private for-profit and private not-for-profit hospitals: a systematic review and meta-analysis” in 2004 used “eight observational studies, involving more than 350 000 patients altogether and a median of 324 hospitals” and found that “[p]rivate for-profit hospitals result in higher payments for care than private not-for-profit hospitals.”
As we’ve seen here, the data now made readily available thanks to the Hospital Price Transparency regulations means that anyone who can code can access this information to compare prices for evidence of price gouging or identify market opportunities based on lack of specific services at certain geographic locations to name a few potential applications. However, there are a number of challenges I’ve identified and demonstrated that make this data difficult to use. For example, in order for this data usable, column names and description words need to be standardized (or semantic search algorithms need to be developed and applied to standardize them). As it currently stands, in my opinion, this data is not yet ready for a consumer to use to make an “informed, price-conscious decision” regarding their health care. However, I do think this data is extremely valuable to researchers, journalists, regulatory agency, and entrepreneurs, especially those who can code to take advantage of this big data opportunity!
So try it out for yourself!
Recent Posts
- Vibe coding with SEraster and STcompare to compare spatial transcriptomics technologies on 22 February 2026
- RNA velocity in situ infers gene expression dynamics using spatial transcriptomics data on 13 October 2025
- Analyzing ICE Arrest Data - Part 2 on 27 September 2025
- Analyzing ICE Detention Data from 2021 to 2025 on 10 July 2025
- Multi-sample Integrative Analysis of Spatial Transcriptomics Data using Sketching and Harmony in Seurat on 22 April 2025