Online bargain-hunting in R with rvest
Over a billion people worldwide purchase goods online. Global e-retail sales are in the trillions of dollars. So given all this interest in online shopping, you’d think that it would be easier - specifically, easier to browse. I find browsing in online shopping very limited. Particularly when it comes to sorting or filtering products. Have you ever noticed when shopping online how you can sort by ‘customer rating’ or by ‘prices: low to high’ but NOT by best bargain? By best bargain, I mean the largest monetary differential between the retail cost and the selling price. If the failure of JCPenney’s ‘everyday low prices’ experiment has taught us anything, is that people love a good deal; they love buying that supposedly $1000 jacket on sale for $500 (that’s 50% off) or that $100 shirt in the clearance bin for $10 (that’s 90% off). So it seems like being able to sort by best bargain would be a useful feature. And yet I have never seen an online shopping retailer with this sorting feature available. So since this sorting feature doesn’t exist, we as savvy programmers must take it upon ourselves to enhance our own online shopping experience and improve the efficiency of our bargain hunting!
In this blog post, I will demonstrate how to use rvest, a web-scraping tool in R, to find the best bargains on Poshmark.com. The code, of course, can be modified for other websites as well.
For demonstrative purposes, I will be shopping for women’s blazers. If I was browsing online, I would just visit the url https://poshmark.com/category/Women-Jackets_&_Coats-Blazers. But now that we’re web scraping in R, I can use the real_html() function to get the source code corresponding to that page.
library('rvest')
url <- 'https://poshmark.com/category/Women-Jackets_&_Coats-Blazers'
webpage <- read_html(url)
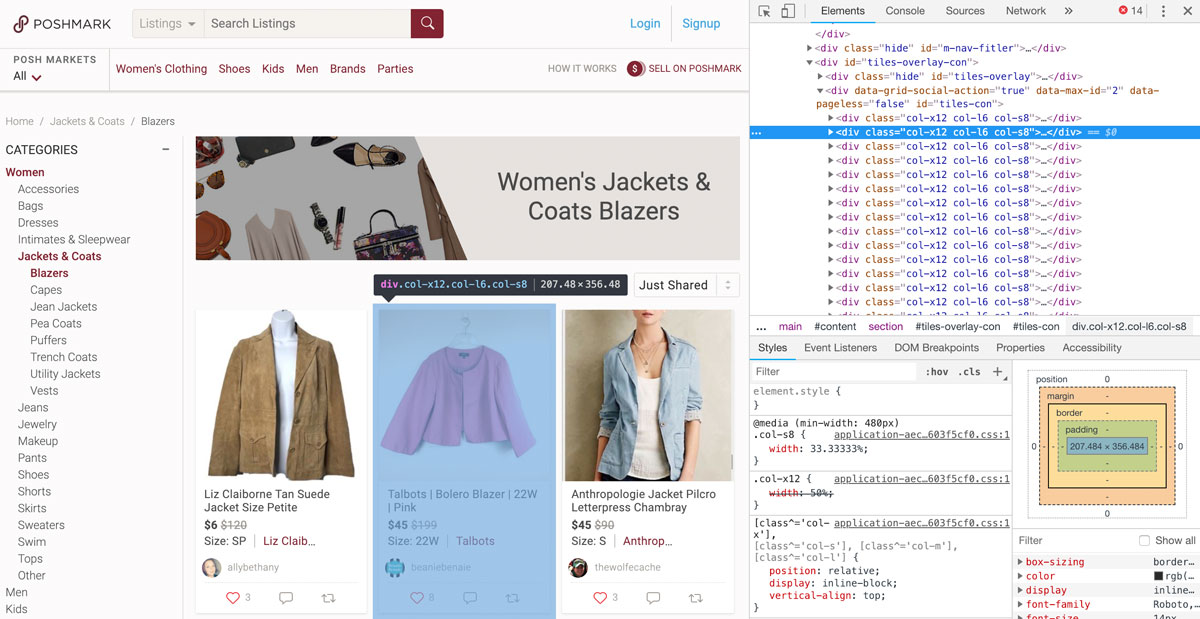
Upon inspecting the page source code, I notice that every product and all its associated information (original price, sale price, thumbnail image, and page link) is held within a div that is of class ‘col-x12’. So I will use the html_nodes() function and the ‘col-x12’ class to split up the webpage into 48 nodes, one for each product on the page.
content <- html_nodes(webpage,'.col-x12')
length(content) # double check 48 products
48
Now for each product, I will use a combination of the html_nodes() function and regex parsing to pull out specific information. For example, from inspecting the page source code, I can see that the sales price of each product is always in a div that is of class ‘price’ and between the substrings <div class=\"price\"> and <span class=\"original\">. So I will use gregexpr() to specifically find the particular substring that meets these criteria. I will loop through each product to find its retail price, its sales price, the amount discounted (difference between the retail and sales price), the percent discounted, as well as an image and link to the product page.
results <- do.call(rbind, lapply(1:length(content), function(i) {

  price <- as.character(html_nodes(content[[i]], '.price'))
  ind1 <- gregexpr(pattern ='<div class=\"price\">', price)[[1]] + nchar('<div class=\"price\">')
  ind2 <- gregexpr(pattern ='<span class=\"original\">', price)[[1]]
  ind3 <- ind2 + nchar('<span class=\"original\">')
  ind4 <- gregexpr(pattern = '</span>', price)[[1]]
  selling <- as.numeric(substr(price, ind1+1, ind2-2))
  original <- as.numeric(substr(price, ind3+1, ind4-1))

  link <- as.character(html_nodes(content[[i]], '.covershot-con'))
  ind1 <- gregexpr(pattern ='href=', link)[[1]] + nchar('href=')
  ind2 <- gregexpr(pattern ='title', link)[[1]]
  href <- paste0('https://poshmark.com', substr(link, ind1+1, ind2-3))

  ind1 <- gregexpr(pattern ='src=', link)[[1]] + nchar('src=')
  ind2 <- gregexpr(pattern ='.jpg', link)[[1]]
  src <- substr(link, ind1+1, ind2+3)

  df <- data.frame(
	'link' = href,
	'retail' = original,
	'sale' = selling,
	'discount' = original-selling,
	'pct' = (original-selling)/original,
	'image'=src
  )
  return(df)

}))
Now, using this information, I can finally sort by best bargain! I can even further filter out products that I don’t want to consider such as products where the original value is unknown, or where the discount is not sufficiently large (in this case, less than $30 or less than 50% off). And this gives us a final set of products that we may be interested in!
## sort
results <- results[order(results$discount, decreasing=TRUE),]

## filter
## retail price unknown
vi <- results$retail == 0
results <- results[!vi,]
## no pictures
vi <- results$image == ''
results <- results[!vi,]
## discount is not sufficient
vi <- results$discount < 30 | results$pct < 0.5
results <- results[!vi,]

head(results[,1:5])
                                                                                                      link
21                             https://poshmark.com/listing/Vintage-Wathne-Jacket-5c3aa18e409c15149a4863c0
19               https://poshmark.com/listing/Vintage-Wathne-Jacket-5c3aa18e409c15149a4863c0
35        https://poshmark.com/listing/Milly-Frayed-Edges-Double-Zip-Tweed-Blazer-5c3aa05bbaebf6bdb43d1bbd
27   https://poshmark.com/listing/St-John-red-Santana-knit-blazer-cardigan-Size-M-5c3aa155c9bf500d8976340a
30                    https://poshmark.com/listing/Eileen-Fisher-Loose-Fit-Blazer-5c3aa11e7386bc11a2f9ae76
33 https://poshmark.com/listing/Vintage-Bagatelle-100-Leather-Brown-Jacket-Blazer-5c3aa0c0df03076810f474bc
   retail sale discount       pct
21   1500  299     1201 0.8006667
19    600   45      555 0.9250000
35    598  150      448 0.7491639
27    500   80      420 0.8400000
30    250   40      210 0.8400000
33    198   30      168 0.8484848
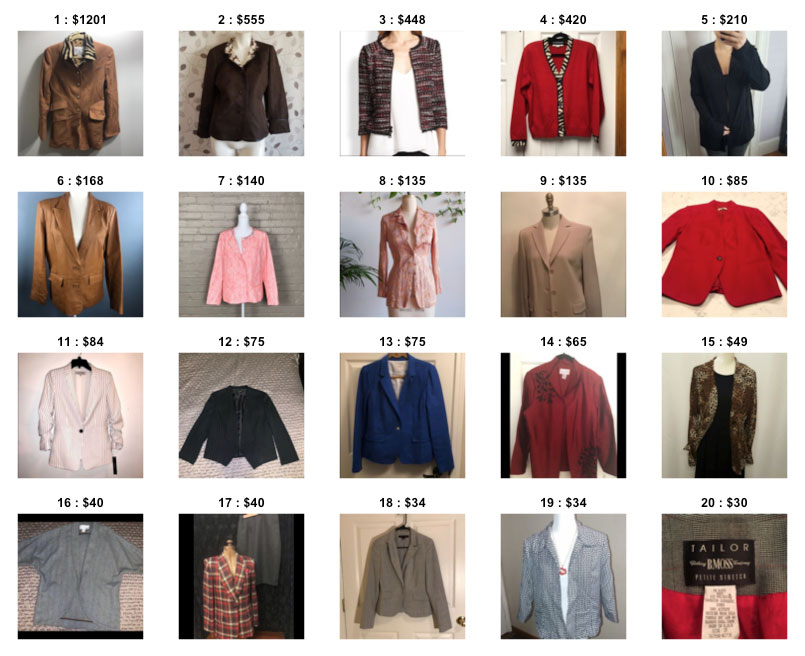
I can just look at the resulting table, or I can further plot a thumbnail image of each product along with the amount that its discounted by to get a better sense of which products may be worth looking into further.
## plot
library(jpeg)
n <- ceiling(sqrt(nrow(results)))
par(mfrow=c(n,n), mar=rep(1,4))
lapply(1:nrow(results), function(i) {
  print(i)
  src <- as.character(results[i, 'image'])
  discount <- results[i, 'discount']
  download.file(src,'temp.jpg', mode = 'wb')
  jj <- readJPEG("temp.jpg", native = TRUE)
  plot(0:1,0:1,type="n", axes = FALSE, main = paste0(i, ' : $', discount, ' off'))
  rasterImage(jj,0,0,1,1)
})
And that’s how you can use R and rvest to do web scraping to find the best online shopping bargains! Hurray!
Ok, all joking aside, doing this in R may not be the most convenient solution since I have to bounce back and forth between my R terminal and my web browser (a Chrome extension would be better in that sense). But this is just to show how R and rvest can be used for web-scraping and how programming can be used for more than just data analysis.
For more creative coding, check out of some my other fun products:
- aRt with code - generate custom art using R
- CuSTEMized - generate personalized STEM storybooks
Recent Posts
- AI-guided data visualization of gas prices in different geographical locations across the US over time on 04 May 2026
- The Mentorship Index on 01 March 2026
- Vibe coding with SEraster and STcompare to compare spatial transcriptomics technologies on 22 February 2026
- RNA velocity in situ infers gene expression dynamics using spatial transcriptomics data on 13 October 2025
- Analyzing ICE Arrest Data - Part 2 on 27 September 2025