Creating RNA-velocity informed 2D embeddings for single cell transcriptomics
VeloViz with Dynamic Velocity Estimates
In this vignette, we will create a velocity-informed 2D embedding of pancreas development scRNAseq using VeloViz. We will use dynamic velocity estimated using scVelo to construct the VeloViz embedding and we will also use scVelo’s velocity streams to illustrate velocity on the embedding. To do this in R, we will make use of the reticulate package (see this tutorial for a quick primer).
Get data and compute velocity
This data is available with the scVelo package (Bergen et. al. Nature Biotech, 2020, Bastidas-Ponce et. al. Development, 2019).
First, load pancreas data from scVelo package and extract the relevant meta data that we’ll need later.
adata = scv$datasets$pancreas()

#gene and cell names
genes <- adata$var_names$values
cells <- adata$obs_names$values

#cell type assignments
clusters <- adata$obs$clusters
names(clusters) <- cells

#colors
col = rev(plasma(length(levels(clusters))))
cell.cols = col[clusters]
names(cell.cols) = names(clusters)
Now, we compute velocity by dynamical modeling.
## run scvelo dynamic model
scv$pp$filter_genes(adata) ## filter
scv$pp$moments(adata) ## normalize and compute moments
scv$tl$recover_dynamics(adata) ## model

scv$tl$velocity(adata, mode='dynamical')
scv$tl$velocity_graph(adata)
Get VeloViz inputs
To construct the VeloViz embedding we need the current observed expression and the predicted future expression. We can calculate the predicted future expression from the current observed expression and the velocity.
#get velocity
vel <- adata$layers[['velocity']]
colnames(vel) <- genes
rownames(vel) <- cells

vel.genes <- genes[colSums(vel, na.rm=T)>0]
vel <- vel[,vel.genes]

#get current
curr <- adata$X

colnames(curr) <- genes
rownames(curr) <- cells
curr <- as.matrix(curr)[,vel.genes]
curr <- t(curr)

#compute projected
proj <- curr + t(vel)
proj[proj<0] <- 0
Build VeloViz embedding
veloviz = buildVeloviz(
curr = curr, proj = proj,
normalize.depth = TRUE,
use.ods.genes = TRUE,
alpha = 0.05,
pca = TRUE,
nPCs = 20,
center = TRUE,
scale = TRUE,
k = 20,
similarity.threshold = 0.2,
distance.weight = 1,
distance.threshold = 1,
weighted = TRUE,
seed = 0,
verbose = FALSE
)
emb.veloviz <- veloviz$fdg_coords
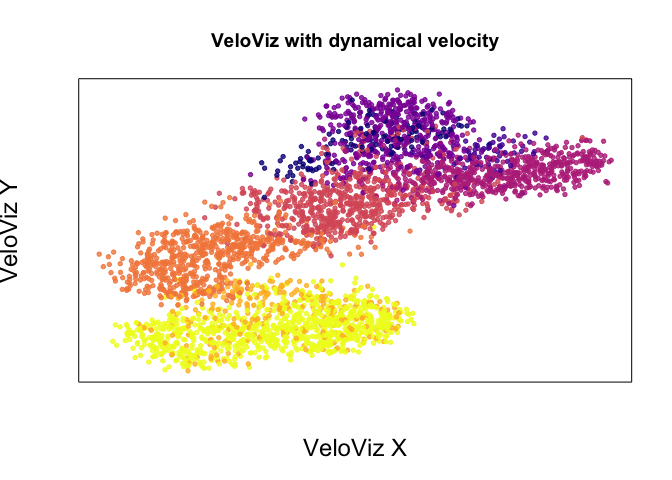
plotEmbedding(emb.veloviz, colors = cell.cols[rownames(emb.veloviz)], main='VeloViz with dynamical velocity',
xlab = "VeloViz X", ylab = "VeloViz Y",
alpha = 0.8,
cex.lab = 1.5)
Plot velocity streams
a.plot <- adata
#remove unconnected cells from anndata object
connected.cells <- rownames(emb.veloviz)
a.plot.vv <- a.plot[a.plot$obs_names$isin(connected.cells)]
a.plot.vv$obsm$update("X_veloviz1" = emb.veloviz)
#get colors
plot.cols = unique(cell.cols)
c = unlist(sapply(c(1:length(col)), function(x) which(plot.cols == col[x])))
plot.cols = plot.cols[c]
#plotting params
pt.size = 50
dnsty = 0.7
plt.size = c(3.5,3.5)
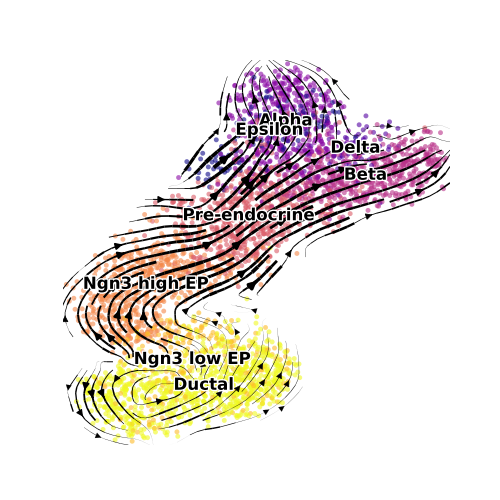
scv$pl$velocity_embedding_stream(a.plot.vv, basis='veloviz1',
density = 0.8, cutoff_perc = 0, n_neighbors = 20L, title = "",legend_fontoutline = 2,
size = 50, alpha = 0.6, legend_fontsize = 12, linewidth = 1.5,
show = FALSE, figsize = c(5,5), palette = plot.cols) #, legend_loc = "lower left")
# plt$show()
plt$savefig("panc_dynamic_velocity.png")
Remove pre-endocrine intermediates
adata <- scv$datasets$pancreas()

#gene and cell names
genes <- adata$var_names$values
cells <- adata$obs_names$values

#cell type assignments
clusters <- adata$obs$clusters
names(clusters) <- cells

#colors
col <- rev(plasma(length(levels(clusters))))
cell.cols = col[clusters]
names(cell.cols) = names(clusters)

adata.missing <- adata[adata$obs$clusters != "Pre-endocrine"]
cells <- cells[adata$obs$clusters != "Pre-endocrine"]
Now, we re-compute velocity by dynamical modeling.
## run scvelo dynamic model
scv$pp$filter_genes(adata.missing) ## filter
scv$pp$moments(adata.missing) ## normalize and compute moments
scv$tl$recover_dynamics(adata.missing) ## model

scv$tl$velocity(adata.missing, mode='dynamical')
scv$tl$velocity_graph(adata.missing)
Get VeloViz inputs
#get velocity
vel <- adata.missing$layers[['velocity']]
colnames(vel) <- genes
rownames(vel) <- cells

vel.genes <- genes[colSums(vel, na.rm=T)>0]
vel <- vel[,vel.genes]

#get current
curr <- adata.missing$X

colnames(curr) <- genes
rownames(curr) <- cells
curr <- as.matrix(curr)[,vel.genes]
curr <- t(curr)

#compute projected
proj <- curr + t(vel)
proj[proj<0] <- 0
Build VeloViz embedding
veloviz = buildVeloviz(
curr = curr, proj = proj,
normalize.depth = TRUE,
use.ods.genes = TRUE,
alpha = 0.05,
pca = TRUE,
nPCs = 20,
center = TRUE,
scale = TRUE,
k = 20,
similarity.threshold = 0.2,
distance.weight = 1,
distance.threshold = 1,
weighted = TRUE,
seed = 0,
verbose = FALSE
)
emb.veloviz <- veloviz$fdg_coords
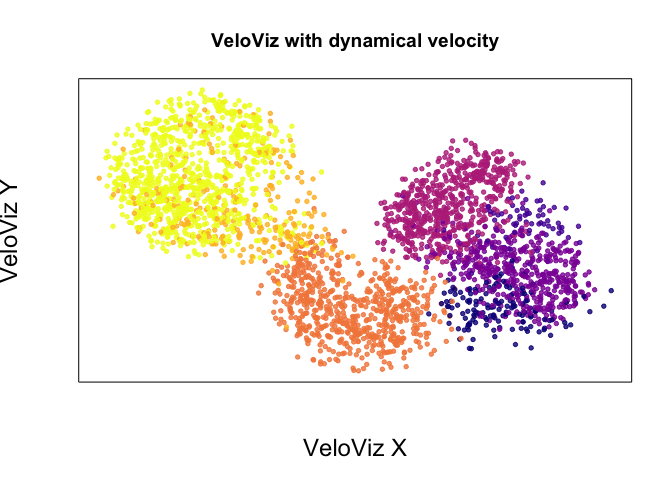
plotEmbedding(emb.veloviz, colors = cell.cols[rownames(emb.veloviz)], main='VeloViz with dynamical velocity',
xlab = "VeloViz X", ylab = "VeloViz Y",
alpha = 0.8,
cex.lab = 1.5)
Plot velocity streams
a.plot <- adata.missing
#remove unconnected cells from anndata object
connected.cells <- rownames(emb.veloviz)
a.plot.vv <- a.plot[a.plot$obs_names$isin(connected.cells)]
a.plot.vv$obsm$update("X_veloviz1" = emb.veloviz)
#get colors
plot.cols = unique(cell.cols)
c = unlist(sapply(c(1:length(col)), function(x) which(plot.cols == col[x])))
plot.cols = plot.cols[c]
#plotting params
pt.size = 50
dnsty = 0.7
plt.size = c(3.5,3.5)
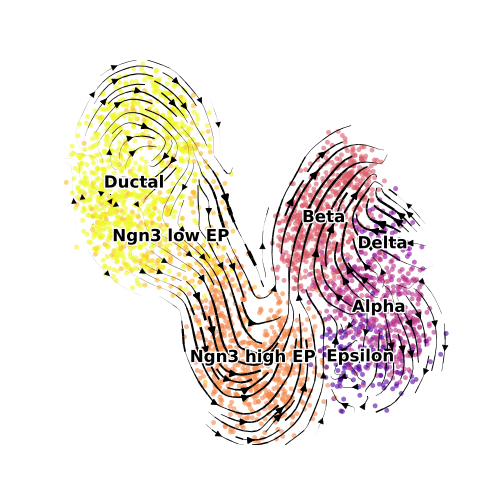
scv$pl$velocity_embedding_stream(a.plot.vv, basis='veloviz1',
density = 0.8, cutoff_perc = 0, n_neighbors = 20L, title = "",legend_fontoutline = 2,
size = 50, alpha = 0.6, legend_fontsize = 12, linewidth = 1.5,
show = FALSE, figsize = c(5,5), palette = plot.cols) #, legend_loc = "lower left")
# plt$show()
plt$savefig("panc_dynamic_velocity_missing.png")
Other tutorials
Getting Started
scRNA-seq data preprocessing and visualization using VeloViz
MERFISH cell cycle visualization using VeloViz
Understanding VeloViz parameters
Visualizing the VeloViz graph using UMAP