Coloring SVGs in R
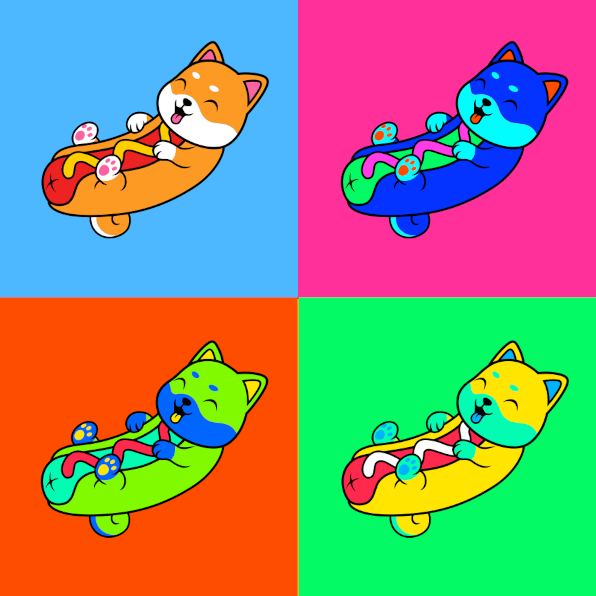
Beyond spatial transcriptomics analysis, coding is a useful skill for lots of other fun things too! So just for fun, in this blog post, I use R to recolor an SVG to make some funny colored hot dog dogs.
Getting Started
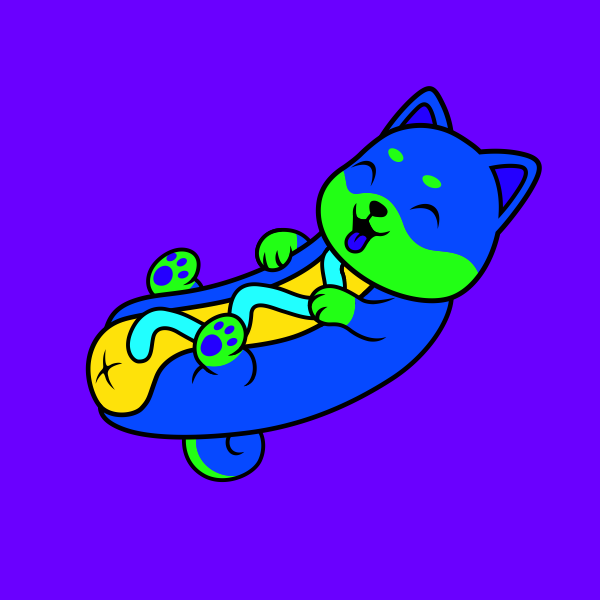
Let’s first read in an SVG image into R using svgparser. For the SVG image we’re using, I simplified an SVG image by catalyststuff just so that we can have fewer paths to deal with (more on paths later).

svgparser parses the SVG elements into grid graphical objects, aka “grobs”. So we can use grid to display the original SVG image as a grob.
library(grid)
library(svgparser)

## read in file
file <- 'hotdogdog.svg'
img_grob <- svgparser::read_svg(file)

## show original
grid::grid.newpage()
grid::grid.draw(img_grob)

What is an SVG?
SVGs, or Scalable Vector Graphics, are an XML-based markup language for describing 2D vector graphics. Vector graphics is the set of mechanisms for creating visual images directly from geometric shapes.
If we look at the SVG image using a text editor, we can see that it is just a series of geometric paths defined by sets of 2D points with colors set by hexadecimal fills.
<?xml version="1.0" encoding="UTF-8" standalone="no"?>
<svg
   version="1.1"
   baseProfile="full"
   xmlns="http://www.w3.org/2000/svg"
   width="5333.3335"
   height="5333.3335"
   viewBox="0 0 5333.3335 5333.3335"
   >
   <path
   d="M 0,5333.3333 H 5333.3332 V 1e-4 H 0 Z"
   style="fill:#4db7ff;"
   id="path14" /><path
   d="m 1766.2,3819.6667 c -71.5467,4.1466 -121.4534,7.24 -121.4534,7.24 -25.28,103.3866 -13.7866,298.68 165.4134,399.76 119.6933,67.52 275.1866,44.7866 383.7866,-17.4267 -264.7733,94.8667 -530.4,-136.0267 -427.7466,-389.5733"
   style="fill:#ffffff;"
   id="path18" /><path
We can see these paths read in as individual grobs in R as well.
## get elements
ls <- grid::grid.ls()
print(head(ls))
names <- ls$name[grepl('pathgrob', ls$name)]
print(head(names))
[1] "GRID.pathgrob.4257" "GRID.pathgrob.4260" "GRID.pathgrob.4263" "GRID.pathgrob.4266" "GRID.pathgrob.4270"
[6] "GRID.pathgrob.4273"
## check one
name <- names[1]
ngrob <- grid.get(gPath(name))
print(names(ngrob))
print(names(ngrob$gp))
print(ngrob$gp$fill )
 [1] "x"              "y"              "id"             "id.lengths"     "pathId"         "pathId.lengths" "rule"
 [8] "name"           "gp"             "vp"
 [1] "col"        "fill"       "alpha"      "lwd"        "lineend"    "linejoin"   "linemitre"  "fontsize"   "cex"
[10] "fontface"   "fontfamily" "font"
[1] "#4DB7FFFF"
Recoloring our SVG
To recolor our SVG, we should be able to just change the path fill colors to something new. So let’s first grab the current fill colors used by these paths.
## grab original fill colors
fills <- sapply(names, function(name) {
  ngrob <- grid.get(gPath(name))
  ngrob$gp$fill
})
ncols <- length(unique(fills))

table(fills)
fills
#000000FF #4D4D9DFF #4DB7FFFF #CA7B34FF #CA9368FF #CC721DFF #CCB97DFF #CCCCE3FF #ED1821FF #FC63A2FF #FC9A24FF #FDB866FF
       38         2         1         1         2         1         1         1         1        11         9         1
#FFCE00FF #FFFFFFFF
        1        13
We can see some paths share the same color. For example, there are 38 paths that are black aka #000000FF. In our recoloring, we will keep this pattern for now. So if two paths previously shared the same color, in the recoloring, they will still share the same color. We will sample from a random palette of 20 rainbow colors for our new colors. I will maintain the black outlines though so the paths previously colored black will remain black just for aesthetic purposes.
## recolor
set.seed(100)
rand_colors <- sample(rainbow(20),ncols)
new_colors <- as.factor(fills)
levels(new_colors) = rand_colors
new_colors <- as.character(new_colors)
new_colors[fills == "#000000FF"] <- "#000000FF" ## maintain black outline
names(new_colors) <- names(fills)
table(new_colors)
new_colors
#000000FF   #001AFF   #0066FF   #00B3FF   #00FF19   #00FFFF   #3300FF   #33FF00   #7F00FF   #80FF00   #CC00FF   #FF0099
       38         1         9         2        13         1        11         1         1         2         1         1
  #FF4D00   #FFE500
        1         1
Now we can recolor our paths by setting their fills to their new random colors and then redrawing them!
## draw with new colors
sapply(names, function(name) {
  ngrob <- grid::grid.get(gPath(name))
  ngrob$gp$fill <- new_colors[name]
  grid::grid.draw(ngrob)
})
Try it out for yourself!
- Try just using any random colors rather than having paths that previously used the same colors continue to share colors.
- Can you identify the paths corresponding to the mustard swirl? What we if also randomly toggle these paths on and off?
- Find your own SVG image and try it out for yourself
Recent Posts
- AI-guided data visualization of gas prices in different geographical locations across the US over time on 04 May 2026
- The Mentorship Index on 01 March 2026
- Vibe coding with SEraster and STcompare to compare spatial transcriptomics technologies on 22 February 2026
- RNA velocity in situ infers gene expression dynamics using spatial transcriptomics data on 13 October 2025
- Analyzing ICE Arrest Data - Part 2 on 27 September 2025